



📊 Quick overview of the current situation
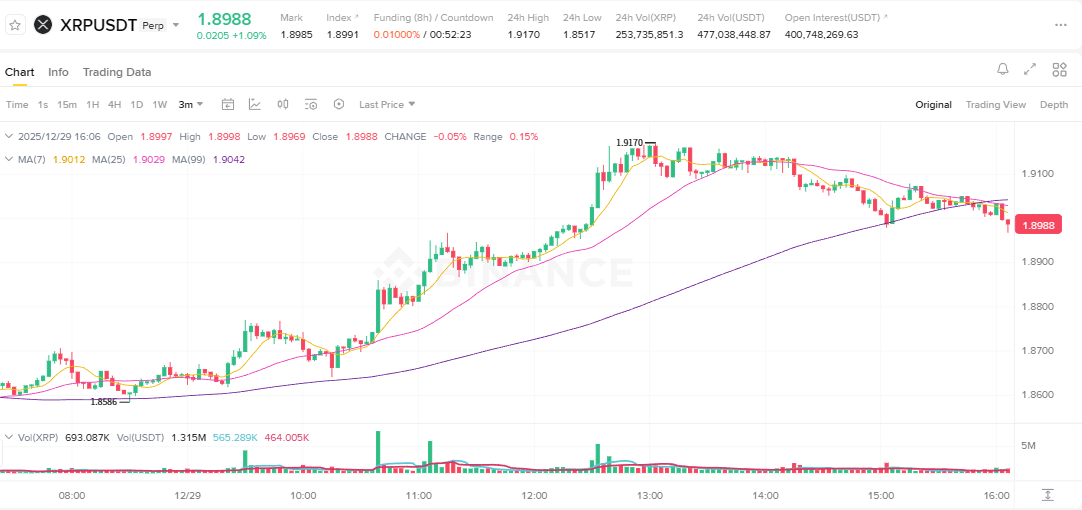
Current price: about 1.8988
Short-term trend: after a strong increase, the price is entering a technical correction phase
Medium-term trend: still maintaining an uptrend
Volatility: gradually decreasing, the market shows signs of accumulation and compression
📈 Structure of moving averages (MA)
The current chart includes key MA lines including MA7, MA25, and MA99.
After the previous uptrend, MA7 and MA25 began to flatten or slightly decline, indicating that short-term upward momentum is weakening. Meanwhile, MA99 (the purple line) is still trending up, reflecting that the medium-term trend has not been broken.
👉 This is a familiar pattern of short-term adjustments in the medium-term uptrend.
This means that:
Chasing buys at the current time has no clear advantage
However, there is still no signal confirming that the uptrend has ended
🔻 Price movement analysis
The price surged from the area of 1.858 to the peak of 1.917, accompanied by active trading volume
After reaching 1.917, the price cannot create a new peak
The peak is lower than the previous peak, the bottom is also gradually lower → forming a descending correction channel
At the current time:
The price is approaching the lower edge of the converging triangle model
Meanwhile, still holding above MA99, not breaking the medium-term uptrend structure
👉 This is a sensitive area where the market is likely to choose a direction in the near future.
🔑 Important support and resistance zones
🟢 Support zone
1.89 ~ 1.885
Coinciding with the MA99 zone and the current price zone
If broken, the likelihood of the adjustment phase will widen
1.875 ~ 1.88
If this zone breaks, short-term long positions should be closed
🔴 Resistance zone
1.905 ~ 1.91
The first resistance zone when the price retraces
1.917
Daily peak, strong selling pressure area
Only when this zone is clearly broken will the uptrend be confirmed to continue
📉 Perspective from trading volume
Compared to the previous strong uptrend, the current volume is decreasing
Recent retracements have not accompanied an explosion in volume
👉 This indicates:
The current decline is not a sell-off
But there has not yet been strong active buying money
= The market is in a sideways state, waiting for trend confirmation signals
🧠 Reference trading strategy
✅ Long scenario
Monitor the zone of 1.885 ~ 1.89 holding steady
A candle with a long lower shadow appears with decreasing volume
Only suitable for short-term retracement trading
Target: 1.905 ~ 1.91
Stop loss: when the price breaks below 1.88
❌ Should not long chase at the current price zone
The risk/reward ratio is not attractive
Risk of being caught in the short-term peak
⚠️ Short scenario
When the price retraces to the zone of 1.91 ~ 1.917 but cannot surpass it
Consider shorting in the short term
Target: 1.89 / 1.88
Note: the medium-term trend is still upward, do not hold short positions too long
🔚 Conclusion
XRP is still in a medium-term uptrend; however, in the short term, the price is entering an adjustment and accumulation phase. The area of 1.885 ~ 1.89 is an important dividing line. At the current time, the most reasonable strategy is to patiently wait for clear signals, avoiding hasty trading.