


🔎 Technical analysis of Bitcoin (BTCUSDT) based on the 3-minute chart
■ Price and candle state
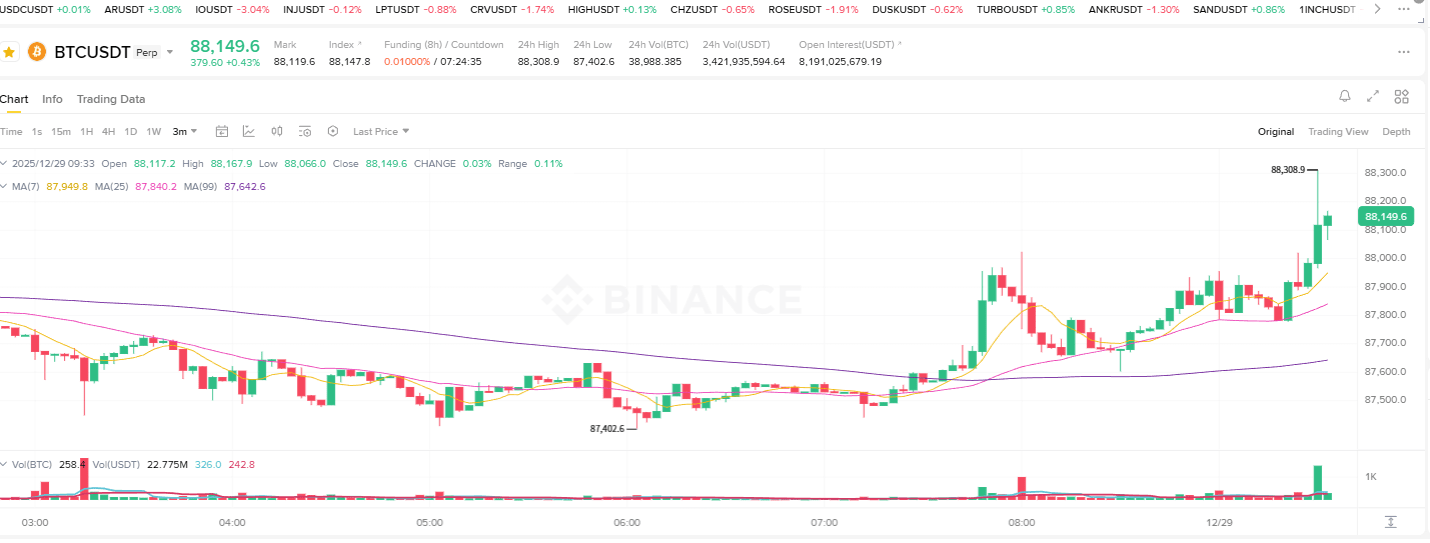
The current price is forming around 88,149 USD.
The short-term low is established at around 87,402 USD, followed by a higher low structure.
Recent candles have continuously shown strong bullish candles, indicating increasing short-term buying pressure.
The most recent peak was formed around 88,308 USD.
■ Moving averages (MA7 · MA25 · MA99)
The price is above MA7, MA25, and MA99.
After MA7 crosses above MA25, the gap between the two lines continues to widen.
MA25 has turned bullish while MA99 still maintains a slight downward slope.
In the short term, the moving averages are forming a bullish alignment.
■ Trading volume
Compared to the previous sideways phase, volume has significantly increased during the bullish candles.
The recent uptrend is accompanied by noticeable trading volume expansion.
After the upward movement, the volume did not decrease significantly but remained stable.
■ Price structure
After forming a low at 87,402 USD, both the peak and low show a higher trend.
The price has broken through the area that once acted as a downtrend line and continues to hold above this area.
The short-term structure shows a recovery and continuation of the uptrend.
■ Summary of the main structure on the chart
Forming higher lows.
Short-term moving averages are arranged in ascending order.
Price increases accompanied by expanded trading volume.
The price is currently fluctuating near the previous peak.