
Today, we will look into the sudden drop of Dogecoin.
What is Dogecoin?
Dogecoin (Dogecoin, DOGE) is a cryptocurrency that originated from the internet meme culture in 2013, using an image of the Japanese Shiba Inu as its symbol. Initially created to satirize the cryptocurrency craze similar to Bitcoin, it later established itself as an independent digital asset due to the growth of community-driven dissemination and use cases.
Dogecoin has a structure based on Litecoin, characterized by fast transaction processing speeds and low fees. Because of these characteristics, it has started to be used for small payments, tipping, and sponsorship, expanding its usage primarily around online communities.
Additionally, Dogecoin has an inflation structure with no upper limit on its issuance. This characteristic makes it different from assets that emphasize scarcity like Bitcoin, and it is often perceived more as a payment method or a community-based asset rather than a long-term holding asset.
Recently, the public awareness of Dogecoin has significantly increased due to Elon Musk's remarks and social media issues, leading to an expansion of price volatility. Because of these characteristics, Dogecoin is evaluated as a coin that reacts sensitively to market sentiment and psychological changes.
If you are curious about the trend of Dogecoin, I recommend signing up for Binance to check the market trends through the Binance chart, and I will also leave the link for a 20% discount on fees below.
➡️ Direct link to sign up for Binance (including a 20% discount on fees!)
🔎 Technical analysis based on the Dogecoin (DOGE/USDT) chart (3-minute candlestick)
Price and candlestick status
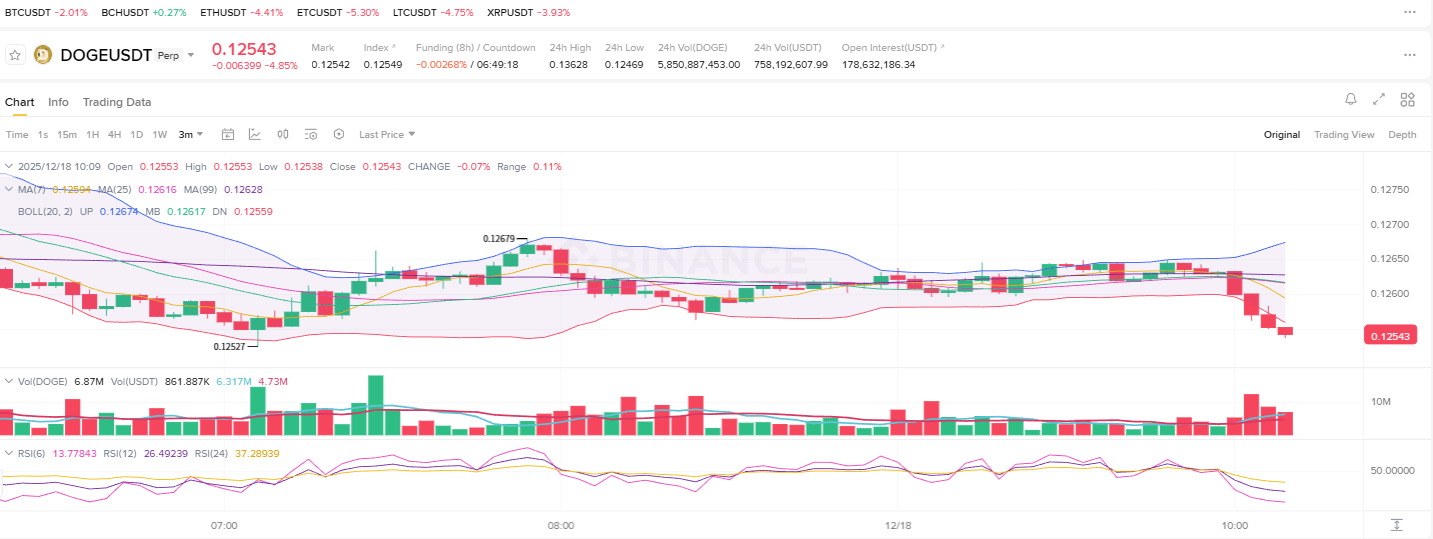
The current price is around $0.1254.
The short-term high point is $0.12679, and a trend of lowering the high point is observed.
In recent candlesticks, continuous bearish candlesticks have appeared, confirming short-term downward pressure.
In the decline phase, the candlestick body has elongated, indicating increased volatility.
Moving Average (MA7 · MA25 · MA99)
The price has fallen below MA7, MA25, and MA99.
The short-term moving average (MA7) has bent downwards and fallen below MA25.
MA25 and MA99 show a gentle downward or horizontal slope.
The arrangement of moving averages has transitioned from a normal arrangement to a mixed and bearish structure.
Bollinger Band (BOLL 20, 2)
A candlestick has been confirmed to have fallen below the lower band.
The lower Bollinger Band widening downwards indicates a signal for increased volatility.
Recovery above the center line (MB) is not currently observed in the chart.
In the short term, the lower band pressure zone is being maintained.
Trading Volume (Volume)
An increase in trading volume has been observed alongside the recent downward candlestick.
Trading volume during the decline is relatively larger compared to the previous consolidation period.
Both buying and selling trading volumes have increased, but the price is moving downwards.
RSI (6 · 12 · 24)
RSI6: about 13.8, RSI12: about 26.4, RSI24: about 37.3
The short-term RSI (6·12) has entered the oversold zone.
RSI24 is also moving downwards below the neutral line (50).
The overall RSI is aligned in a downward direction.
Price structure
The low point is formed around $0.12527.
A structure of gradually lowering highs has emerged since the previous rebound.
The recent trend is confirmed as a low point testing period.
There was an attempt to rebound, but it could not renew the high point and showed a further decline.
Summary of the structure observed in the chart
The price is located below the major moving averages.
Formation of a zone below the lower Bollinger Band.
Increase in trading volume during the decline.
Both short-term and medium-term RSI are in a downward pressure state.
The high point decline structure and low point re-confirmation trend continue.
Guide to signing up for Binance
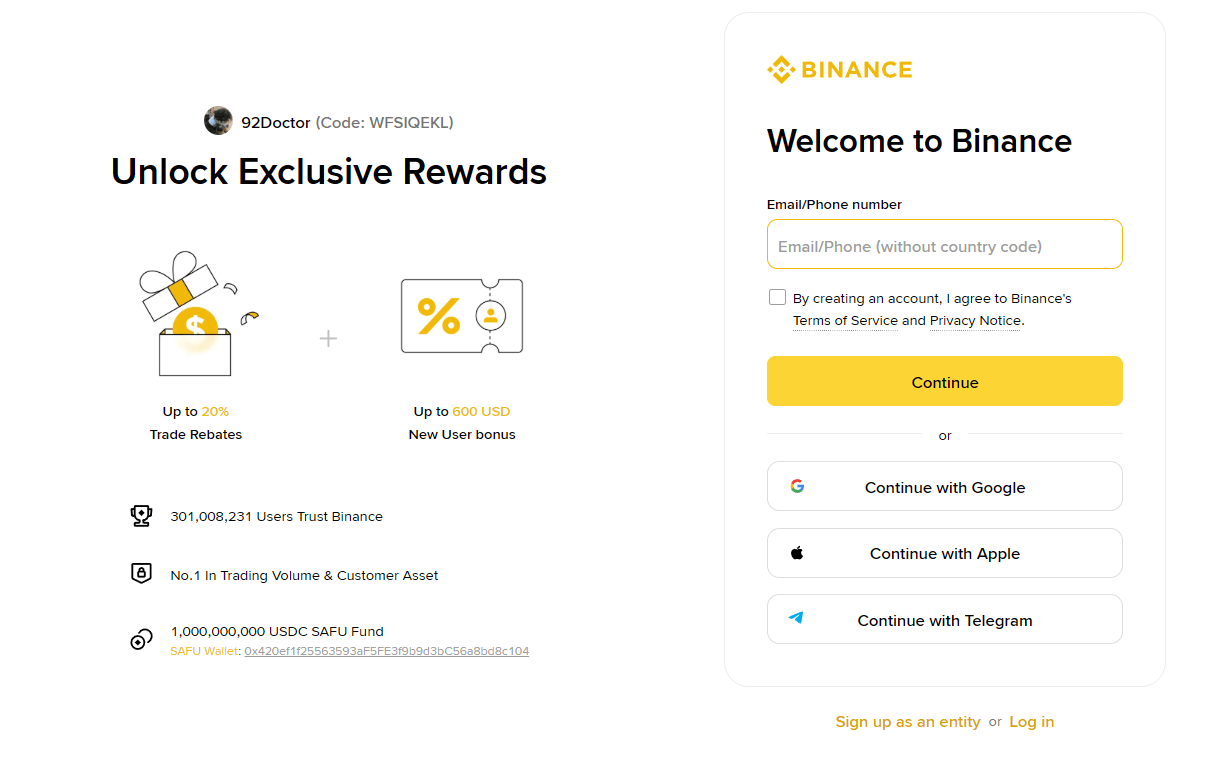
Binance is the world's largest cryptocurrency exchange by trading volume, providing high liquidity and a stable system for both spot and futures trading.
By signing up through the link below, you can receive a 20% discount on trading fees, which applies not only to new members but also to existing members who meet the conditions.
To use futures trading, registration and KYC verification are mandatory, and it is recommended to also set up OTP security for fund protection. If you have not yet used Binance, it is advantageous to sign up through the referral link.
🎄 Get a 20% discount on fees and go directly to sign up for Binance
Both new and existing members can receive a 20% discount on fees if they meet the following five conditions.
The invited person already has a registered account on Binance.
The invited person has never accepted an invitation before.
The invited person's account has not engaged in trading or using products on the Binance platform for the past 180 days.
A confirmation window appears when a qualified inviter opens the link and logs in.
The inviter's binding takes effect when [Bind Now] is clicked.