



📝 Fed Rate Cut Probability Status (CME FedWatch) ➡️ Markets are still pricing in a greater likelihood of a freeze
Probability of a 25bp cut in the base rate in January next year: 24.4%
Rate freeze probability: 75.6%
As of March, the probability of a cumulative 25bp cut is 40.4%.
Chance of freezing until March: 52%
Accumulated probability of a 50bp cut: 7.6%
➡️ In the short term, the scenario of maintaining the current level is more favorable than a reduction, but the possibility of a reduction is gradually reflected as we move into March.
📉 The next variable the market is paying attention to ➡️ Inflation indicators are a key factor in determining the interest rate path.
U.S. Bureau of Labor Statistics (BLS)
December Producer Price Index (PPI)
Announcement Date: January 30th
➡️ PPI is an indicator that shows the price flow at the corporate level, and is a direct reference indicator for future consumer price index (CPI) → Federal Reserve policy judgment
🔍 Key Summary
The Fed is likely to keep interest rates on hold in the short term.
The downward scenario will be gradually reflected only after March.
The price index (PPI/CPI) is a key variable in determining future interest rate direction.
The market is still in a wait-and-see mode rather than a period of confidence.
In this market, many people use Binance and use it as a market indicator. If you're interested in Binance, sign up through the link below. You'll receive a 20% discount on trading fees.
🔗 Sign-up Link: Go to the official Binance sign-up link
Bitcoin's Current Sideways Movement? Chart and Indicator Analysis
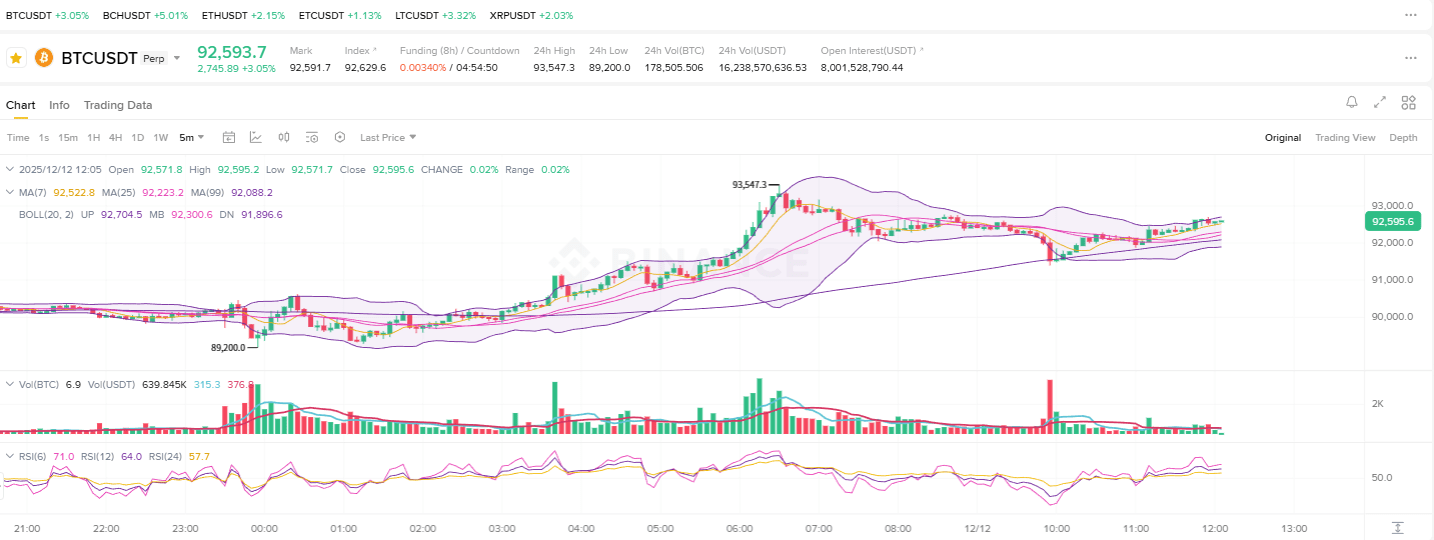
■ Moving averages (MA7, MA25, MA99)
The price is formed above the three moving averages: MA7, MA25, and MA99.
The correct arrangement structure is maintained as it is arranged in the order of MA7 > MA25 > MA99.
The gap between the three moving averages is evenly spaced, and the moving averages have been continuously rising within the recent period.
The price frequently moves past MA7 and then rebounds.
Bollinger Bands (BOLL 20, 2)
The price is moving above the center line (MB), with frequent pauses near the upper band.
After touching the upper band, an adjustment occurs and a rebound is repeated near the center line.
Overall, the Bollinger Bands are showing an upward slope, maintaining volatility within the upward trend.
In recent minutes, the band width has narrowed slightly, indicating a reduction in short-term volatility.
Volume
There is a period between approximately 3:00 and 7:00 where trading volume increases significantly.
A high of $93,547.3 was formed immediately after the surge in trading volume.
After that, the trading volume gradually decreased and remained at a relatively constant level.
The recent period has seen prices move in a narrow range with low trading volume.
RSI(6 · 12 · 24)
RSI6 standard: After a high of around 70, it is currently moving between 50 and 60.
RSI12 standard: It is moving around the mid-60s, and overbought/oversold levels are not clear.
RSI24 standard: Maintain within the range of 55 to 60.
Overall, the RSI indicator is in a neutral to weak upward trend.
Pricing structure
After forming a major low at $89,200, a continuous high-low upward trend continued.
Recent high measured at $93,547.3.
After forming a high point, a gentle adjustment took place, and the price maintained its movement above the upward trend line (upward slope).
The recent section has formed a narrow range of short-term sideways movement (squeeze) above the moving average line.
🔍 Key takeaways from the chart (fact-based)
It moves above the three moving averages and maintains a positive arrangement structure.
Bollinger Bands are upward-sloping, with prices moving repeatedly between the upper and center lines.
Trading volume increased significantly when the peak was formed and then steadily decreased.
RSI remains in the neutral to upper mid-range overall.
The price structure is in a clear upward trend with both highs and lows rising.
The recent trend is a narrow-range, short-term adjustment/sideways structure.
📌 Sign up using the link below and receive a lifetime 20% discount on trading fees!
🔗 Sign-up link: Go to get 20% discount on Binance fees