



📝 Change in stablecoin trading volume ➡️ The entire market itself has entered a "breathing" phase.
Daily average trading volume decreased by -26% compared to the previous period.
The impact of liquidity contraction on the entire virtual asset market is expanding.
Reduction in stablecoin circulation = decrease in market participants.
📉 DeFi and NFT activity has slowed down ➡️ A signal that investors have shifted from active investment to a wait-and-see approach.
Both DeFi trading volume and user numbers have decreased.
Activity in the NFT market has also significantly decreased.
The overall risk-averse sentiment in the market has strengthened.
📊 Change in market capitalization of Bitcoin and Ethereum ➡️ Market funds are shifting to a "BTC-centered conservative position."
Bitcoin: $1.8 trillion, about a 17% decrease.
Ethereum: $361 billion, about a 22% decrease.
BTC maintains a relatively defensive flow compared to ETH.
📉 Compared to traditional financial markets ➡️ Among risk assets, "only virtual assets are falling more sharply."
S&P 500 remains flat
Nasdaq 100 down about -2%
Adjustments are much gentler than in the digital asset market.
🔍 Market key summary
Liquidity weakness deepens due to decreased stablecoin trading volume
DeFi and NFTs also in a concurrent slump → cooling investor sentiment
Ethereum has adjusted more significantly than Bitcoin.
Digital assets have suffered excessive declines compared to traditional markets.
In the short term, a contraction + strengthening wait-and-see sentiment phase.
📌 By signing up through the invitation link below, you can receive a 20% discount on trading fees.
🔗 Sign-up link ➡️Go to receive a 20% discount on Binance fees.
🔎 Technical analysis based on the ETHUSDT chart (3-minute candles)
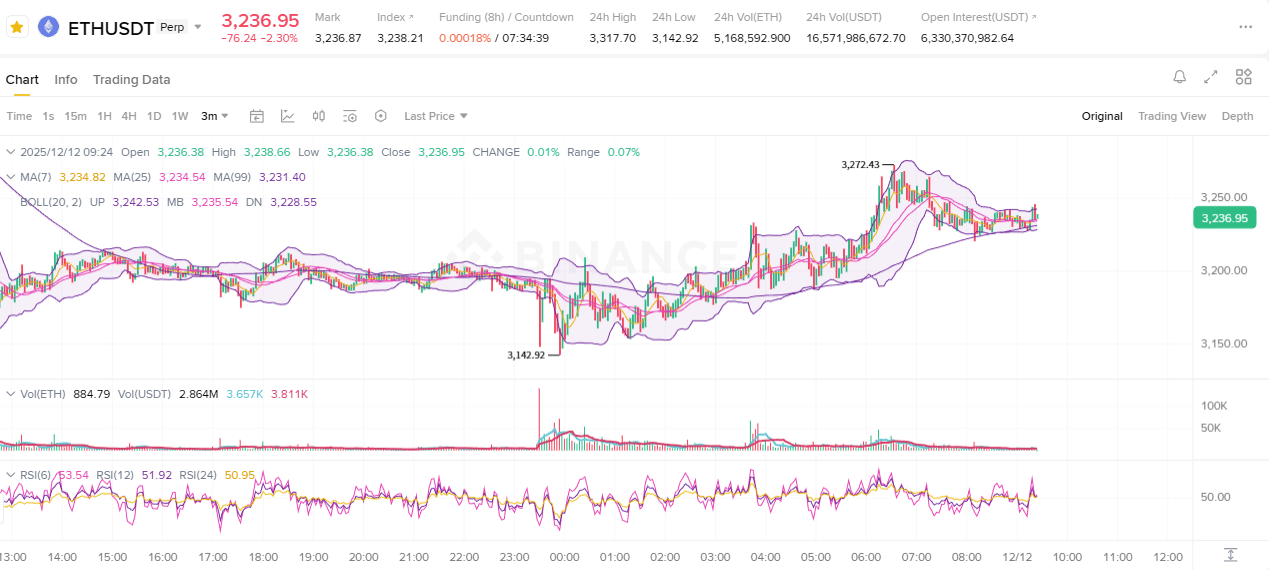
Moving averages (MA7, MA25, MA99)
The current price shows a trend stagnation area where MA7, MA25, and MA99 all cross from above.
The gap between the three moving averages is narrowing, forming a neutral structure with repeated regular and inverse arrangements.
Recently, the price has repeatedly confirmed support near MA25.
Bollinger Bands (BOLL 20, 2)
The price oscillates around the center line (MB), showing fluctuations within a certain range between upper and lower bands.
Upper band (UP) and lower band (DN) are not significantly wide, confirming a relatively narrow stable volatility range.
After several touches of the upper band, a rebound occurred, and a short-term box movement is observed with repeated rebounds from the lower band.
Trading volume (Volume)
Overall, trading volume remains consistently low.
There was a period of increased trading volume with longer candles around a specific time (about 06:00~07:00).
Subsequently, trading volume has decreased again, leading to a structure of stabilized volatility.
RSI (6, 12, 24)
RSI mostly moves around 50, with no distinct overbought or oversold signals.
Based on RSI6 alone, there were several signals of rise above 60, and during declines, it has dropped to the low 40s.
Both RSI12 and RSI24 maintain a neutral range, showing a non-directional oscillatory flow.
Price structure
The previous major low was $3,142.92, and a consistent rise in lows has been confirmed.
The recent peak was recorded at $3,272.43.
Since then, the price has been progressing in a convergence range with narrowing gaps between highs and lows.
Overall, a clear structure of sideways adjustment after a short-term rise is evident.
🔍 Key summary as seen on the chart
Moving averages have repeatedly shown neutral arrangements over a certain period, with no strong directional signals.
The price is moving in a box range between the upper and lower bands based on the Bollinger center line.
Trading volume remains at a low level except for certain intervals.
RSI fluctuates mostly around 50, indicating a neutral indicator state.
Price structure shows a rise in lows → formation of short-term highs → then maintaining a narrow sideways range.
If you are interested in the Binance chart, you can sign up through the link below.
🔗 Sign-up link ➡️ Go to receive a 20% discount on Binance fees