


Summary of Bitcoin Flows After the Interest Rate Cut
Bitcoin falls slightly despite interest rate cuts
Interest rate cuts already priced in amid a bear market
Growing uncertainty about the number of interest rate cuts next year
Weak upward momentum compared to risky assets
Risky assets such as Nasdaq are rising
Virtual assets have limited upside potential → Investors are cautious
Key Points from Chairman Powell's Remarks
Confirmation of labor market cooling
Determine the interest rate path while monitoring the economic situation
Acknowledging the increased downside risk to employment
Emphasize maintaining the 2% inflation target
💡 What this trend means
The interest rate cut itself was a positive development, but the market had already priced it in.
The speed and frequency of interest rate cuts next year will be key variables going forward.
The virtual asset market is slowing down its response to risky assets.
Slowing employment + lingering inflation → The Fed maintains a cautious easing stance.
In periods of high volatility, stabilizing the basic trading environment is more important than market news.
📌 Wondering how to sign up for Binance?
💻 How to sign up on PC
✅ Step 1: Go to the Binance official website 👉 Click the Sign Up button
✅ Step 2: Enter your information
Enter your email/phone number
Set password
Check whether the referral code is automatically applied
✅ Step 3: Enter the authentication code → Complete account creation
🔐 Essential security settings
KYC verification is required to conduct transactions and deposits/withdrawals.
Google OTP security settings
🎁 Benefits Summary
Discount on transaction fees when using referral code [ WOZFXLOX ]
Participation in new user bonus event
What will happen to XRP after the FOMC?
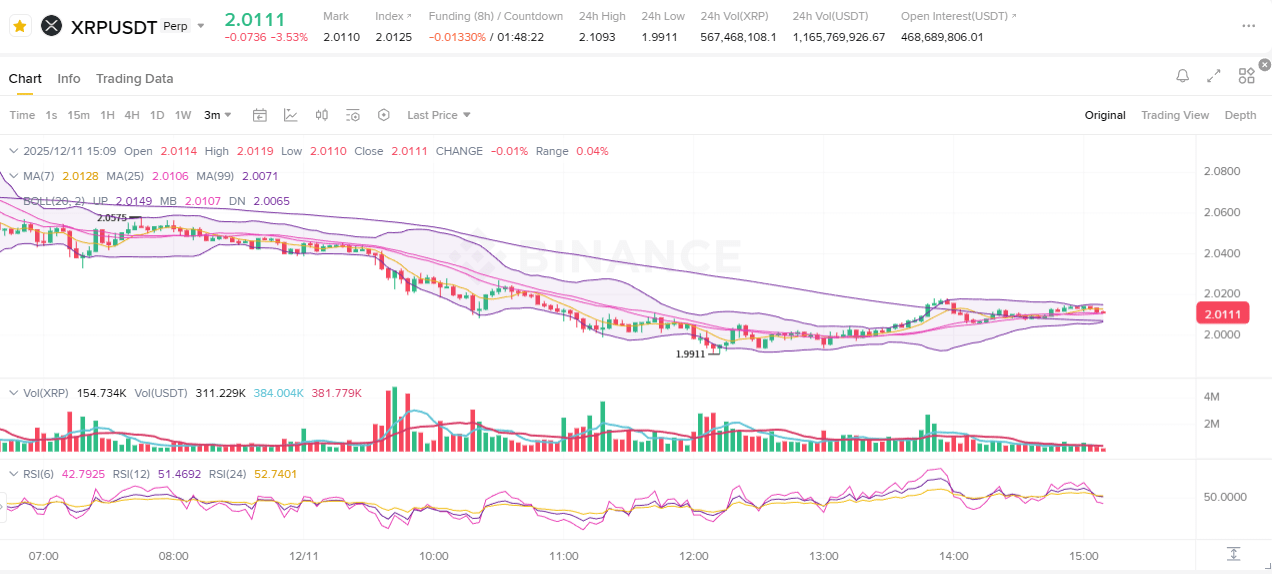
📝 Moving Averages (MA7, MA25, MA99)
XRP price is currently moving below MA7, MA25, and MA99.
Complete reverse array section of the form MA7 < MA25 < MA99
The gap between moving averages is wide, indicating a clear downward trend.
Even if a short-term rebound occurs, MA25 acts as a strong resistance line.
👉 A typical bearish trend where the MA arrangement of altcoins solidifies into a reverse arrangement when BTC falls.
📉 Bollinger Bands
XRP shows a long period of movement along the lower band during the downtrend.
The recent candle recovered to the lower → center line, but failed to break through clearly.
Band width is widening → Volatility is increasing
👉 The fact that the altcoin bands are widening like this right after the BTC drop signals a widespread sell-off in the market.
📊 Volume
Repeated negative candles with increasing volume in a downward trend
The upward momentum is weak due to low trading volume during the rebound.
In the short term, trading volume will decrease and a weak sideways structure will form.
👉 There is no sign of anyone buying strongly yet.
📉 RSI(6·12·24)
RSI (6, 12, 24) are all around the neutral range of 40-52
It is out of the overbought zone (below 30), but it is not very strong.
The gap between indicators is small, so it is currently a period of directional exploration.
👉 XRP also followed the rebound after the BTC decline, but the strength was limited.
🔍 Chart Key Summary
MA reverse arrangement maintained → trend remains weak
Bollinger's lower center movement → Selling pressure prevails
RSI neutral zone → directionless rebound
The overall pattern is a continuous downward structure of low highs and low lows.
Currently, XRP's flow is closely following Bitcoin's decline, and no independent upward momentum has yet emerged.
What is the chart trend of Solana (SOL), which has been attracting attention?
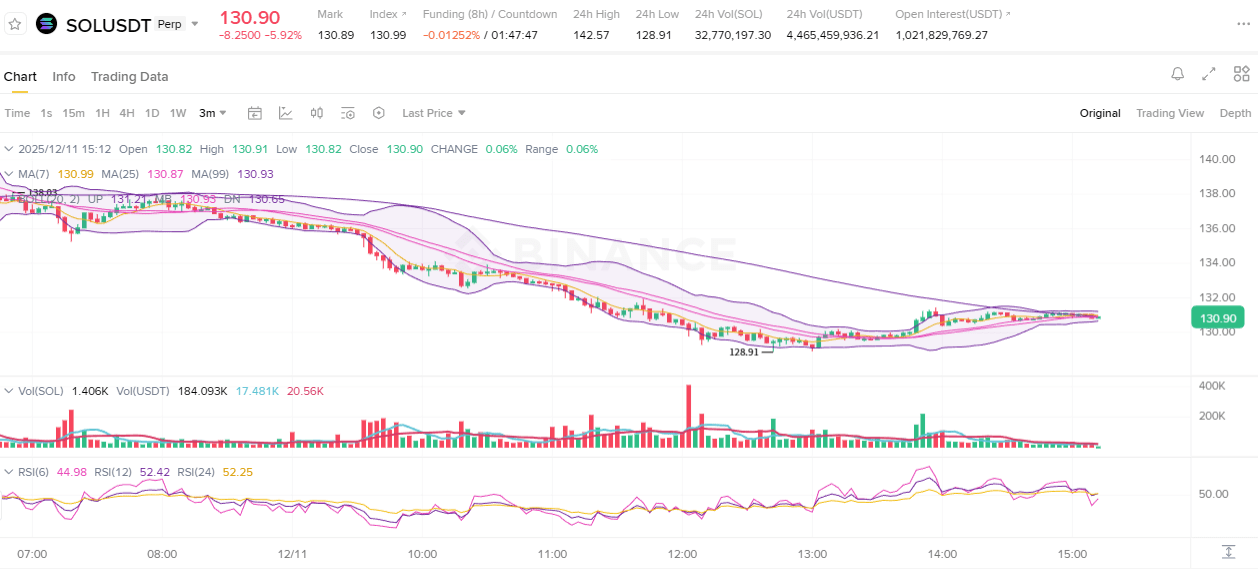
📝 Moving Averages (MA7, MA25, MA99)
The current SOL price is moving below MA7, MA25, and MA99.
Array status: MA7 < MA25 < MA99 → typical inverted array
The gap between moving averages is widening, maintaining the strength of the downtrend.
MA25 is acting as a strong short-term resistance line.
👉 SOL also reflects the weakness of BTC and the overall market.
📉 Bollinger Bands
The SOL price appears to move along the lower band for a long time during the downward process.
Recently, there was an attempt to recover to the center line (MB) with a rebound, but a clear breakthrough failed.
Widening band width → Increased volatility phase
👉 It is still too early to say that the downward pressure has completely ended, and the rebound power is also limited.
📊 Volume
Structure with more selling volume in a downward trend
Momentum is weak due to low trading volume even in short-term rebound periods.
There was an influx of buying power in some sections of the market, but it did not continue.
👉 There isn't enough trading volume to call it a "bottom buy"
📉 RSI(6·12·24)
RSI is in the neutral band between 44 and 52.
It has escaped oversold levels (below 30), but is not in a state of strong upward energy.
The gap between indicators is narrow, so it is a directional exploration stage.
👉 The decline has stopped, but it is difficult to say that it has turned upward.
💰 Pricing Structure
SOL formed a short-term bottom at $128.91
It rebounded afterwards, but resistance was repeated at $131-$132.
The overall structure continues to be a downward trend with lower highs and lower lows.
Short-term resistance: MA25 area (approximately $130.8-$131.7)
Short-term support: around $129
👉 If this resistance is not broken, there is a high possibility of another downtrend.
🔍 SOL Chart Key Summary
Moving average reverse arrangement maintained → trend is still downward
Failure to recover the Bollinger Band center line
Weak trading volume → No strong buying pressure
RSI neutral zone → forming an inflection point
The price structure remains in a downward pattern.
Currently, SOL is being directly affected by the market decline, and although there is a rebound, it is not strong enough to be called a trend reversal.
📌 How to trade XRP/SOL on Binance?
Sign up using the invitation link below and receive a 20% discount on trading fees!
🔗 Sign-up Link ➡️ Go directly to the official Binance sign-up link