


📌 By signing up through the link below, you can receive a 20% discount on trading fees!
🔗 Sign Up Link ➡️ Go to Binance Official Sign Up Link
📝 Summary of This FOMC Decision
Interest Rate Cut Decision
Previous: 3.75~4.00%
Change: 3.50~3.75%
This year, the third consecutive cut
Previous interest rate flow
September Cut: -0.25%p
October Cut: -0.25%p
Maintaining a continuous easing trend of 0.25%p
Chairman Powell's Remarks
The current benchmark interest rate is "within the neutral interest rate range"
The market is also interpreting the possibility of controlling the rate of cuts
💬 Key Assessment from the Federal Reserve
📌 Employment Market
Mention of increasing downside risks to employment over the past few months
Judgment that there has been a burden in achieving the maximum employment rate goal
📌 Prices (Inflation)
Inflation remains somewhat high
Maintains the view that it will take time to achieve full stability
📌 Policy Direction
Considering both employment and inflation goals
Continuously monitoring risk balance while leaving the possibility of adjusting policy pace open
💡 What this interest rate cut means
Continuous cuts = Reflecting concerns about economic slowdown
Mention of neutral interest rate = Decreased likelihood of strong tightening
Signs of employment slowdown = Weakened growth pressure outlook
Inflation remains = Sudden transition to easing is difficult
📉 Bitcoin Chart Analysis After FOMC
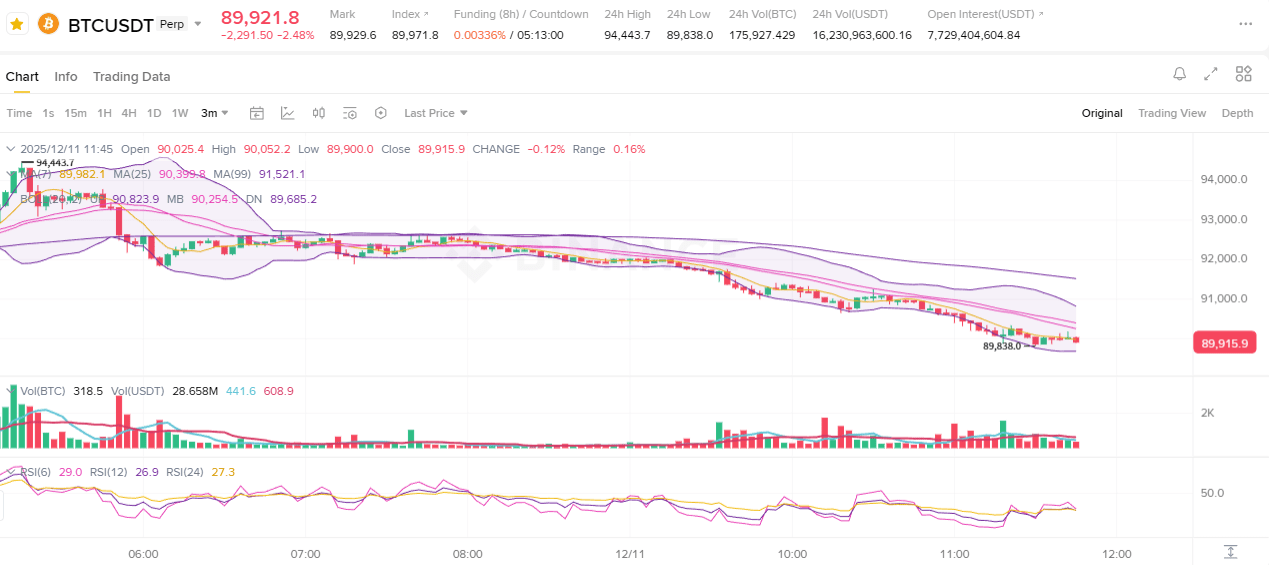
Moving Average (MA7·MA25·MA99)
Price is below the three moving averages (MA7·MA25·MA99)
is positioned below.
Arranged in the order of MA7 < MA25 < MA99.
The gap between moving averages is widening, and the current chart is maintaining a reverse arrangement structure formed in a downward flow.
is being maintained.
Bollinger Bands
Price is at the lower Bollinger Band
The area where it moved along the lower band appears long.
Recent candles are moving near the lower band and have not recovered to the midpoint (MB).
The Bollinger Band width has widened compared to before, indicating an expanded volatility state.
Volume
Volume increase candles are repeatedly confirmed in the downward phase.
Compared to the sideways range, the downward trading volume is relatively large.
In recent minutes, trading volume has decreased somewhat.
RSI (6·12·24)
RSI6, RSI12, RSI24 are all moving below 30.
RSI is generally maintaining low values, indicating a continuous presence in the oversold area on the chart.
There is no significant gap between indicators, and all are moving at similar levels.
Price structure
Price is $90,000, following a pattern of lower lows and lower highs after breaking the support area.
A downward trend line is maintained across the entire chart.
Key area that can be confirmed based on recent candles: Previous low: about 89,838 dollars
Nearby resistance: Range between MA7 and MA25
🔍 Key Summary Confirmed on the Chart
The arrangement of moving averages indicates a reverse arrangement state showing a continuous downward flow.
Price remains at the lower Bollinger Band without recovering to the midpoint.
RSI is moving below 30 across all periods, indicating a sustained oversold condition.
The overall price pattern maintains a downward structure of lower highs and lower lows.
Short-term trading volume appears relatively high during the downward phase.
🎁 Sign up for Binance
If you have not signed up for Binance yet? Sign up through the link below