


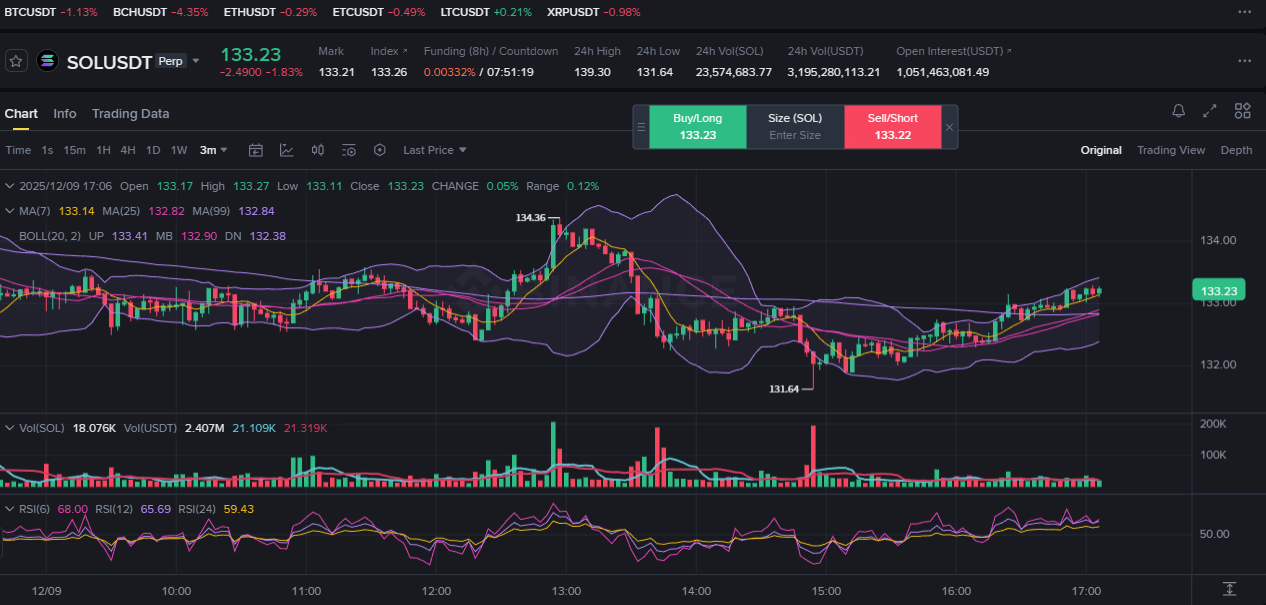
Solana (SOL) has recently made a clear breakout from a downward wedge pattern while continuing its short-term adjustment, signaling an upward transition.
This pattern is known to have a high likelihood of strong trend reversal, and the price testing the resistance line again right after the breakout is interpreted as a typical preparation phase for a rebound after a retest.
Market analysts evaluate that 'if buying pressure strengthens during the retest phase and a breakout occurs, the short-term trend will completely shift to an upward direction.'
Especially if this trend is maintained, there is a possibility of rising to the next major resistance level of 156 dollars from a medium-term perspective.
📈 Short-term Chart Analysis (based on 3-minute candles)
Currently, SOL is attempting to break above the upper range around 132.7 dollars.
All short-term moving averages are positioned below the price, forming a clear bullish arrangement, confirming the buying side's advantage. Trading volume is also showing an increase compared to the sideways range, which is positive as buying pressure continues steadily.
In addition, the width of the Bollinger Bands is widening again, entering an initial phase of volatility expansion, which is generally considered an early signal of trend change.
📊 RSI Analysis
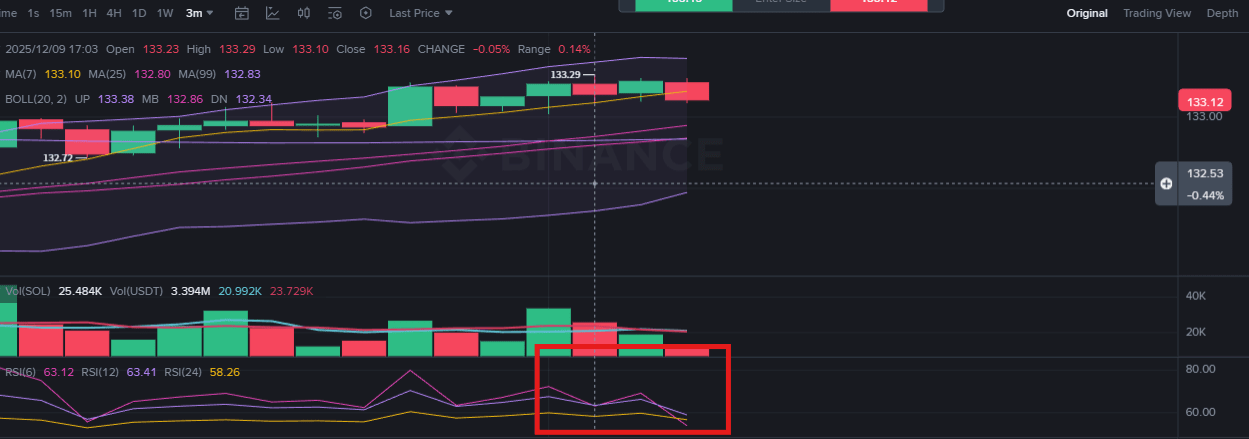
RSI is currently maintaining in the low 60s (around 60.6).
This range typically indicates a healthy rise without overheating, and when the RSI breaks 65-70, the short-term upward momentum is likely to strengthen further.
Conversely, if it falls below 55, it can be seen as a signal of weakening correction.
📘 Bollinger Band Analysis
Movement towards the upper band
Stable maintenance above the center value (MA20)
Band width expansion → trend strengthening signal
In particular, there are signs that a 'Band Walk' pattern, which moves along the upper band, is starting, making the buying side more prominent.
🏛 Short-term support and resistance range
Short-term support
132.45 dollars: key support for trend maintenance
132.07 dollars: previous bottom support line
Short-term resistance
133.20 dollars: first short-term resistance
134.00 dollars: strong sell wall
138 ~ 140 dollars: recovery of medium-term price range upon re-entry
If you haven't registered on Binance yet, try signing up for Binance.
You can also receive a 20% discount on trading fees.