
Few pay attention to one interesting indicator: the percentage of cryptocurrencies trading above their long-term moving averages.
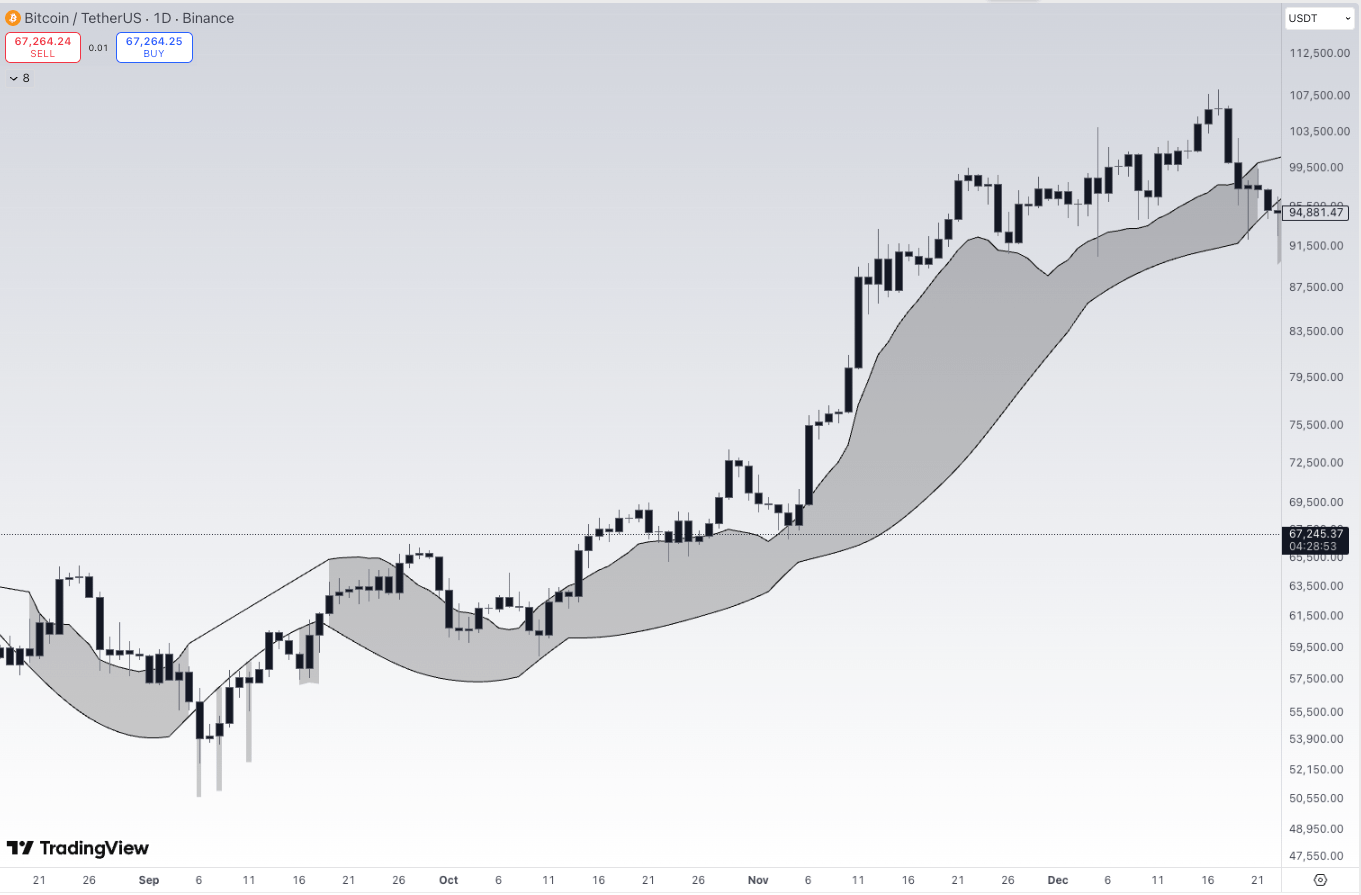
For example, you can take the top 200 cryptocurrencies by market capitalization and see what percentage of them is trading above their 50-day moving average. Then you can check what happens to the market — for example, with the crypto market index or Bitcoin price in a few days.
An interesting pattern:
when a very high percentage of coins is above the 50-day average, the short-term market return is usually below normal. This is logical — when almost all assets have already risen, the market becomes overbought and tends to correct more often.
But if you look at a longer horizon — for example, 30-50 days, the picture changes. After periods of strong growth, the market often shows higher returns in the following weeks.
This means that after a strong trend, growth often continues, but through corrections.
Why is this hidden advantage?
Because most traders lock in losses or exit a position during the first correction, not waiting for the trend to continue.
To take advantage of such an advantage, one must think like both a trader and an investor. Such a combination is rare.

The volatility of the breadth of the crypto market
Another indicator can be explored: the breadth of the crypto market.
To do this, you can take, for example, the percentage of coins trading above their moving averages — 5, 10, 20, 50, or 100 days.
But it's even more interesting to look at the volatility of these indicators — how quickly the breadth of the market changes.
High volatility usually occurs in two cases:
when the market sharply recovers after a period of weakness
when strong growth starts to weaken
Historical data shows that when the volatility of the breadth of the crypto market is at an extremely high level, the average market return after a few weeks is above normal.
When the market breadth indicators hardly change, the market return is usually lower.
This is yet another example of how hidden patterns appear in data, not on regular charts.
Most traders look at:
graphic patterns
news
short-term movements
But significant advantages can arise for those who analyze market data more deeply.
Technical indicators as a data source
Many traders use technical indicators only as pictures on the chart.
But indicators can be used differently as a dataset that can be analyzed statistically.
For example:
how many cryptocurrencies close above the upper Bollinger band
how many assets show growth in volume or cash flow
how many coins trade above key moving averages
When too many cryptocurrencies simultaneously demonstrate strong signals, future market returns often decrease.
When there are few such signals, the market often shows stronger growth in the following weeks.
The most convincing results appear when several independent indicators show the same patterns.
Not strength, but absence of weakness
Another interesting signal is the number of cryptocurrencies setting new lows.
If you look at the top coins and count how many of them are making new monthly lows, you might notice a pattern.
When very few coins set new lows, the market often shows good returns in the following weeks. This means there is no strong weakness in the system.
But another interesting thing is:
when a large number of coins simultaneously set new lows, the market also often forms future growth opportunities.
In other words:
extreme strength
and extreme weakness
both can create good conditions for future returns.
These advantages remain hidden because most traders only look at the nearest hours or days, not several weeks ahead.

Rotation within the crypto market
There is also capital rotation in the crypto market.
Money constantly moves between different segments:
Bitcoin
Ethereum
altcoins
meme coins
infrastructure tokens
DeFi projects
For example, you can measure the percentage of DeFi tokens trading above their 20-day averages and compare it to the overall market.
When a specific sector of the crypto market starts showing too strong a breadth, it often indicates capital redistribution rather than overall market growth.
Capital flow analysis between segments can predict in advance:
future slowdowns of the market
or the emergence of new growth zones.

Opportunities are where most do not look
Most crypto traders look for signals in:
graphic figures
news
short-term price movements.
But real advantages often lie in the relative relationships between assets.
the strength ratio of Bitcoin and Ethereum
the behavior of large coins relative to small ones
the differences between sectors of the crypto market
When one market segment becomes too expensive relative to another, an opportunity for mean reversion arises.
This shows an important idea:
When you have more ways to find opportunities, an opportunity-oriented mindset is formed.
#JobsDataShock #AltcoinSeasonTalkTwoYearLow #SolvProtocolHacked