
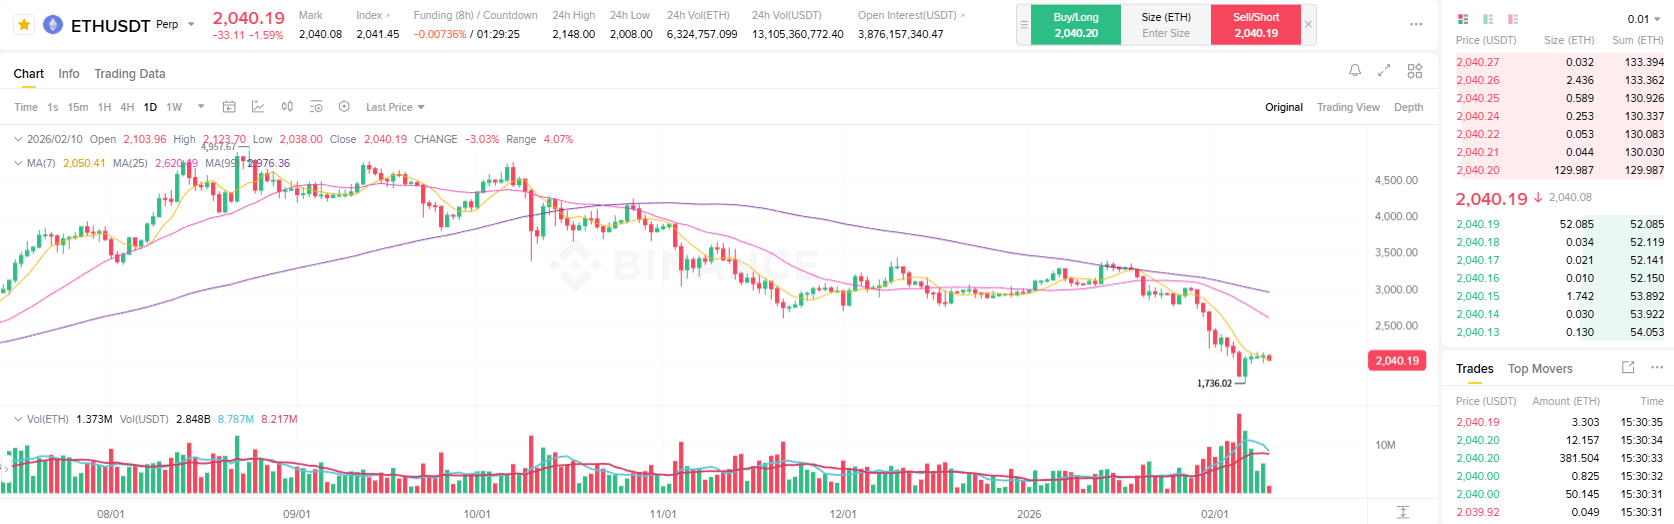
This chart is ETHUSDT Perpetual Futures on the daily timeframe (1D).
Overall, Ethereum is currently in a medium-term downtrend, with a recent strong drop and a short-term price bounce reaction.
This is a stage where many beginners often feel unsure of what to do.
The overall trend of ETH price
In recent months, the price of ETH has continuously created:
The peak after is lower than the previous peak (Lower High)
The low after is lower than the previous low (Lower Low)
This is a typical characteristic of a downtrend.
Simply put, prices are getting weaker day by day compared to before.
Although there are small bounces, the price has not been able to break through important resistance areas.
Moving Averages analysis
On the chart, there are lines:
MA(7) – short-term trend
MA(25) – medium-term trend
MA(99) – long-term trend
Currently:
Price is below MA(99) → long-term trend still weak
MA(7) and MA(25) are both below MA(99) → bearish alignment structure
In this case, buying based on emotions is very likely to lead to purchases at unfavorable price levels.
Recent price movements
ETH just had a strong drop and hit the area of 1,736 USDT, followed by a bounce candle with a long lower wick.
This indicates there is buying pressure trying to catch the bottom, but it's not strong enough to confirm a trend reversal.
Many people see the price bounce and immediately think it's the bottom, but in reality, it's not that simple.
Currently, the price around 2,040 USDT is considered a technical bounce area.
Volume analysis
In the strong drop phase, trading volume increases significantly, indicating:
There is panic selling
Liquidation of positions may occur
When the market drops sharply with high volume, investor sentiment is often very panicked.
After that, although the price bounced up, buying volume has not maintained stability.
Important support and resistance areas
Main support
1,730 ~ 1,800 USDT
Short-term resistance
2,200 ~ 2,300 USDT
Medium-term resistance
2,800 ~ 3,000 USDT
Beginners should remember these areas instead of just looking at the current price.

What beginners should understand from this chart
For beginners, the most important thing is:
The main trend is still down
The current upward movement is just a technical bounce
No clear signs of a long-term upward trend yet
The market does not always provide clear opportunities to enter trades.
Simple summary
ETH is in a medium-term downtrend
There is a short-term price bounce after the strong drop
The moving average still gives a weak signal
Selling pressure is still present
For beginners, understanding the trend is more important than trying to find entry points.
This chart is suitable for learning how to observe the market, not to rush into trading.