



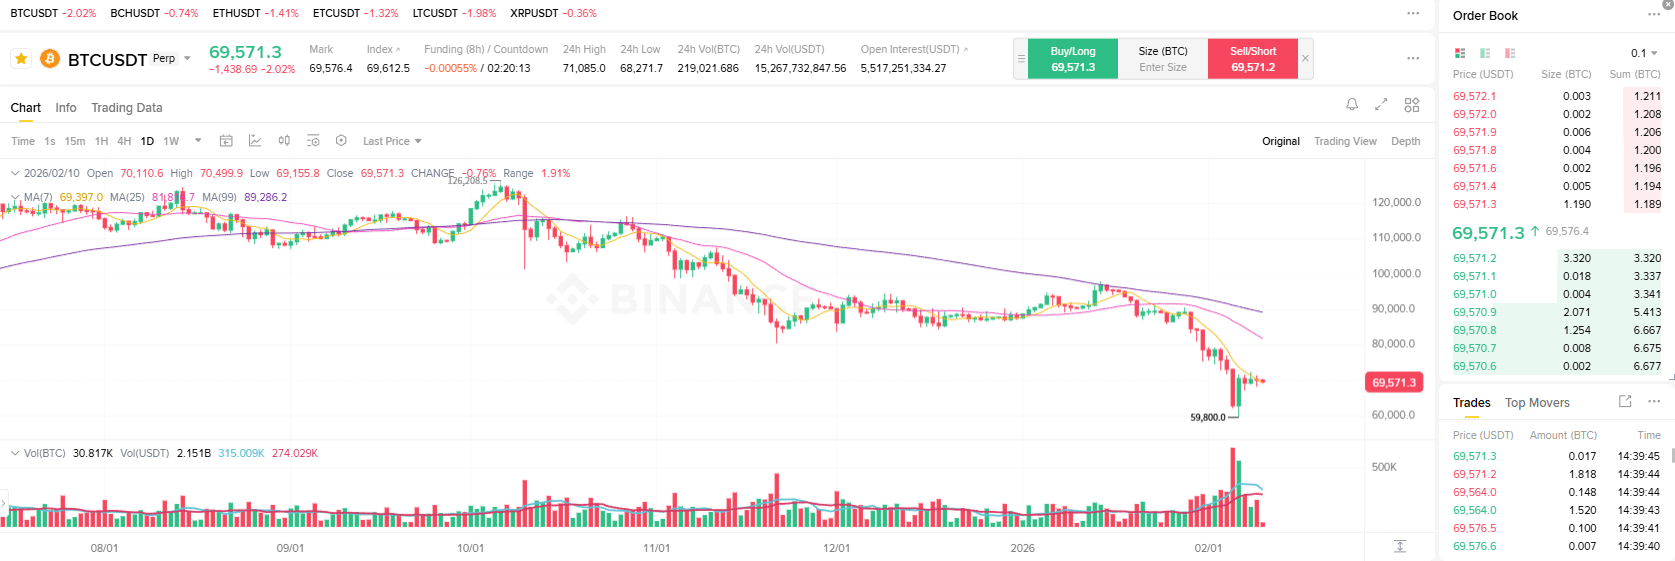
The current chart is based on BTCUSDT Perpetual Futures on the daily timeframe (1D).
It can be seen that the overall market structure is in a clear downtrend, even with a temporary rebound after a significant drop in price.
Analysis of Moving Averages
The chart shows MA(7), MA(25), and MA(99).
MA(99): Represents the long-term trend. The price continues to be below MA(99), indicating that the long-term bearish trend remains.
MA(25): Serves as mid-term resistance. In previous rebounds, the price failed to stay above this moving average.
MA(7): Responds quickly to short-term movement, but has not yet surpassed MA(25) and MA(99).
The arrangement of moving averages is in bearish alignment (long > mid > short), indicating that selling pressure is stronger than buying pressure.
Price Structure and Trend
A clear Lower High and Lower Low structure can be seen, which is a common characteristic of downtrends.
The last rebound did not create a higher high compared to the previous peak, and was immediately followed by another decline.
In the latest decline, there was a strong reaction around 59,800 USDT, where a long wick can be seen. However, this is more of a technical rebound than a true trend reversal.
Volume Analysis
A significant increase in volume is noticeable during the price decline.
This indicates that the decline was accompanied by panic selling or forced liquidation, not just a simple correction.
Although there is still volume in the rebound, there is not yet enough evidence of continuous buying pressure that would prove a trend change.
Support and Resistance Levels
Key Support
59,800 ~ 60,000 USDT
This is the most important short-term support zone based on the last low.
Short-term Resistance
Around 70,000 USDT
A psychological level and former support that is now resistance.
Mid-term Resistance
80,000 ~ 90,000 USDT area (near MA(99))
It is important to break this to confirm the trend reversal.
Overall Analysis
Currently, the BTCUSDT chart shows the following:
✔ Continued long-term downtrend
✔ Panandaliang rebound matapos ang matinding pagbaba
✔ Bearish moving average alignment
✔ High volume during price decline
A short-term rebound may continue, but to say there is a true trend change, the price needs to hold above MA(25) and create a higher high.
As long as this does not happen, the possibility of a retest or another decline after the rebound still prevails.