


BTC Chart Analysis: Bitcoin below $69K — a decline or preparation for a jump?
Today, the Bitcoin (BTC) market demonstrates high volatility, which forces investors to remain extremely cautious.
Below is a detailed technical analysis based on current chart data.
Current situation and candlestick analysis
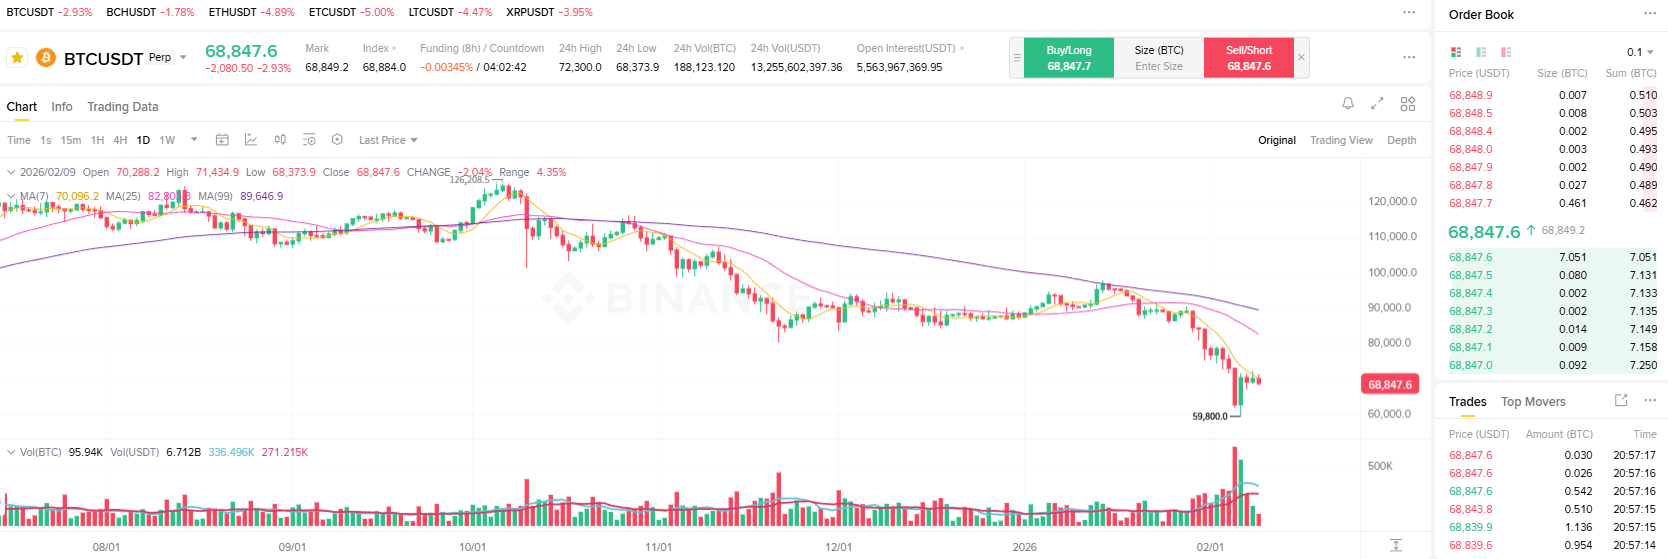
At the moment, Bitcoin is trading around 68,847.6 USDT, having recorded a decline of approximately 2.93% over the last day.
Candlestick patterns: After encountering strong resistance around $120,000, a sustained downward trend is observed. The chart clearly shows the formation of a descending channel with consistently lower highs.
Attempt to rebound after the crash: On the right side of the chart, a long 'shadow' can be seen from below, reaching the mark of 59,800.0 USDT. This indicates that strong deferred demand occurred at this level, and buyers quickly bought the dip.
Moving averages (MA) and trend indicators
The position of moving averages indicates clear short-term pressure from sellers.
MA(7) and MA(25): Short-term moving averages crossed mid-term ones from top to bottom, forming a bearish configuration. The price is below all key MA lines, turning them into resistance levels during attempts to rise.
Psychological barrier: The inability of the price to stay above $70,000 and the subsequent sideways movement indicate a temporary weakening of purchasing power.
Trading volume analysis (Volume)
Particular attention should be paid to volume indicators at the bottom of the chart.
In the recent drop zone, large 'bearish' volume bars have been recorded. This confirms the strength of selling pressure.
However, the spike in volume at local lows also indicates a strong clash between 'panic selling' and 'buy orders' at the bottom.
Key levels and action strategy
Support levels: The zone of 59,800 – 60,000 USDT (previous local minimum) is critically important. Breaking this line could provoke a deeper correction.
Resistance levels: The primary task for the 'bulls' is to return to the mark of 70,000 USDT. After that, the market needs to absorb volumes in the accumulation zone of 80,000 – 90,000 USDT to confirm the trend reversal.
Summary: Bitcoin is in a phase of short-term downward trend in a high volatility zone. In the current conditions, entering with high leverage is extremely risky.
A reasonable strategy seems to wait for confirmation of the stability of support levels and consider buying in parts (averaging).