



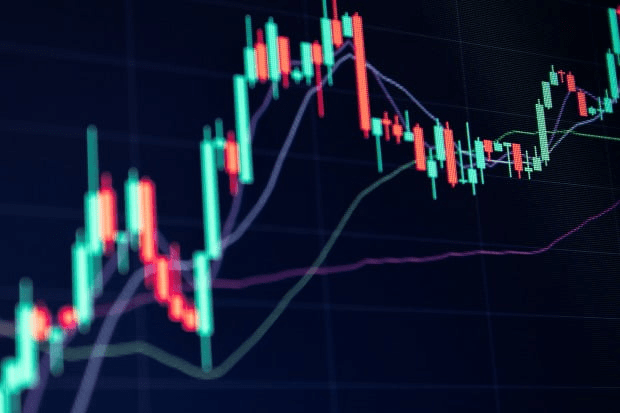
The current image shows the Binance trading screen without configured charts.
In fact, even in this form, it is not bad.
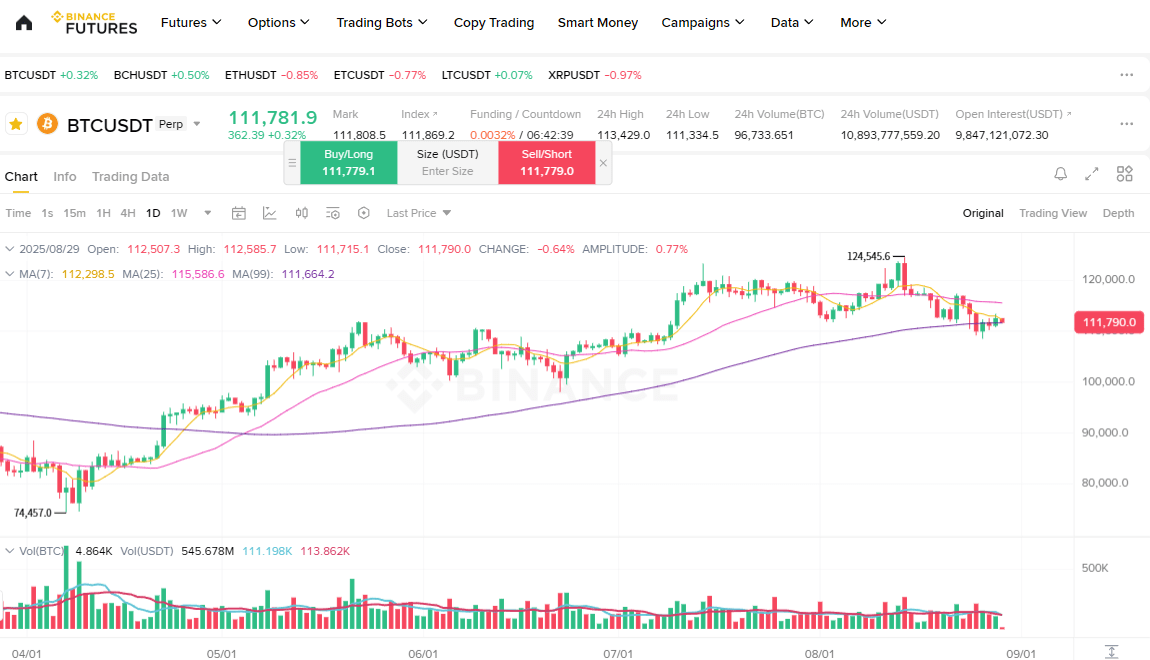
After all, the candles, trading volume, and moving averages are already set.
However, there are users who want to add additional indicators to create new strategies.
Therefore, while some try to set it up themselves, it turns out not to be so simple.
Today I will tell you how to easily set up charts on Binance.
Binance chart settings
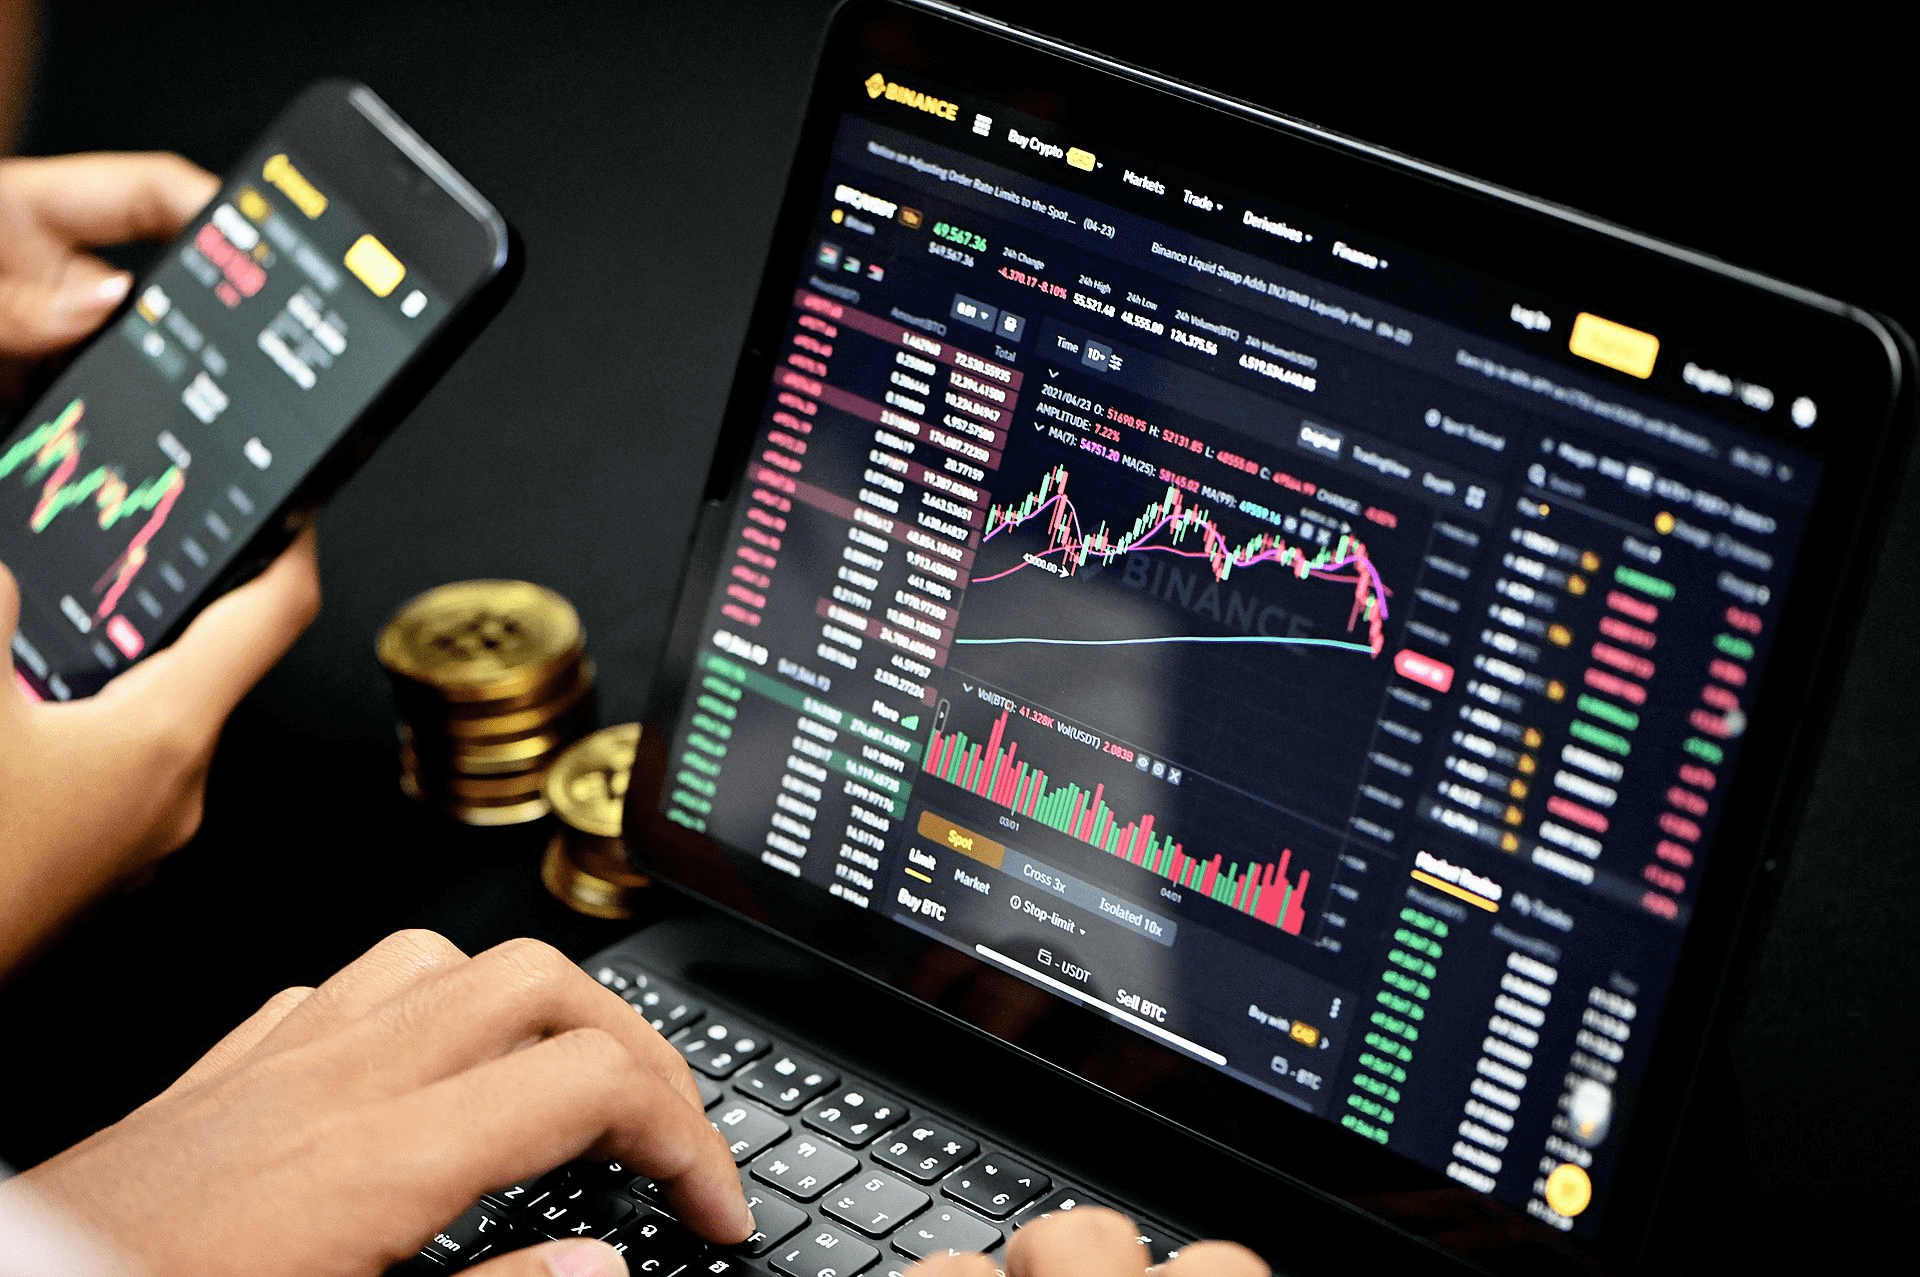
First, log in to Binance from a computer.
The reason is that on the mobile version, the ability to add indicators is limited.
So, even if it seems inconvenient, for more precise trading, it's better to use a PC.
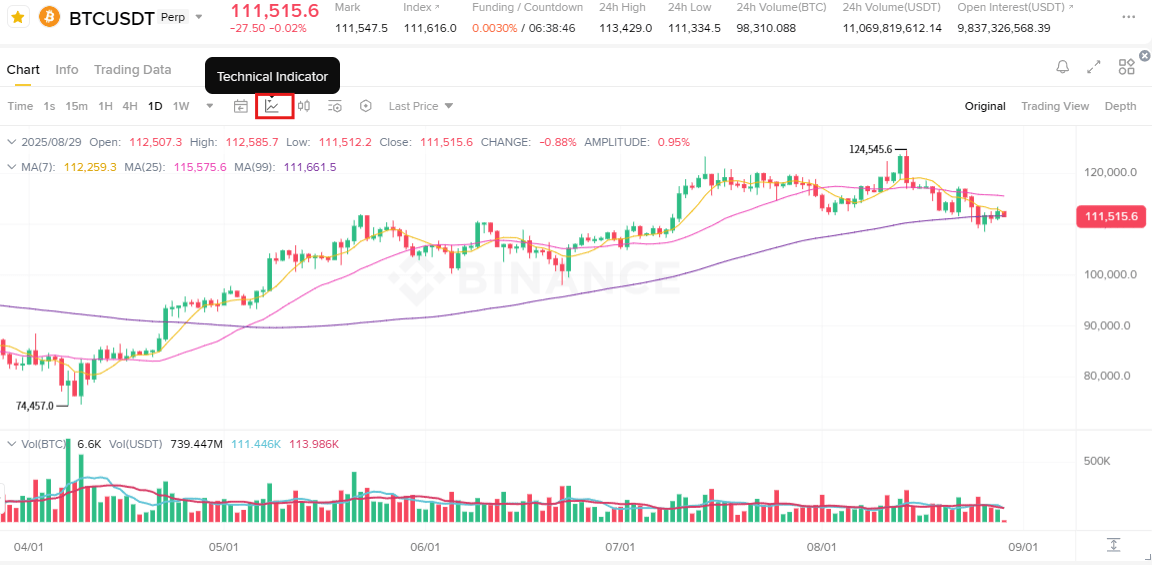
Next, go to the futures trading screen and select Indicator.
Then add the necessary indicators.
But for beginners, it is difficult to decide which indicators to use.
Therefore, in this post, I will show two of the simplest indicators that are easy to apply.
If you haven't registered on Binance yet, we recommend doing so through the link below. Registration through the link gives a 20% discount on fees.
🚩 Get a 20% discount on Binance fees
Even existing users can get a 20% discount if they meet the following 5 conditions.
The invited person already has a registered Binance account.
The invited person has never accepted an invitation before.
The invited person's account has not traded or used Binance products for the last 180 days.
When the invited user opens the link and logs in, a confirmation window appears.
When the inviter clicks [Bind Now], the binding takes effect.
Bollinger Bands
The first indicator is Bollinger Bands.
It was created by financial analyst John Bollinger.
The yellow lines above and below the candles show the range in which the price is located with a 95% probability.
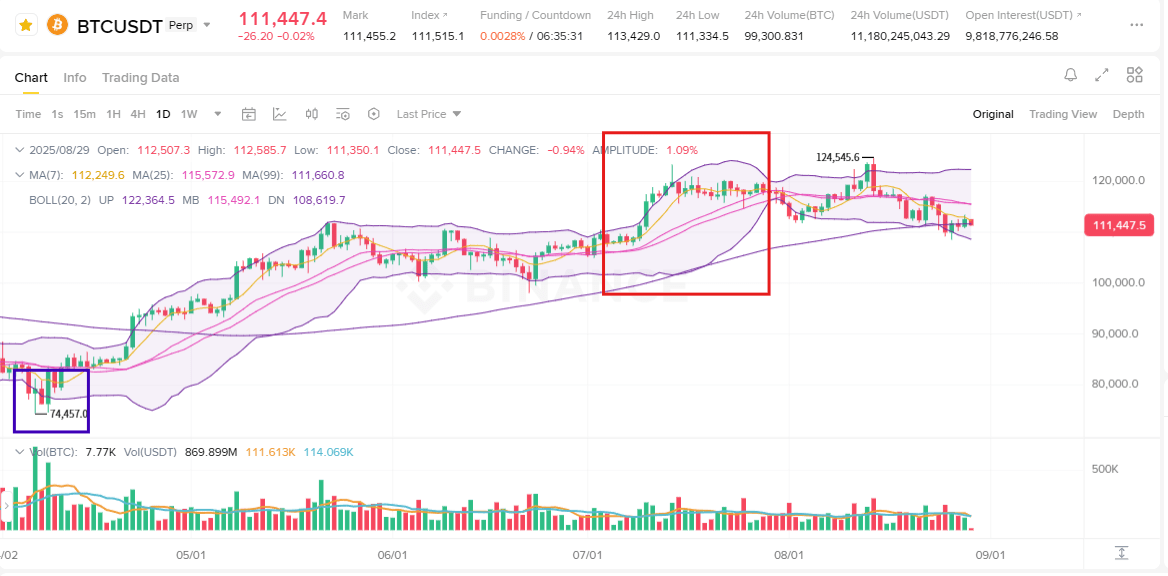
The formula exists, but we will skip the math and move on to practice.
When the range sharply expands and the price rises — it’s worth buying.
When the candles break the upper boundary — it’s worth selling.
But this indicator does not guarantee 100% accuracy, so caution is needed.
RSI
The second indicator is RSI (Relative Strength Index).
He compares the strength of price movement up and down.
RSI is simpler than Bollinger Bands, so I recommend it for beginners.
On the weekly chart, RSI ≤ 40 indicates undervaluation, RSI ≥ 60 indicates overvaluation.
On the hourly chart, RSI ≈ 25 often indicates a local bottom.
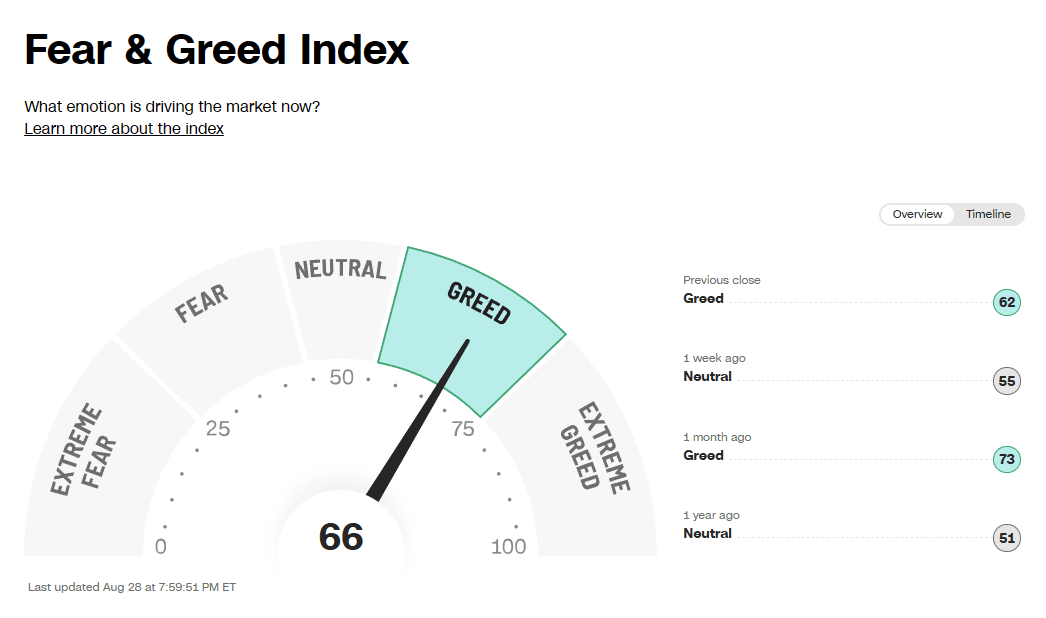
The Fear and Greed Index can also be used. Fear ≤ 30 → buy, Greed ≥ 85 → sell in parts.
Today we looked at the Binance chart settings and two indicators — Bollinger Bands and RSI.
If you haven't received a 20% discount on fees yet, be sure to use the link in this post.