
Written by: MUSTAFA, CARL
Compiled by: TechFlow
TLDR
6MV has developed proxy models to help research tokens and advise portfolio companies on token generation, launch, and mechanism design. We model “infrastructure” economies that use utility tokens to reward service providers and are paid for by users. These economies include Filecoin, Chainlink, Graph, and Helium.
In this post, we introduce our approach and share four early findings:
Our research shows that while the strongest drivers of token price performance are macro changes, token design decisions can help mitigate downward pressure on token prices during bear markets.
All other factors being equal, incentivizing the supply side is more effective than incentivizing the demand side. Adding service providers to the network can increase stability and the overall token price.
In our model, adjusting the token issuance rate (e.g., deflation) does not materially affect the performance of the protocol. Instead, we recommend that protocols prioritize value drivers rather than using deflation to drive token prices.
For networks with staking, increasing staking rewards can increase retail investors and overall token market capitalization, but it will also increase volatility.
When markets are good, the prices of many tokens are subject to highly speculative behavior, making it difficult to see if the economic design of a token is working. But when markets are bad, it becomes increasingly important to find deep, evidence-based insights that can help protocols stabilize prices and increase utility.
Since the full framework of the token economy has not yet been determined, our research team is building agent-based token economy simulations to help us better understand and respond to the token economy under different market conditions.
introduce
The challenge of understanding token economics is to understand mechanism design. In economics, game theory studies the strategies and incentives that exist in games. In mechanism design, the opposite problem is studied, that is, how a set of desired incentives and strategies affect the design of the game itself. Through this mathematical framework, we can think of the design of token economics as the design of a game, where the token is the most important tool to incentivize behavior.
But unlike games, token economics is an open system that is easily affected by external factors, making it difficult to predict behaviors and outcomes in token economic systems. Therefore, we need to use computational methods to better understand these complex relationships.
Our approach is to use an agent-based model (ABM), where we model individual agents with different characteristics. These agents are rational and react dynamically to market conditions in order to better understand how token economic systems operate.
Agent-Based Models vs. Other Approaches
Machine Learning (ML) is the current standard industry approach to predictive models. In simple terms, it is a class of related models based on multiple data inputs. When using machine learning models to predict token economics, we can predict token prices based on any real-world indicators such as historical user adoption, token prices, token supply, Bitcoin prices, etc.
By aggregating these input data, the model uses weighted regression to predict the price of a token over time. These models are often used for applications with shorter time horizons, such as social media and short-term trading decisions. On time scales of seconds and milliseconds, user preferences or market trends are highly correlated with previous trends. However, on longer time scales, the inherent biases in the input data can make predictions relatively unreliable. The randomness of macroeconomic trends, external shocks, and other trends are often difficult or impossible to quantify, creating gaps in machine learning's predictive capabilities.
Using agent-based models (ABM), we can account for random chance and allow agents to act independently, unaffected by input data. This allows us to collect and analyze the results of hundreds of simulations and draw insights from them. Most importantly, the ABM approach allows us to understand why the results occurred. With detailed output logs, we can delve into the cause-and-effect relationship between agent behavior and market trends. In contrast, machine learning models can only output predicted results, but cannot provide the information behind the results.
In summary, ABM provides the ability to assign different behaviors to different actors, enables longer-term predictions, does not require the collection, storage, and labeling of millions of data points, and can infer causal relationships by analyzing output logs.
Model design
Overview
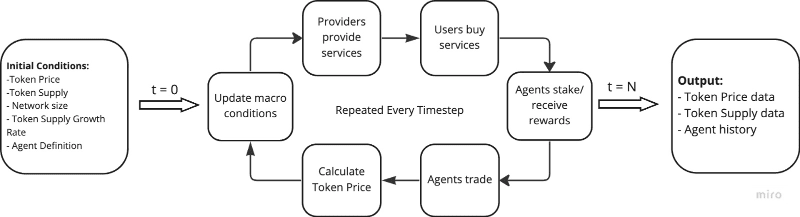
Our ABM model is designed for “infrastructure economies” where providers provide services to users, such as Helium, Filecoin, and Chainlink. This easily translates into classes of agents with different incentives. Users pay for services, while providers receive rewards to cover costs and maximize profits. All agents speculate on market trends to maximize profits. We also include two investor agents - institutional investors and retail investors, who do not participate directly in the network but will buy/hold/stake/sell tokens to maximize profits.
To start our simulation, we input a set of “initial conditions” including token price, token supply, network size, etc. The simulation then enters a loop phase where a series of events occur and agents make transactions. Each cycle represents a day, and the cycle repeats until the specified total number of days is completed. The model then outputs data about each day of the simulation, including agent behavior, token price and supply changes, and market conditions.
user
In the simulation, we set the parameters of users as probability distributions, including capital amount and risk tolerance. This can be understood as their characteristics in the market, with some agents preferring high-return, high-risk behavior, while others prefer conservative actions. In each time step, users pay for the service, evaluate the market, and decide whether to buy or sell their tokens depending on the situation. Many factors influence their decisions, including the current token price, their own risk tolerance, the recent trend of the token, and their own past actions.
supplier
Suppliers also act like agents, entering the simulation with risk tolerance and capital, as well as a percentage of total network computing power, i.e. the amount of "service" provided. Their incentives differ from users, as they are more likely to sell tokens at any time step in order to cover operational costs. Suppliers evaluate the same market trends and macro trends as users, and are influenced by similar inputs.
investor
There are two types of investor agents: retail investors and institutional investors. Retail investors do not participate in the protocol as intended, but instead speculate on tokens to maximize profits. They use similar indicators when deciding on trading strategies, including macro trends, token prices, their own past behavior, and their profits and losses. Institutional investors may have token lock-up periods and different investment goals than retail investors. Their decisions are influenced by a variety of factors, including the price at which they purchase tokens, how much they prefer to sell, the lock-up period, and the required rate of return.
Network Growth
Agents continuously enter and exit the economic system based on changing probability distributions and token price trends. We assume that continued price growth drives more suppliers and users into the market, and vice versa. The exact parameters of the network growth of the protocols we simulate vary from protocol to protocol, and we use real-world data to tailor our model.
模型校准
We built the model by calibrating it on backtests over the past 90 days. This process is an iterative one where we set initial conditions for the model, run simulations, and then compare to actual results. Our goal was to build a model that minimizes overfitting and is able to describe a variety of real-world infrastructure protocols. We backtested three large infrastructure economies: Helium (HNT), Filecoin (FIL), and Chainlink (LINK).
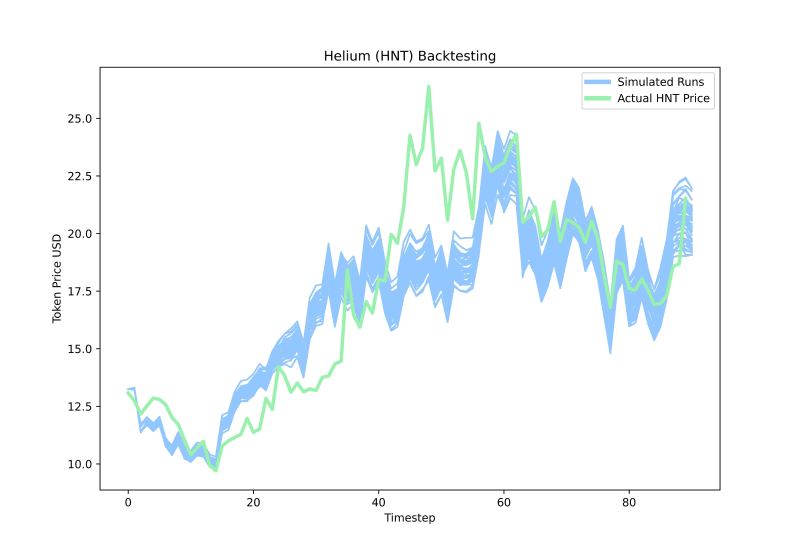
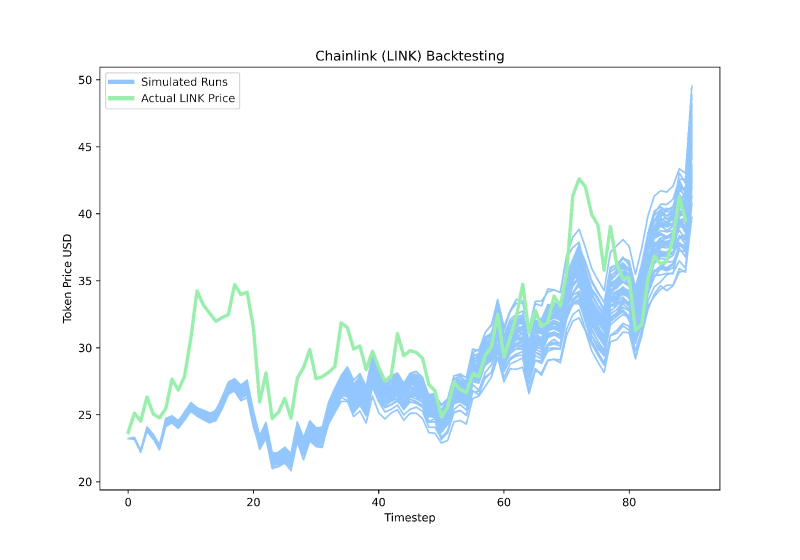
We use two metrics to measure model performance: token price correlation and relative price movement pattern matching. Our model shows a wide range of accuracy on these metrics, which gives us confidence in the defined mathematical relationships. This confirms that the model is able to simulate real token price fluctuations in response to macro market conditions and network adoption.
Case Studies
Our initial model includes several configurable parameters, including market trends, token issuance rate, network growth, and staking rewards. A natural starting point is to experiment with these parameters.
The power of ABM lies in the ability to model complex parameter relationships. For this initial work, we decided to isolate each parameter to understand its impact on the entire economy. This yielded some insights into different token economics design choices.
Control Case is an inflationary economy with an initial supply of 15M tokens and ~100K tokens minted per month in its early stages, equating to an 8% inflation rate per year. We believe this is a reasonable choice given the inflation rates of other infrastructure economies and popular tokens. We initialized 10,000 active users and 1,000 suppliers, a 10:1 ratio, based on Filecoin’s ~35,000 active users and 4,000 suppliers. We also initialized 1,000-2,000 investors per run. We use ETH as our proxy for crypto market sentiment, as both ETH and BTC track macro movements well.
We run each experiment 25 times, with each simulation lasting 90 days. The shorter time period was chosen to capture a finer picture of the simulated economy and to focus on the immediate results of the experiment. For each experiment, we vary a key parameter and study the results.
Case Study 1: Impact of the Cryptocurrency Market
Cryptocurrency has been largely correlated with macroeconomic trends over the past year. Using the ABM model, we can dig deeper and begin to understand the extent and intensity of this influence in various market scenarios.
We only change the "Cryptocurrency market trend" parameter:
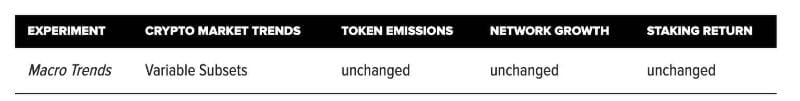
In other case studies, we used the same set of real ETH token price data for each run. In this case study, we varied these subsets and selected three different 90-day historical periods of ETH prices: downtrend, stable growth, and high growth. We found that the impact of macro trends is highly correlated with the token price movements we simulated.
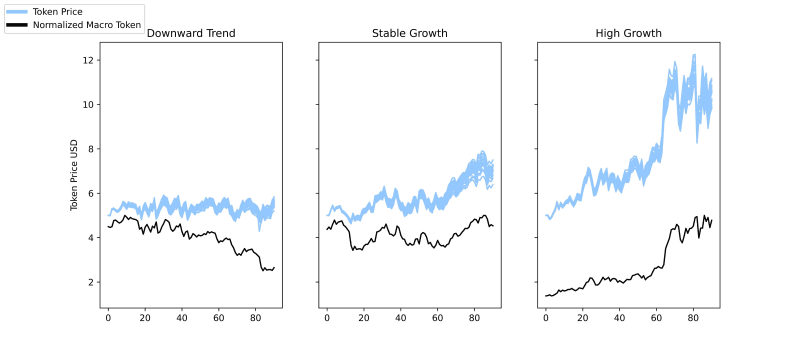
Even in extreme cases, such as strong deflation or extremely high staking returns, where each batch runs with the exact same initial conditions and parameters other than macro trends, we still see a high correlation between L1 token movement and our token price. When reviewing other case studies, the impact of market movement is clear even in extreme cases. We clearly observe that the agent is strongly influenced by the overall market sentiment and trades accordingly.
This effect might lead one to believe that token design has little impact on actual outcomes. But we believe the picture is more complex. While the impact of market trends cannot be completely eliminated, poor token design can accelerate bear market crashes, while smart token design can increase stability and token price performance, even in volatile markets. The benefits of good token design make this discipline worth pursuing, giving protocol designers control over the network in a variety of macro environments.
Case Study 2: Token Distribution Plan
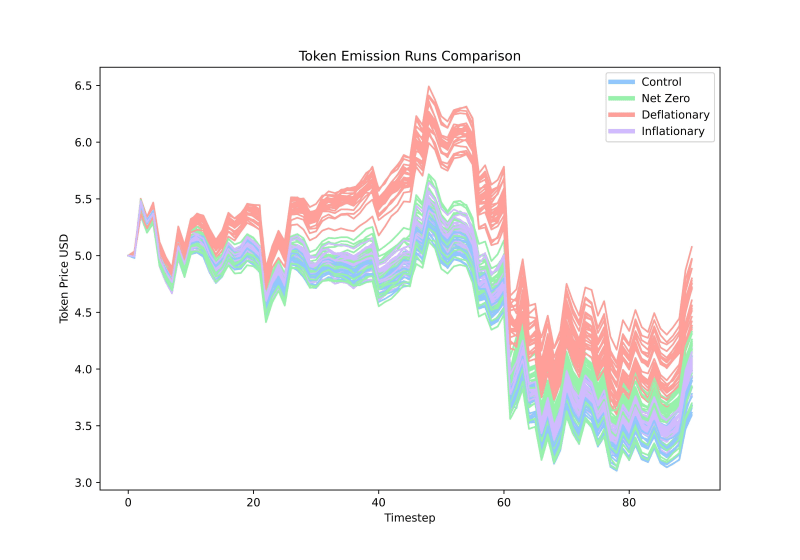
An important component of token design is the inflation rate. A common token design is to increase the issuance of tokens to a maximum, after which the token becomes deflationary or stable. Other protocols may use an algorithmic equilibrium, where the protocol uses some method to burn tokens as the minting rate of the token fluctuates. We categorize these into four types: high inflation, stable inflation (our control group), zero inflation, and deflation.
Through simulations, we found that the control group (about +8% inflation) has the highest stability. High inflation (about +37%) slightly reduces the price of our token without much loss of stability, while deflation (about -37%) causes a slight increase in the token price but poor stability.
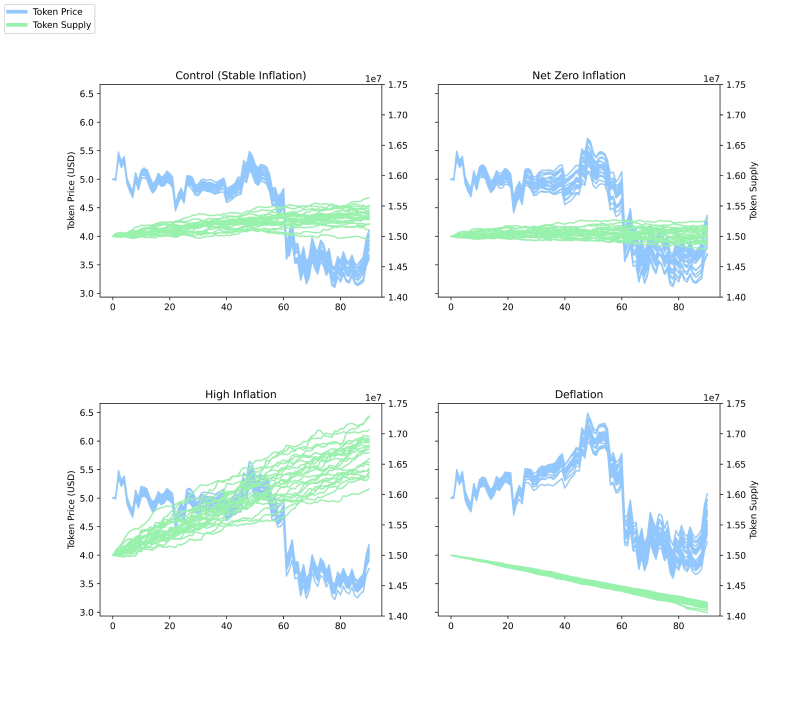
Surprisingly, these results contradict the intuition of scarcity in token economies. We deflated the token, making it more scarce, but we only saw a small increase in the price of the token and slightly reduced its stability. The token price did not change significantly between the zero-inflation and high-inflation runs, but we noticed some steady growth at high inflation rates. The likely reason is that short-term 90-day simulations fail to capture the long-term impact of inflation on token prices.
As Ethereum merged, it became a deflationary token, but its price did not continue to rise, but instead fell in response to strong external shocks to the crypto market, similar to the findings of our model. We note that some tokens adopt inflationary or deflationary strategies. In general, we do not encourage token designers to focus on issuance rate as a driver of token price growth, but instead encourage them to focus on the incentives associated with the token. What specific behaviors should the token incentivize? What specific behaviors will harm your economy? How does the token mitigate the impact of these behaviors? Without answering and implementing these basic details, the actual impact of token issuance on token price performance will be small.
Case Study 3: Impact of User and Supplier Adoption
In two-sided markets, an enduring question is: which side of the market should be incentivized? In the infrastructure economy we simulated, it is useful to understand which type of player growth is more beneficial to the economy - users or suppliers. We ran two simulations, introducing either suppliers or users by adjusting the "network growth" parameter.
We found that adding suppliers resulted in higher token growth and slightly lower stability, while adding users resulted in significantly less token growth but slightly higher stability.
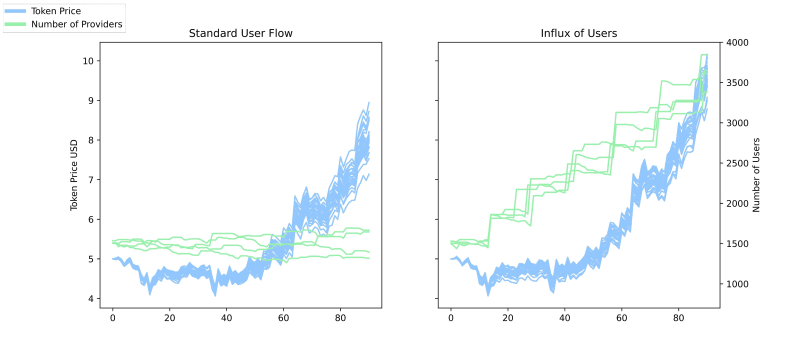
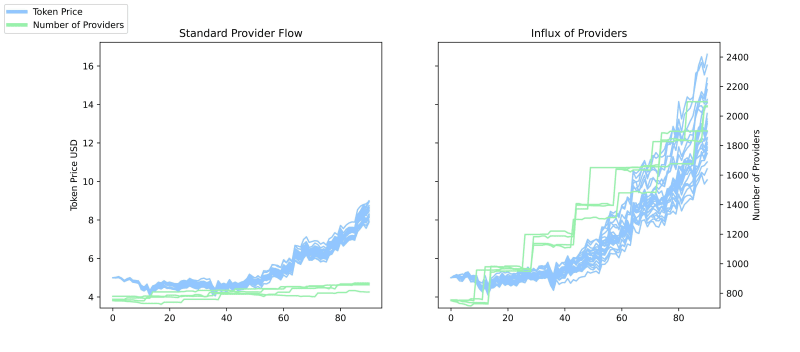
These trends can be explained by the dynamics between users and suppliers, where an increase in the number of suppliers leads to a more stable inflow of new users, causing the price of most tokens to rise. When simulating a large number of new users, the number of suppliers entering the economy is about 23% lower than when new users are introduced proportionally.
Obviously, there is still a balance to be struck between user growth and supplier growth in any protocol. Depending on the business, there may be a preference to prioritize user growth or supplier growth. Our results suggest that in infrastructure economics, the impact of introducing suppliers is greater than the impact of introducing users.
Token designers in the infrastructure economy should carefully consider how to incentivize users and suppliers. For example, supplier rewards should attract a sufficient number of suppliers to join the network while avoiding excess resources that cannot be utilized, resulting in supplier investment failure.
For example, a common problem with the Filecoin model in 2020 is the lack of liquidity and user traffic to support the financial needs of storage providers. By over-emphasizing provider inflows, the network is inefficiently utilized and token price performance suffers. Similarly, user growth should also be carefully incentivized to match the capacity of the network to avoid demand surges that exceed the network capacity of providers.
Case Study 4: Different Staking Rates
Staking allows token holders to lock their tokens for a period of time to earn additional rewards. In our model, token holders can stake at each time step. Our decisions are based on their expected returns and the opportunity cost of locking their tokens, as well as some other factors such as market trends and their own past behavior. To study the impact of different staking incentives, we vary the staking yield between 0%, 5%, 12%, and 20%.
As expected, for the model without staking rewards, no agents choose to stake. We find that increasing the staking rewards to 5% has little effect on both token price and stability. Increasing the staking rewards to 12% and 20% both increase token price, but higher instability is observed in the 20% run.
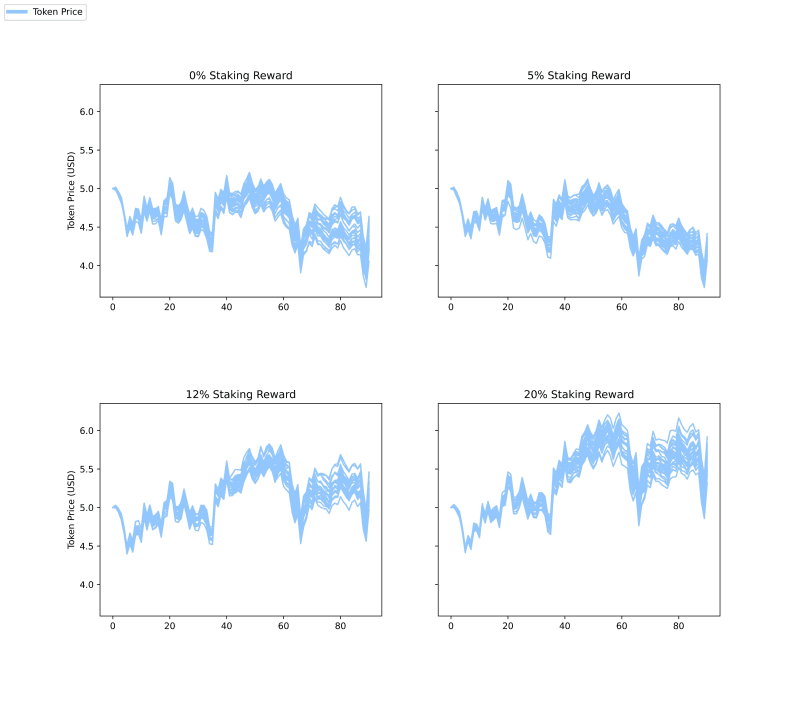
As the staking yield increases, the network grows faster and more wealth flows through the economy. The natural result is an increase in token prices. However, we also observe a rise in the number of retail investor agents as a result of speculative trading, leading to lower stability at a 20% staking yield.
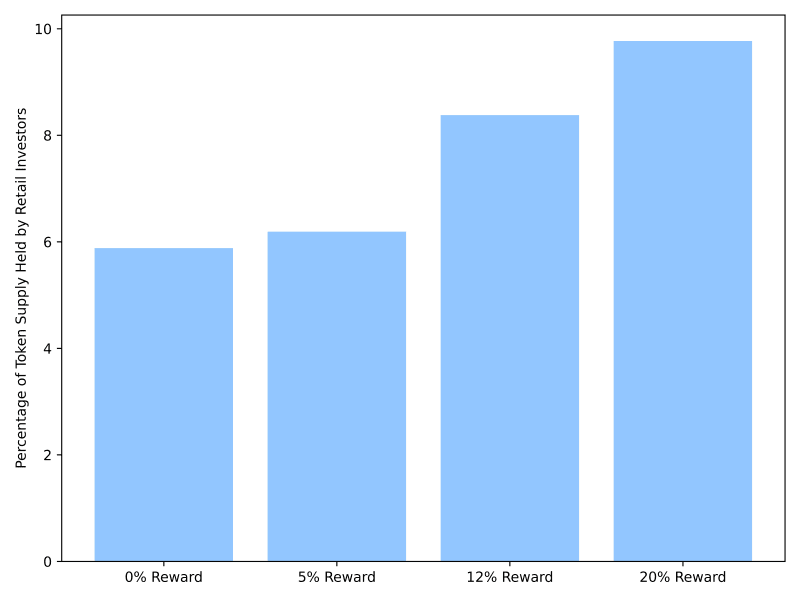
These results suggest that there is a "balance point" in staking rewards, where protocol designers must balance capital flows with an increase in the number of speculators. In our experimental economy, 12% is the closest result to this balance point, giving us significant token price growth with little loss in stability. When using our simulation as an advisory tool, we can scan more staking levels or simulate different reward schedules to get more precision in our analysis.
While 12% can provide network growth with little loss in stability, this does not mean that every protocol should use 12%. For example, a protocol early in its lifecycle may want to reduce the number of retail investors in order to focus on core network users and providers, and would be incentivized to retain tokens and keep staking low or closed. We recommend that protocols monitor the proportion of their economy engaged in speculative activities and consider staking adjustments to incentivize their desired mix of token holders.
More broadly, we encourage protocols to provide other utility features to stakers beyond financial APY. Examples include greater governance weight, contributions to network security, and other intangible rewards. Staking purely for financial motivations, especially for emerging protocols, can distort fundamentals and attract speculative liquidity that will leave once staking rewards are reduced.
Summary and Outlook
The dynamics of token economies are extremely complex. Using ABMs, we can get closer to understanding the complexity of token economies, starting with analyzing the interactions between individuals and how tokens influence their behavior.
We follow the well-known adage: “All models are wrong, but some are useful”. The most important step in creating a predictive model is to clearly understand its limitations and assumptions. Some shortcomings of this initial model may include a 90-day run time and calibration on only three tokens. As we experiment with the capabilities of this model, we will continue to refine these assumptions and work to add new types of agents, agent capabilities, and protocol designs.
Original link