

The default Binance chart is a basic trading interface without any custom indicators applied.
Although it looks simple, it is actually very practical because it defaults to include candlestick charts, volume, and moving averages.
However, many traders want to add custom indicators to develop new trading strategies.
Therefore, they will try to explore and modify the settings, but it is often not as simple as they think.
That’s why today I want to guide you step by step on how to set up your trading chart on Binance.
We will explain in detail in the guide below.
How to set up charts on Binance
First, please access Binance using a **computer (PC)**.
Why not use your phone? Because on the mobile version, the functionality of custom indicators is limited.
So if you want to make more precise trades, it is recommended to use the desktop version of the website.
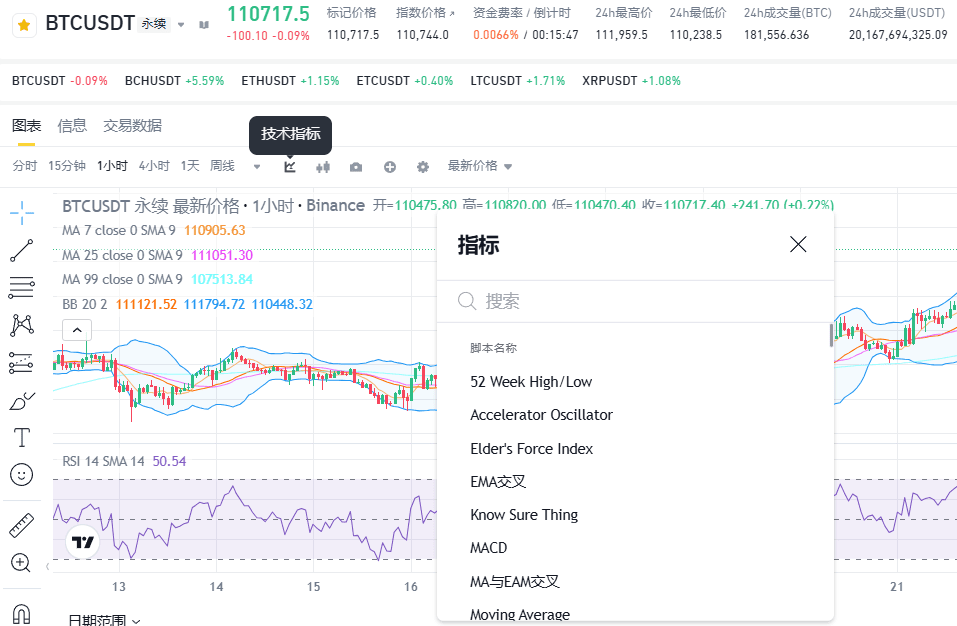
Next, enter the futures trading interface and click on 'Indicators' in the upper right corner.
Here you can add the technical indicators you want to use.
However, if you are a trading beginner, choosing the right indicators may leave you feeling lost.
So in this article, I will introduce two simple indicators that are suitable for beginners:
Bollinger Bands
RSI (Relative Strength Index)
Below, I will explain the usage of these two indicators separately.
Bollinger Bands
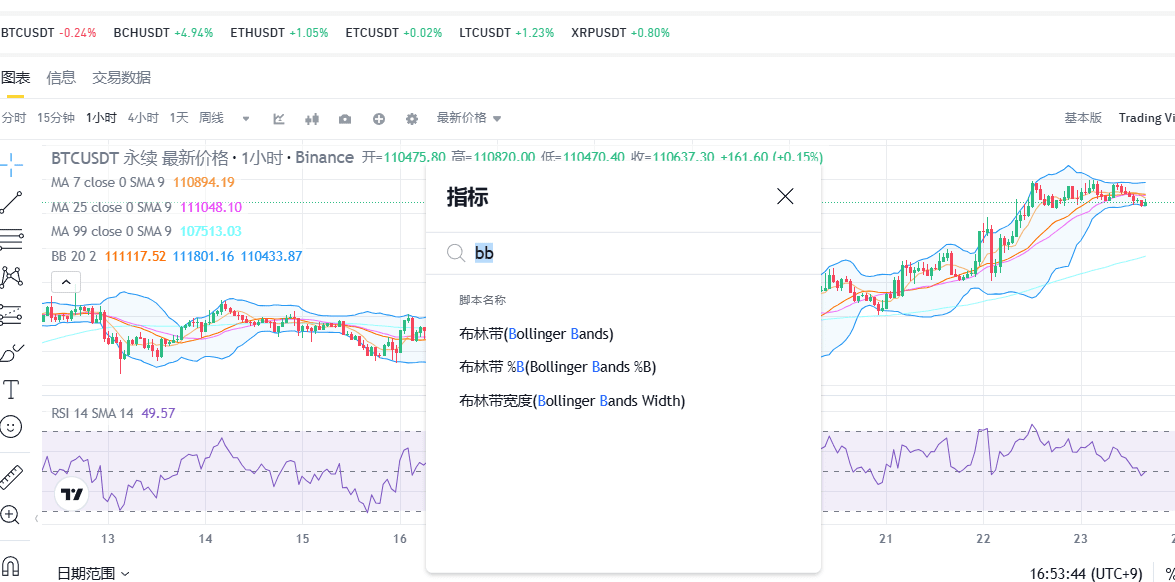
First, let's look at Bollinger Bands.
You may have heard of it; it was invented by financial analyst **John Bollinger**.
To add Bollinger Bands, simply search for 'Bollinger Bands' and then apply it to your Binance chart.
The key is how to interpret this chart:
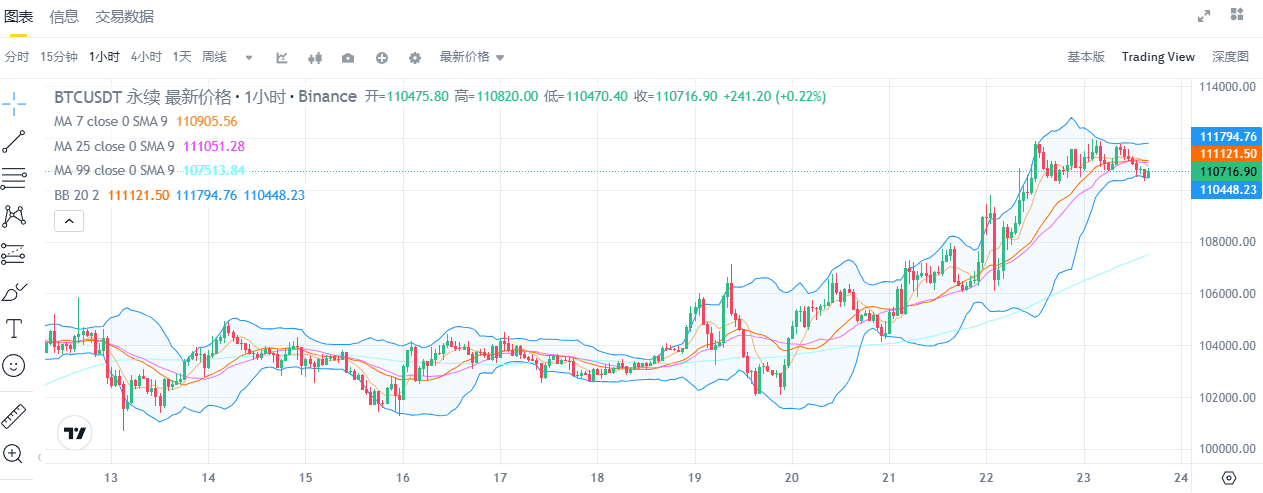
If the Bollinger Bands suddenly widen while the price starts to rise, this is usually a buy signal.
So when should you sell?
It's also quite simple—when the candlestick touches or breaks the upper band, this may be a sell signal.
But please note that this indicator is not 100% accurate.
If you are not precise with your entry and exit timing, you may face significant losses.
So do not blindly rely on it, but treat it as one of many reference tools.
RSI (Relative Strength Index)
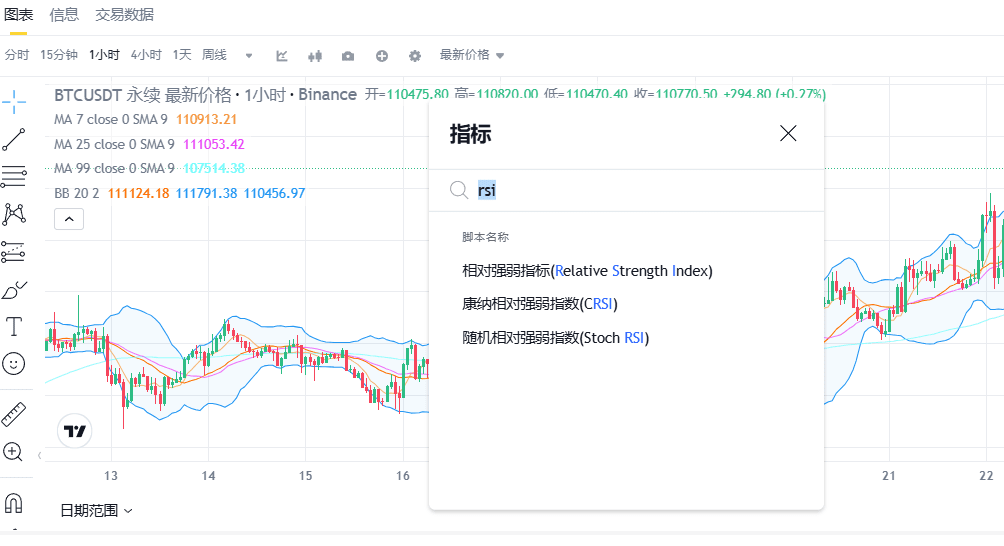
Next, let's look at the RSI, also known as the Relative Strength Index.
It is used to measure the strength of price increases and decreases.
This indicator is much simpler than Bollinger Bands, which is why I particularly recommend it for beginners.

Once set up, a line for the RSI indicator will appear at the bottom of your Binance chart.
If using the weekly chart as a reference, when the RSI is below 40, it indicates that the asset may be undervalued;
And when the RSI is above 60, it indicates that the asset may be overvalued.
In shorter time frames (like the 1-hour chart), an RSI close to 25 usually indicates a local low.
So I suggest readers use these two indicators as important reference tools for daily trading decisions.
Today we presented a simple and practical guide on how to set up charts on Binance.
I have always emphasized: do not be confused by too many indicators; the most important thing is to master the basics first.
If you haven't registered for a Binance account yet, you can click the link below to register immediately.
By registering through this link, you will receive a 20% discount on trading fees—this is an exclusive benefit for first-time registered users.
Don't miss out!
📍 Click here to register for Binance and enjoy a 20% fee discount