$LTC
March 18, 2025 LTC/USDT Market Analysis
The following content does not constitute investment advice and is for reference only.
1. Market Overview
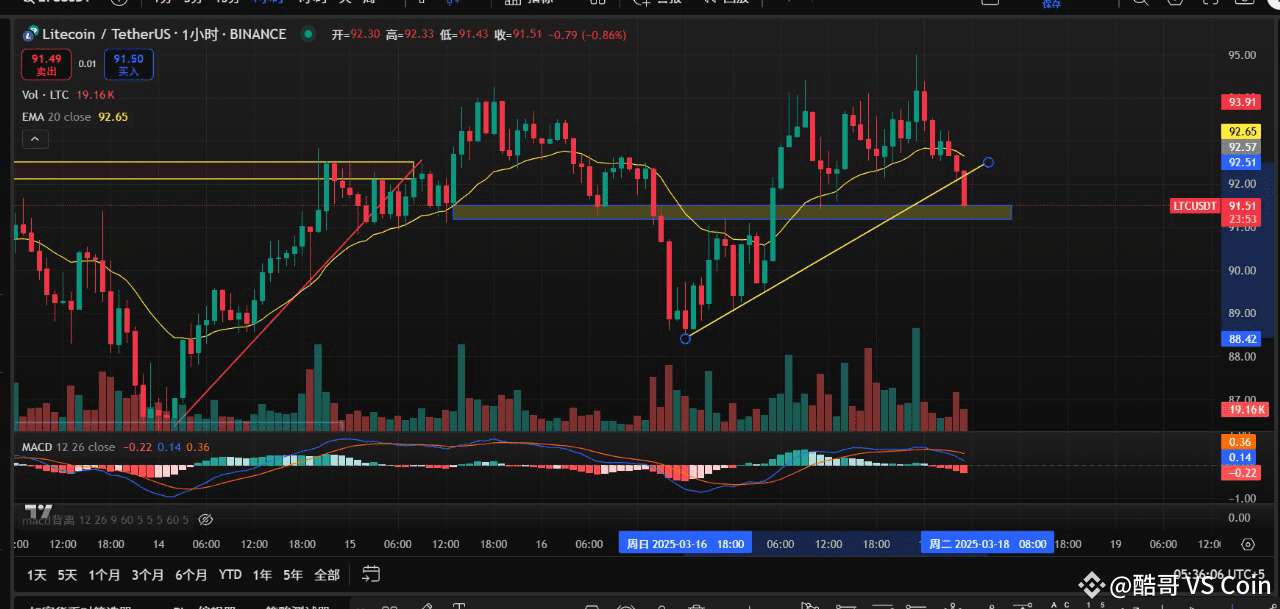
Current LTC Price: $91.51, the trend remains upward, but in the short term, it is testing trendline support, and the market is waiting for direction confirmation.
2. Key Support and Resistance
• Support Level: $91.00-$91.20 (trendline support area; if it holds, there is still a possibility of further upward movement).
• Resistance Level: $92.65-$93.00 (EMA20 moving average and recent short-term high pressure; breakthrough needed for further upward space).
3. Technical Indicator Analysis
• EMA20 Moving Average: The price is currently below the EMA20 ($92.65); a breakthrough above this moving average is required to restore the upward trend.
• MACD: The fast and slow lines are starting to turn downward, and the momentum bars are decreasing, indicating that the market is in a short-term adjustment phase.
• Trading Volume: The trading volume did not significantly increase when testing the trendline, indicating that the market is still observing and needs to wait for support to stabilize.
4. Possible Trends
• Upward Path: If LTC stabilizes at $91.00-$91.20, it is expected to further challenge $92.65-$93.50.
• Consolidation Path: If unable to break through $92.65, it may continue to consolidate between $91.00-$92.65.
• Downward Risk: If it breaks below $91.00, it may short-term retrace to **$88.50-$89.00.
March 18, 2025 LTC/USDT Market Analysis
The following content does not constitute investment advice and is for reference only.
1. Market Overview
Current LTC Price: $91.51, the trend remains upward, but in the short term, it is testing trendline support, and the market is waiting for direction confirmation.
2. Key Support and Resistance
• Support Level: $91.00-$91.20 (trendline support area; if it holds, there is still a possibility of further upward movement).
• Resistance Level: $92.65-$93.00 (EMA20 moving average and recent short-term high pressure; breakthrough needed for further upward space).
3. Technical Indicator Analysis
• EMA20 Moving Average: The price is currently below the EMA20 ($92.65); a breakthrough above this moving average is required to restore the upward trend.
• MACD: The fast and slow lines are starting to turn downward, and the momentum bars are decreasing, indicating that the market is in a short-term adjustment phase.
• Trading Volume: The trading volume did not significantly increase when testing the trendline, indicating that the market is still observing and needs to wait for support to stabilize.
4. Possible Trends
• Upward Path: If LTC stabilizes at $91.00-$91.20, it is expected to further challenge $92.65-$93.50.
• Consolidation Path: If unable to break through $92.65, it may continue to consolidate between $91.00-$92.65.
• Downward Risk: If it breaks below $91.00, it may short-term retrace to **$88.50-$89.00.