Hey, crypto fam! 🤑 Today, let's talk about something that’s been *buzzing* in the Bitcoin market lately – the *Double Head and Shoulders (H&S) pattern*. Sounds a bit technical? Don’t worry, I’ve got you covered! Let’s break it down in simple terms, along with some predictions and analysis on where Bitcoin might be headed! 🤔
---
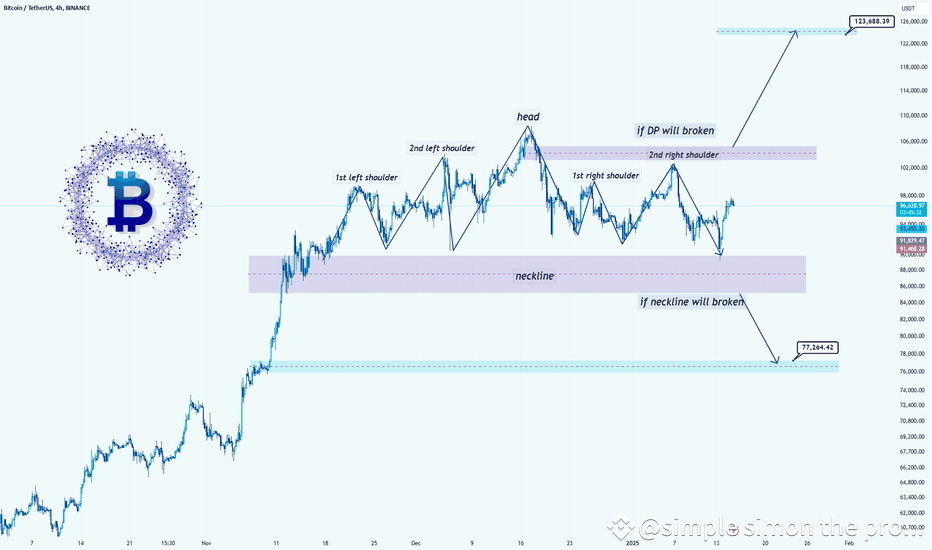
*What is a Head and Shoulders (H&S) Pattern?*
The *Head and Shoulders* pattern is a *classic technical analysis* pattern that traders look out for, especially when predicting price reversals. It’s made up of:
- *Left Shoulder* 📉: A price peak followed by a decline.
- *Head* 📈: A higher price peak.
- *Right Shoulder* 📉: Another price peak (lower than the head) followed by a decline.
When the price breaks below the *neckline* (a trendline connecting the lows between the two shoulders), it signals a *reversal* from an uptrend to a downtrend. 🧐
---
*What is a Double Head and Shoulders (Double H&S)?*
A *Double Head and Shoulders* is essentially two *H&S patterns* forming consecutively, indicating that Bitcoin’s *bullish momentum* might be coming to an end and a *downtrend* could follow. It’s like an *extra confirmation* that the market could be in trouble. 🚨
- The *first H&S* shows a potential reversal.
- The *second H&S* solidifies the possibility of further price decline.
The *double pattern* is even *stronger* than a single one, making it *critical* for traders to pay attention to it.
---
*Bitcoin at a Crossroads: Why It Matters Now*
Right now, Bitcoin is at a *critical point* where it could either:
1. *Continue the Bullish Run* 💥
2. *Reverse and Head Lower* 📉
The *Double H&S* pattern is forming on the *daily chart*, and this could be the *key* to Bitcoin’s next big move.
---
*What Could Happen?*
*1. Bearish Scenario (Price Decline)* 🐻
- *Neckline Break*: If Bitcoin breaks below the *neckline* of the Double H&S pattern (around the 28,000 mark), this could signal a *strong sell-off*.
- *Price Target*: The price target from a Double H S is typically the *height of the pattern*, measured from the head to the neckline, projected downward from the breakout point. If Bitcoin breaks the neckline, we could see it drop to around *20,000* or even lower in the worst-case scenario.
*2. Bullish Scenario (Price Continuation)* 🐂
- *Reversal of the Pattern*: If Bitcoin hold above the neckline and *breaks out upwards*, the Double H&S could be invalidated. In this case, Bitcoin could *continue its bullish trend* and even test new highs above *35,000*.
- *Confirmation Level*: Watch for a *clear breakout above32,500*. If Bitcoin breaks this level, it could signal a *resumption of the uptrend*.
---
*Predictions and Analysis:*
- *Short-Term Bearish*: The current formation of the *Double H&S* suggests that Bitcoin could be in for a *short-term correction*. Be cautious of a *pullback to 28,000* or lower, especially if the30,000 level doesn’t hold.
- *Long-Term Bullish*: If Bitcoin manages to invalidate the Double H&S and break above key resistance levels, we could see another *bullish rally* towards *35,000* or even *40,000* in the coming months. The *long-term outlook* remains positive if Bitcoin can break free from the pattern and maintain upward momentum.
---
*Key Levels to Watch* 👀:
- *Support Level*: 28,000 (neckline of the Double H S pattern)
- *Resistance Level*:32,500 (breakout level for bullish continuation)
- *Price Target*: 20,000 to22,000 if the pattern plays out bearishly.
---
*Conclusion: Bitcoin’s Fate Is in the Balance!


#BTCBackto100K #CPIPlunge2025 #USPPISoftens #BinanceAlphaAlert #USPPITrends