
#sndkb
sndkb
97,809 views
2,350 Discussing
Hot
Latest

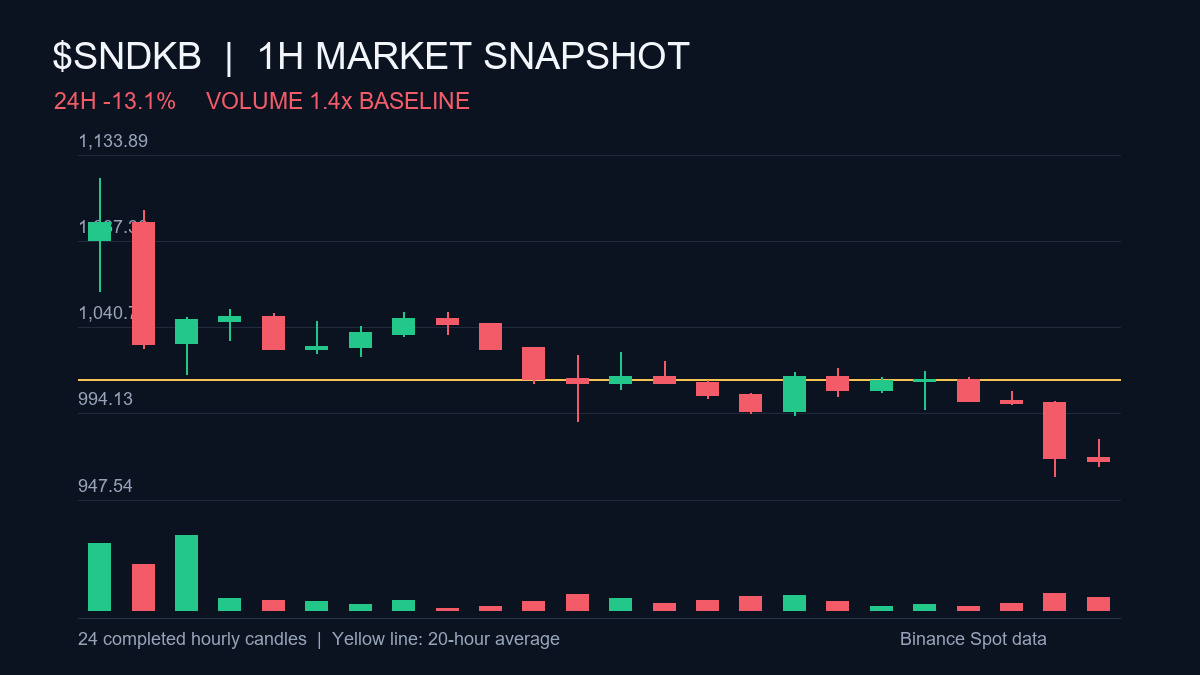
$SNDKB closed its last hourly candle below its 20-hour average at $1,012.64.
Reference: The 24h change is -13.1%; the range is $947.13–$1,121.04.
#SNDKB #AltcoinFlow #PriceAction
$SNDKB closed its last hourly candle below its 20-hour average at $1,012.64.
Reference: The 24h change is -13.1%; the range is $947.13–$1,121.04.
#SNDKB #AltcoinFlow #PriceAction
Reference: The 24h change is -13.1%; the range is $947.13–$1,121.04.
#SNDKB #AltcoinFlow #PriceAction
328

·
--
🔴 $SNDKB SHORT Setup
Pressure is mounting on $SNDKB.
📊 SNDKBUSDT is exhibiting significant bearish momentum, evidenced by a substantial -22.152% decline over the past 24 hours. This sharp downtrend, coupled with a high 24h quote volume, suggests strong selling pressure is dominating the market. We anticipate further price depreciation, making a short entry favorable.
🎯 Trade Plan
Entry: 810.34
Stop Loss: 830.61
TP1: 798.18
TP2: 786.03
TP3: 769.82
⚖️ Risk:Reward (TP1) 1:0.60
⚡ Trigger: Execute short at current market price 810.34
⚠️ Risk Note: This trade carries inherent risks due to market volatility. Ensure proper position sizing and adhere strictly to the stop-loss to manage potential losses. Monitor price action closely.
Protect your capital first, profits follow.
#SNDKB #sndkb
🔴 $SNDKB SHORT Setup
Pressure is mounting on $SNDKB .
📊 SNDKBUSDT is exhibiting significant bearish momentum, evidenced by a substantial -22.152% decline over the past 24 hours. This sharp downtrend, coupled with a high 24h quote volume, suggests strong selling pressure is dominating the market. We anticipate further price depreciation, making a short entry favorable.
🎯 Trade Plan
Entry: 810.34
Stop Loss: 830.61
TP1: 798.18
TP2: 786.03
TP3: 769.82
⚖️ Risk:Reward (TP1) 1:0.60
⚡ Trigger: Execute short at current market price 810.34
⚠️ Risk Note: This trade carries inherent risks due to market volatility. Ensure proper position sizing and adhere strictly to the stop-loss to manage potential losses. Monitor price action closely.
Protect your capital first, profits follow.
#SNDKB #sndkb
Pressure is mounting on $SNDKB .
📊 SNDKBUSDT is exhibiting significant bearish momentum, evidenced by a substantial -22.152% decline over the past 24 hours. This sharp downtrend, coupled with a high 24h quote volume, suggests strong selling pressure is dominating the market. We anticipate further price depreciation, making a short entry favorable.
🎯 Trade Plan
Entry: 810.34
Stop Loss: 830.61
TP1: 798.18
TP2: 786.03
TP3: 769.82
⚖️ Risk:Reward (TP1) 1:0.60
⚡ Trigger: Execute short at current market price 810.34
⚠️ Risk Note: This trade carries inherent risks due to market volatility. Ensure proper position sizing and adhere strictly to the stop-loss to manage potential losses. Monitor price action closely.
Protect your capital first, profits follow.
#SNDKB #sndkb
24

·
--
$SNDKB volume spiked 4.71x above the hourly average, signaling exhaustion.
After a sharp 18.76% daily drop to $846.86, buying interest surged in the final hour. We are currently testing the lower end of the recent $808.01 to $1050.38 range.
Watch for a reclaim of the $862.68 hourly close as a potential bullish signal. Conversely, a sustained break below the $808.01 range low would invalidate current recovery attempts. 📉
Does the recent volume surge suggest a genuine liquidity floor, or is this just a momentary bounce before further consolidation?
Tap $SNDKB for the live chart. #SNDKB #BinanceSquare
$SNDKB volume spiked 4.71x above the hourly average, signaling exhaustion.
After a sharp 18.76% daily drop to $846.86, buying interest surged in the final hour. We are currently testing the lower end of the recent $808.01 to $1050.38 range.
Watch for a reclaim of the $862.68 hourly close as a potential bullish signal. Conversely, a sustained break below the $808.01 range low would invalidate current recovery attempts. 📉
Does the recent volume surge suggest a genuine liquidity floor, or is this just a momentary bounce before further consolidation?
Tap $SNDKB for the live chart. #SNDKB #BinanceSquare
After a sharp 18.76% daily drop to $846.86, buying interest surged in the final hour. We are currently testing the lower end of the recent $808.01 to $1050.38 range.
Watch for a reclaim of the $862.68 hourly close as a potential bullish signal. Conversely, a sustained break below the $808.01 range low would invalidate current recovery attempts. 📉
Does the recent volume surge suggest a genuine liquidity floor, or is this just a momentary bounce before further consolidation?
Tap $SNDKB for the live chart. #SNDKB #BinanceSquare
5

·
--
💀 Absolute carnage in the meme pit — SNDKB -19.4%, TRUMP -18.3%, PEPE -9.5%. New listings and political tokens are getting nuked. RSI readings you don't see every day 📉
When the market dumps, the speculative stuff gets hit like a freight train. These three represent the highest-risk, highest-volatility plays on Binance right now 🎰
📉 SNDKB at $825 (-19.4%) — New listing pain is real. RSI at 18.7 on the 4H is deeply oversold, and volume EXPLODED to 2.76x normal. That's capitulation-level selling. Price is miles below all moving averages (SMA99 at $1,501!). Extremely dangerous to catch this knife.
🇺🇸 TRUMP at $1.16 (-18.3%) — RSI of 13.5 on the 4H. Let that sink in — that's one of the most oversold readings you'll ever see. Volume at 2.21x shows aggressive dumping. L/S ratio at 1.62 means plenty of longs are underwater. Political meme coins are pure narrative — and right now the narrative is pain.
🐸 PEPE at $0.00000467 (-9.5%) — Actually the "calmest" of the three. RSI 40.4 is bearish but not extreme, and volume is DECLINING (0.78x). That could mean selling pressure is fading. Still down hard, but the panic isn't as intense as SNDKB or TRUMP.
📊 Trade Plan (all shorts, but watch for violent bounces):
• SNDKB → Entry: $798–$853 | SL: $935 | TP: $774 / $750 / $718
• TRUMP → Entry: $1.13–$1.19 | SL: $1.29 | TP: $1.09 / $1.06 / $1.01
• PEPE → Entry: $0.00000457–$0.00000477 | SL: $0.00000507 | TP: $0.00000443 / $0.00000430 / $0.00000411
⚡ Key insight: When RSI drops below 20, bounces can be violent and fast. These are momentum shorts — don't overstay. TP1 is the realistic target, TP2/TP3 if panic continues.
Would you dare buy TRUMP at RSI 13? Brave souls only 👇
#SNDKB #TRUMP #PEPE
💀 Absolute carnage in the meme pit — SNDKB -19.4%, TRUMP -18.3%, PEPE -9.5%. New listings and political tokens are getting nuked. RSI readings you don't see every day 📉
When the market dumps, the speculative stuff gets hit like a freight train. These three represent the highest-risk, highest-volatility plays on Binance right now 🎰
📉 SNDKB at $825 (-19.4%) — New listing pain is real. RSI at 18.7 on the 4H is deeply oversold, and volume EXPLODED to 2.76x normal. That's capitulation-level selling. Price is miles below all moving averages (SMA99 at $1,501!). Extremely dangerous to catch this knife.
🇺🇸 TRUMP at $1.16 (-18.3%) — RSI of 13.5 on the 4H. Let that sink in — that's one of the most oversold readings you'll ever see. Volume at 2.21x shows aggressive dumping. L/S ratio at 1.62 means plenty of longs are underwater. Political meme coins are pure narrative — and right now the narrative is pain.
🐸 PEPE at $0.00000467 (-9.5%) — Actually the "calmest" of the three. RSI 40.4 is bearish but not extreme, and volume is DECLINING (0.78x). That could mean selling pressure is fading. Still down hard, but the panic isn't as intense as SNDKB or TRUMP.
📊 Trade Plan (all shorts, but watch for violent bounces):
• SNDKB → Entry: $798–$853 | SL: $935 | TP: $774 / $750 / $718
• TRUMP → Entry: $1.13–$1.19 | SL: $1.29 | TP: $1.09 / $1.06 / $1.01
• PEPE → Entry: $0.00000457–$0.00000477 | SL: $0.00000507 | TP: $0.00000443 / $0.00000430 / $0.00000411
⚡ Key insight: When RSI drops below 20, bounces can be violent and fast. These are momentum shorts — don't overstay. TP1 is the realistic target, TP2/TP3 if panic continues.
Would you dare buy TRUMP at RSI 13? Brave souls only 👇
#SNDKB #TRUMP #PEPE
When the market dumps, the speculative stuff gets hit like a freight train. These three represent the highest-risk, highest-volatility plays on Binance right now 🎰
📉 SNDKB at $825 (-19.4%) — New listing pain is real. RSI at 18.7 on the 4H is deeply oversold, and volume EXPLODED to 2.76x normal. That's capitulation-level selling. Price is miles below all moving averages (SMA99 at $1,501!). Extremely dangerous to catch this knife.
🇺🇸 TRUMP at $1.16 (-18.3%) — RSI of 13.5 on the 4H. Let that sink in — that's one of the most oversold readings you'll ever see. Volume at 2.21x shows aggressive dumping. L/S ratio at 1.62 means plenty of longs are underwater. Political meme coins are pure narrative — and right now the narrative is pain.
🐸 PEPE at $0.00000467 (-9.5%) — Actually the "calmest" of the three. RSI 40.4 is bearish but not extreme, and volume is DECLINING (0.78x). That could mean selling pressure is fading. Still down hard, but the panic isn't as intense as SNDKB or TRUMP.
📊 Trade Plan (all shorts, but watch for violent bounces):
• SNDKB → Entry: $798–$853 | SL: $935 | TP: $774 / $750 / $718
• TRUMP → Entry: $1.13–$1.19 | SL: $1.29 | TP: $1.09 / $1.06 / $1.01
• PEPE → Entry: $0.00000457–$0.00000477 | SL: $0.00000507 | TP: $0.00000443 / $0.00000430 / $0.00000411
⚡ Key insight: When RSI drops below 20, bounces can be violent and fast. These are momentum shorts — don't overstay. TP1 is the realistic target, TP2/TP3 if panic continues.
Would you dare buy TRUMP at RSI 13? Brave souls only 👇
#SNDKB #TRUMP #PEPE
500

·
--
$SNDKB -17.78% | $WLD -8.12% | $VIC -42.96%
#SNDKB trades at $898.33, down 17.78% on $65.6 M volume.
#WLD sits at $0.3588, slipping 8.12% with $25.0 M changing hands.
#VIC is at $0.00770000, a steep 42.96% drop, volume only $1.0 M.
📉 The disparity between SNDKB’s heavy turnover and VIC’s thin activity could signal divergent short‑term pressure.
#Write2Earn #Binance
$SNDKB -17.78% | $WLD -8.12% | $VIC -42.96%
#SNDKB trades at $898.33, down 17.78% on $65.6 M volume.
#WLD sits at $0.3588, slipping 8.12% with $25.0 M changing hands.
#VIC is at $0.00770000, a steep 42.96% drop, volume only $1.0 M.
📉 The disparity between SNDKB’s heavy turnover and VIC’s thin activity could signal divergent short‑term pressure.
#Write2Earn #Binance
#SNDKB trades at $898.33, down 17.78% on $65.6 M volume.
#WLD sits at $0.3588, slipping 8.12% with $25.0 M changing hands.
#VIC is at $0.00770000, a steep 42.96% drop, volume only $1.0 M.
📉 The disparity between SNDKB’s heavy turnover and VIC’s thin activity could signal divergent short‑term pressure.
#Write2Earn #Binance
13

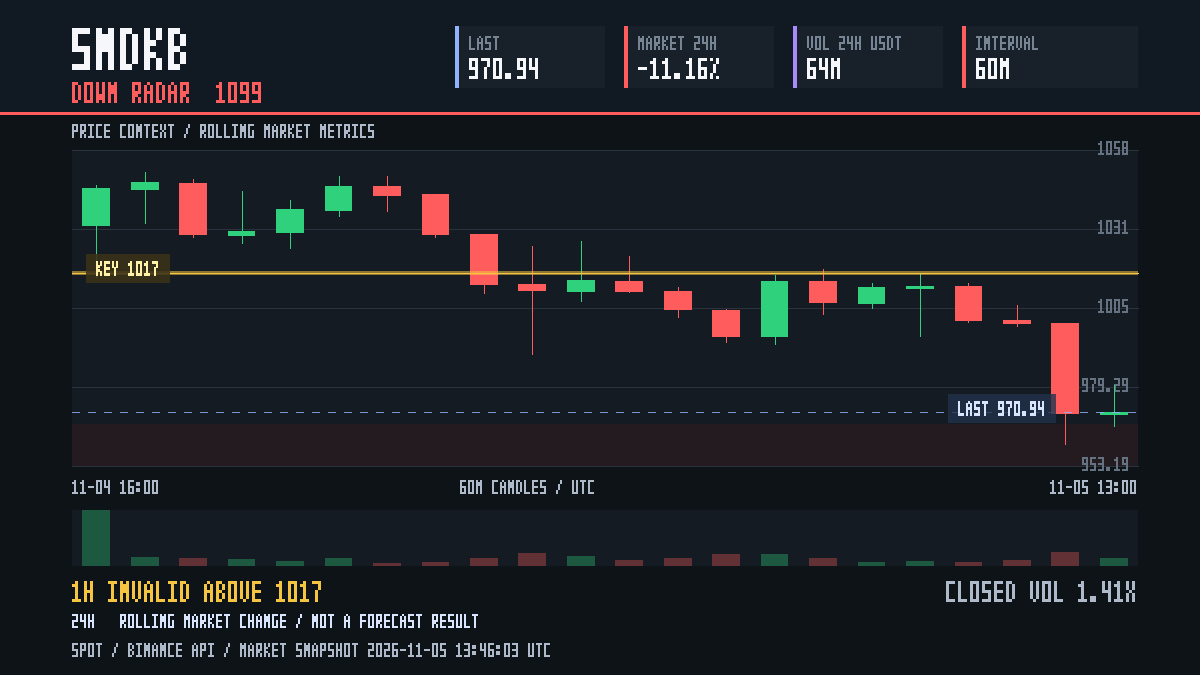
$SNDKB looks heavy after dropping 11.16% in 24h with hourly volume at 1.41x normal. Lose 1017 on the hourly and more downside seems likely. Idea is invalid if we see a 1h close above 1017. Radar #1099: posting the 24h result, hit or miss. Not advice. 📉 Bulls or bears into tomorrow?
$SNDKB {spot}(SNDKBUSDT) {future}(SNDKBUSDT) #SNDKB
$SNDKB looks heavy after dropping 11.16% in 24h with hourly volume at 1.41x normal. Lose 1017 on the hourly and more downside seems likely. Idea is invalid if we see a 1h close above 1017. Radar #1099: posting the 24h result, hit or miss. Not advice. 📉 Bulls or bears into tomorrow?
$SNDKB #SNDKB
$SNDKB #SNDKB
556

·
--
Bullish
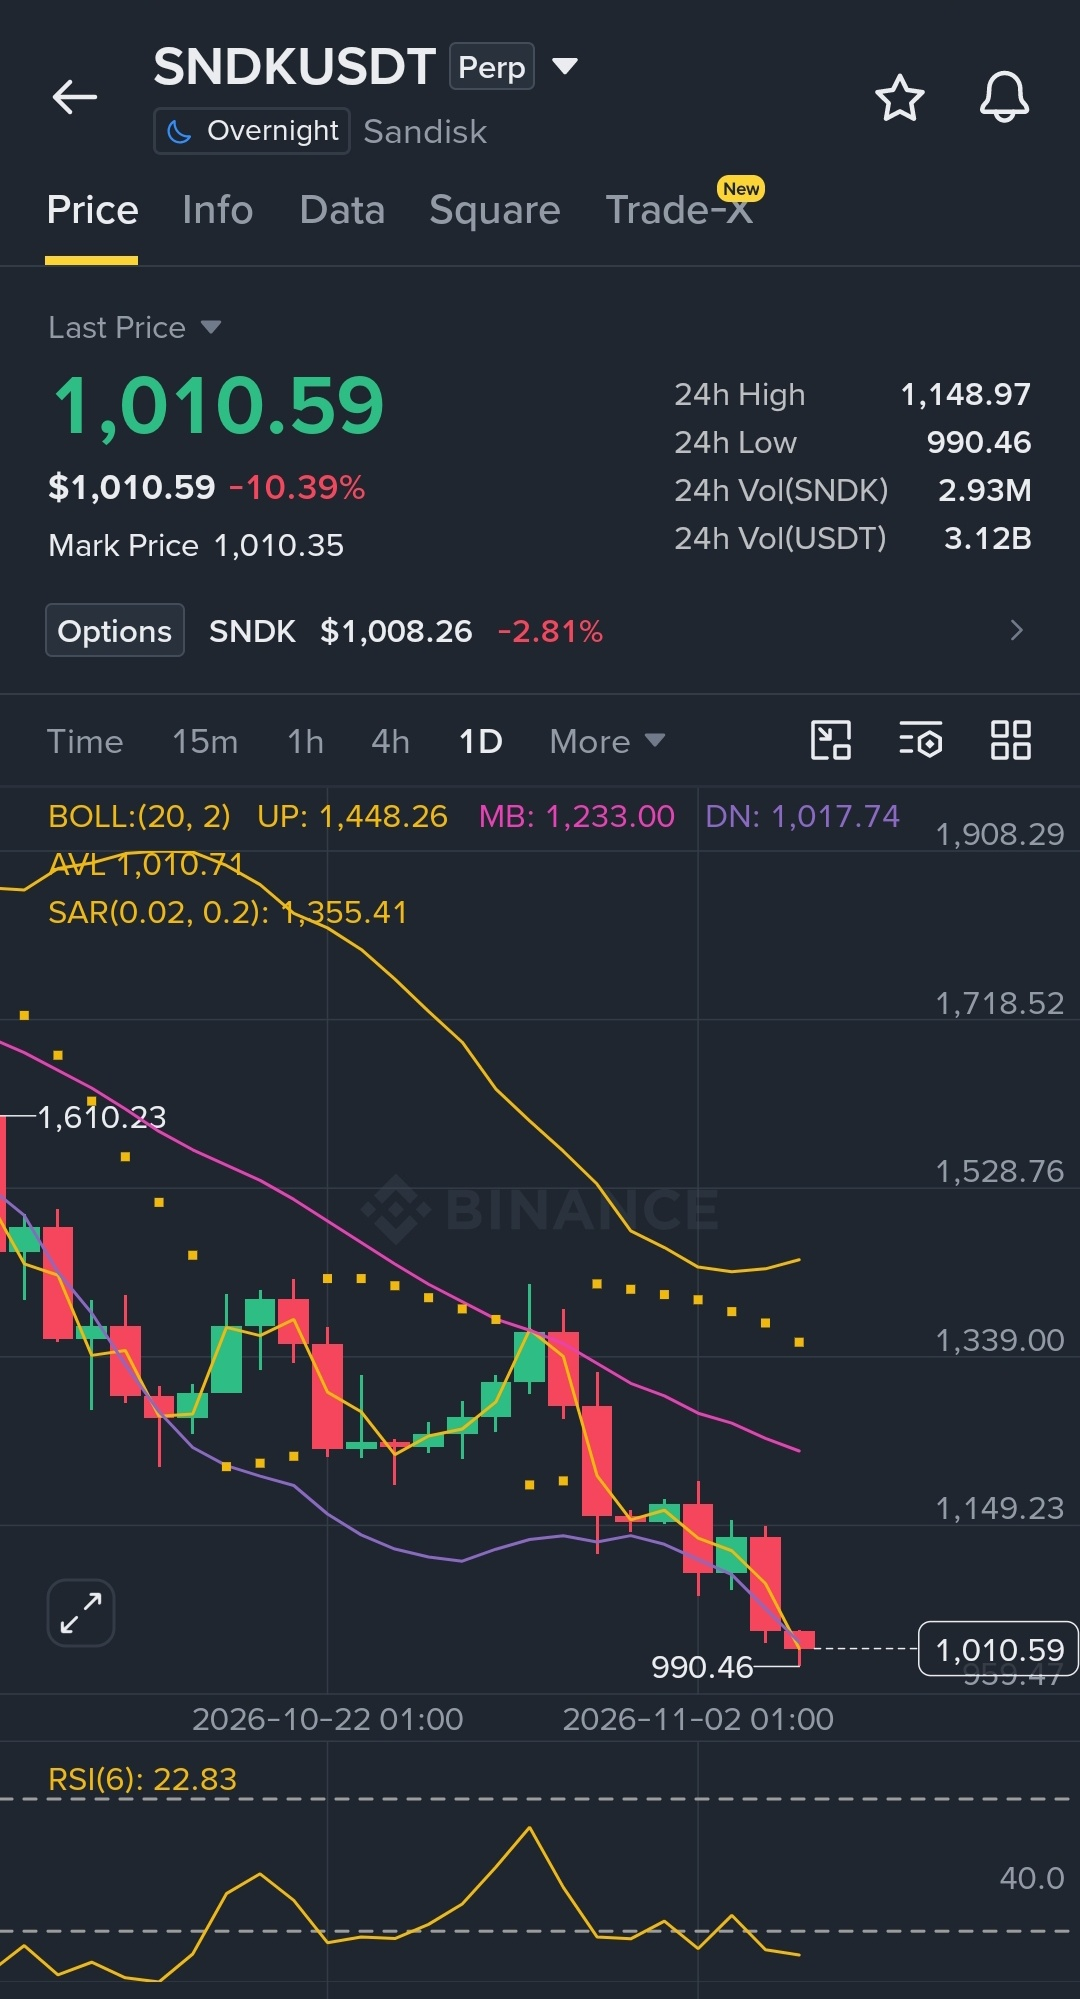
SanDisk or SanCrash 🤣🤣🤣
$SNDKB is indeed crashing non-stop
Sellers are in control and they are milking the market mercilessly 👌
#SNDKB
{future}(SNDKUSDT)
$MUU
{future}(MUUUSDT)
SanDisk or SanCrash 🤣🤣🤣
$SNDKB is indeed crashing non-stop
Sellers are in control and they are milking the market mercilessly 👌
#SNDKB
$MUU
$SNDKB is indeed crashing non-stop
Sellers are in control and they are milking the market mercilessly 👌
#SNDKB
$MUU


一 一得八
·
--
SanDisk
You’re beyond saving now.
You should change your name to SanCrash 😊
You’re beyond saving now.
You should change your name to SanCrash 😊
1
379

·
--
🔥 – $SNDKB is taking a breather, but is another recovery move coming next? 👀
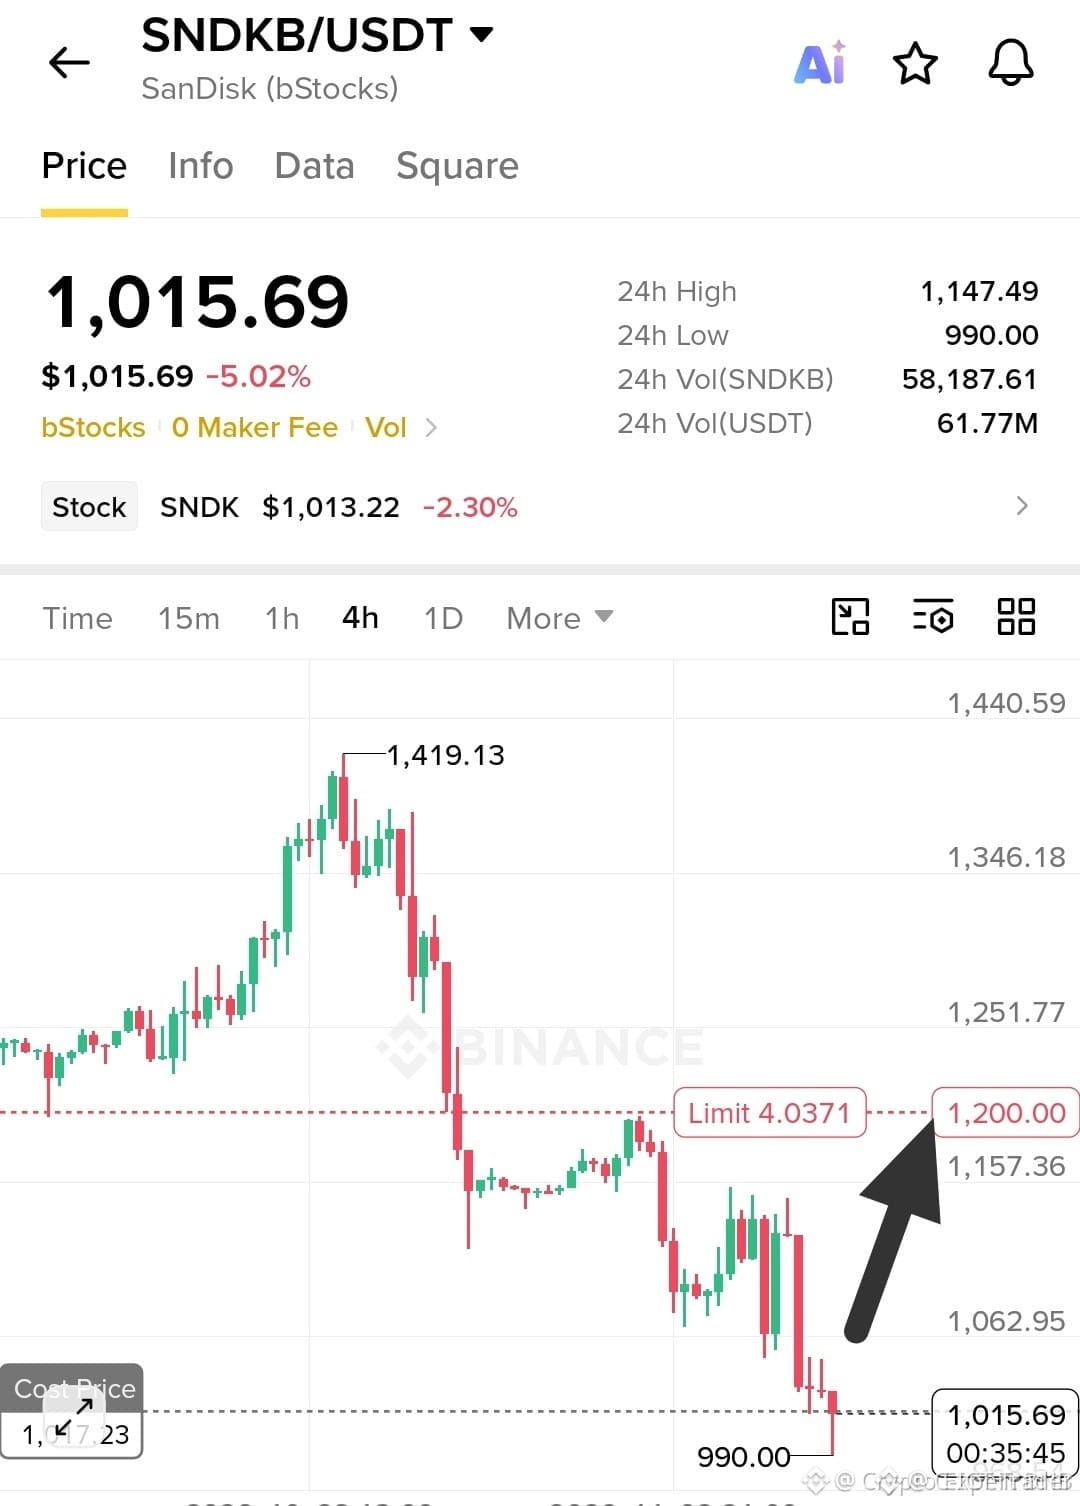
**SNDKB/USDT – $1,014.80 (-4.48%)**
24H High: $1,147.49
24H Low: $990.00
24H Volume: 58,104.71 SNDKB
24H USDT Volume: $61.66M
**Key Levels:**
- Resistance: $1,023 – $1,030
- Strong Resistance: $1,070
- Support: $1,007
- Major Support: $990
**💡 3 HIHP Tips**
1️⃣ Wait for breakout confirmation.
2️⃣ Watch important support levels.
3️⃣ Always manage risk with stop-loss.
Will SNDKB bounce back or drop further? 🤔
#HIHP #SNDKB #cryptotrading #BinanceSquare
🔥 – $SNDKB is taking a breather, but is another recovery move coming next? 👀
**SNDKB/USDT – $1,014.80 (-4.48%)**
24H High: $1,147.49
24H Low: $990.00
24H Volume: 58,104.71 SNDKB
24H USDT Volume: $61.66M
**Key Levels:**
- Resistance: $1,023 – $1,030
- Strong Resistance: $1,070
- Support: $1,007
- Major Support: $990
**💡 3 HIHP Tips**
1️⃣ Wait for breakout confirmation.
2️⃣ Watch important support levels.
3️⃣ Always manage risk with stop-loss.
Will SNDKB bounce back or drop further? 🤔
#HIHP #SNDKB #cryptotrading #BinanceSquare
**SNDKB/USDT – $1,014.80 (-4.48%)**
24H High: $1,147.49
24H Low: $990.00
24H Volume: 58,104.71 SNDKB
24H USDT Volume: $61.66M
**Key Levels:**
- Resistance: $1,023 – $1,030
- Strong Resistance: $1,070
- Support: $1,007
- Major Support: $990
**💡 3 HIHP Tips**
1️⃣ Wait for breakout confirmation.
2️⃣ Watch important support levels.
3️⃣ Always manage risk with stop-loss.
Will SNDKB bounce back or drop further? 🤔
#HIHP #SNDKB #cryptotrading #BinanceSquare
1
430
·
--
$SNDKB trades at $1005.62 on $60.02M volume after a 5.06% daily drop. 📉
Hourly volume sits at 0.43x the daily average, showing cooling sell pressure inside the $990 to $1147.49 range.
If buyers reclaim the $1010.87 hourly close, a push toward the upper range boundary becomes a conditional watch zone. Conversely, losing the $990 low invalidates near-term stabilization.
Will you wait for a confirmed reclaim of $1010.87, or does a drop below $990 signal deeper risk?
Tap $SNDKB for the live chart. #SNDKB #BinanceSquare
$SNDKB trades at $1005.62 on $60.02M volume after a 5.06% daily drop. 📉
Hourly volume sits at 0.43x the daily average, showing cooling sell pressure inside the $990 to $1147.49 range.
If buyers reclaim the $1010.87 hourly close, a push toward the upper range boundary becomes a conditional watch zone. Conversely, losing the $990 low invalidates near-term stabilization.
Will you wait for a confirmed reclaim of $1010.87, or does a drop below $990 signal deeper risk?
Tap $SNDKB for the live chart. #SNDKB #BinanceSquare
Hourly volume sits at 0.43x the daily average, showing cooling sell pressure inside the $990 to $1147.49 range.
If buyers reclaim the $1010.87 hourly close, a push toward the upper range boundary becomes a conditional watch zone. Conversely, losing the $990 low invalidates near-term stabilization.
Will you wait for a confirmed reclaim of $1010.87, or does a drop below $990 signal deeper risk?
Tap $SNDKB for the live chart. #SNDKB #BinanceSquare
9

·
--
🦈 $SNDKB PREPARES FOR HIGH‑RISK BOUNCE ABOVE $1,000 📈
Entry: 1,015 ⚡
Target: 1,040 🎯
Target: 1,075 🎯
Target: 1,120 🎯
Stop Loss: 985 ⚠️
📊 The price is perched on the $998‑$1,000 support cluster, a classic liquidity pocket that has absorbed sellers repeatedly. 🌊 If that zone holds, smart money is likely to thrust the market toward the $1,040–$1,075 corridor, feeding the aggressive 20x long bias.
💡 Momentum remains thin, so the setup leans on a high‑risk bounce rather than a clean reversal. Watch the $985 break as the trigger to unwind the position and preserve capital. 💬 Are you comfortable riding this tight swing with 20x leverage? 👇
⚠️ Not financial advice. Always manage your risk. 🛡️
🏷️ #SNDKB #LongSetup #HighRisk #Leverage #Crypto
🔥 💎
🦈 $SNDKB PREPARES FOR HIGH‑RISK BOUNCE ABOVE $1,000 📈
Entry: 1,015 ⚡
Target: 1,040 🎯
Target: 1,075 🎯
Target: 1,120 🎯
Stop Loss: 985 ⚠️
📊 The price is perched on the $998‑$1,000 support cluster, a classic liquidity pocket that has absorbed sellers repeatedly. 🌊 If that zone holds, smart money is likely to thrust the market toward the $1,040–$1,075 corridor, feeding the aggressive 20x long bias.
💡 Momentum remains thin, so the setup leans on a high‑risk bounce rather than a clean reversal. Watch the $985 break as the trigger to unwind the position and preserve capital. 💬 Are you comfortable riding this tight swing with 20x leverage? 👇
⚠️ Not financial advice. Always manage your risk. 🛡️
🏷️ #SNDKB #LongSetup #HighRisk #Leverage #Crypto
🔥 💎
Entry: 1,015 ⚡
Target: 1,040 🎯
Target: 1,075 🎯
Target: 1,120 🎯
Stop Loss: 985 ⚠️
📊 The price is perched on the $998‑$1,000 support cluster, a classic liquidity pocket that has absorbed sellers repeatedly. 🌊 If that zone holds, smart money is likely to thrust the market toward the $1,040–$1,075 corridor, feeding the aggressive 20x long bias.
💡 Momentum remains thin, so the setup leans on a high‑risk bounce rather than a clean reversal. Watch the $985 break as the trigger to unwind the position and preserve capital. 💬 Are you comfortable riding this tight swing with 20x leverage? 👇
⚠️ Not financial advice. Always manage your risk. 🛡️
🏷️ #SNDKB #LongSetup #HighRisk #Leverage #Crypto
🔥 💎
6
·
--
Let's make it more catchy, natural and engaging this time – with a strong opening hook and a question that encourages comments. 🔥
🔥 MARKET ALERT – SNDKB IS AT A DECISION POINT! WILL BUYERS TAKE CONTROL OR ARE WE ABOUT TO SEE ANOTHER DROP? 👀
📊 $SNDKB /USDT – $1,014.80 (-4.48%)**
🔹 24H High: $1,147.49
🔹 24H Low: $990.00
🔹 24H Volume: 58,104.71 SNDKB
🔹 USDT Volume: $61.66M
🎯 **KEY LEVELS TO WATCH**
- Resistance: $1,023 – $1,030
- Major Resistance: $1,070
- Support: $1,007
- Strong Support: $990
💡 **3 HIHP TRADING TIPS**
1. Wait for confirmation before entering.
2. Watch volume for signs of a possible reversal.
3. Protect your capital with proper stop-loss.
🔥 **LET'S TALK!**
Are you bullish or bearish on SNDKB right now? Drop your prediction below! 👇🤔
#HIHP #SNDKB #cryptotrading #BİNANCESQUARE
Let's make it more catchy, natural and engaging this time – with a strong opening hook and a question that encourages comments. 🔥
🔥 MARKET ALERT – SNDKB IS AT A DECISION POINT! WILL BUYERS TAKE CONTROL OR ARE WE ABOUT TO SEE ANOTHER DROP? 👀
📊 $SNDKB /USDT – $1,014.80 (-4.48%)**
🔹 24H High: $1,147.49
🔹 24H Low: $990.00
🔹 24H Volume: 58,104.71 SNDKB
🔹 USDT Volume: $61.66M
🎯 **KEY LEVELS TO WATCH**
- Resistance: $1,023 – $1,030
- Major Resistance: $1,070
- Support: $1,007
- Strong Support: $990
💡 **3 HIHP TRADING TIPS**
1. Wait for confirmation before entering.
2. Watch volume for signs of a possible reversal.
3. Protect your capital with proper stop-loss.
🔥 **LET'S TALK!**
Are you bullish or bearish on SNDKB right now? Drop your prediction below! 👇🤔
#HIHP #SNDKB #cryptotrading #BİNANCESQUARE
🔥 MARKET ALERT – SNDKB IS AT A DECISION POINT! WILL BUYERS TAKE CONTROL OR ARE WE ABOUT TO SEE ANOTHER DROP? 👀
📊 $SNDKB /USDT – $1,014.80 (-4.48%)**
🔹 24H High: $1,147.49
🔹 24H Low: $990.00
🔹 24H Volume: 58,104.71 SNDKB
🔹 USDT Volume: $61.66M
🎯 **KEY LEVELS TO WATCH**
- Resistance: $1,023 – $1,030
- Major Resistance: $1,070
- Support: $1,007
- Strong Support: $990
💡 **3 HIHP TRADING TIPS**
1. Wait for confirmation before entering.
2. Watch volume for signs of a possible reversal.
3. Protect your capital with proper stop-loss.
🔥 **LET'S TALK!**
Are you bullish or bearish on SNDKB right now? Drop your prediction below! 👇🤔
#HIHP #SNDKB #cryptotrading #BİNANCESQUARE
1
484
·
--
A nine percent drop with sixty-two million in volume tells a quiet story.
$SNDKB trades at $1,000.27 after slipping through the previous hourly close of $1,013.02. Hourly volume sits at 0.59 times the preceding 23-hour average, showing participation is cooling rather than accelerating during the slide.
A bullish scenario requires reclaiming the prior range low of $1,015.56 on expanding volume. Conversely, failure to hold the current handle risks a deeper drift toward the broader 23-hour low of $1,015.56.
Will you wait for volume to cross back above average to confirm a reclaim, or treat a failed test of the $1,015.56 boundary as…
Tap $SNDKB for the live chart. #SNDKB #BinanceSquare
A nine percent drop with sixty-two million in volume tells a quiet story.
$SNDKB trades at $1,000.27 after slipping through the previous hourly close of $1,013.02. Hourly volume sits at 0.59 times the preceding 23-hour average, showing participation is cooling rather than accelerating during the slide.
A bullish scenario requires reclaiming the prior range low of $1,015.56 on expanding volume. Conversely, failure to hold the current handle risks a deeper drift toward the broader 23-hour low of $1,015.56.
Will you wait for volume to cross back above average to confirm a reclaim, or treat a failed test of the $1,015.56 boundary as…
Tap $SNDKB for the live chart. #SNDKB #BinanceSquare
$SNDKB trades at $1,000.27 after slipping through the previous hourly close of $1,013.02. Hourly volume sits at 0.59 times the preceding 23-hour average, showing participation is cooling rather than accelerating during the slide.
A bullish scenario requires reclaiming the prior range low of $1,015.56 on expanding volume. Conversely, failure to hold the current handle risks a deeper drift toward the broader 23-hour low of $1,015.56.
Will you wait for volume to cross back above average to confirm a reclaim, or treat a failed test of the $1,015.56 boundary as…
Tap $SNDKB for the live chart. #SNDKB #BinanceSquare
60
·
--
🔻 $SNDKB SHORT SETUP 🔴
Pressure is mounting on $SNDKB.
Trade Plan
Entry: 999.87
Stop Loss: 1009.87
TP1: 984.87
TP2: 969.87
TP3: 949.88
⚖️ Risk:Reward (TP1) 1:1.50
Trigger: Confirmation of bearish momentum continuation below 999.87
Risk Note: Trading cryptocurrencies carries substantial risk, and losses can exceed initial capital. This setup is for educational purposes only and not financial advice. Always conduct your own research and manage risk appropriately.
Trade the plan, not the emotion.
#SNDKB #sndkb
🔻 $SNDKB SHORT SETUP 🔴
Pressure is mounting on $SNDKB .
Trade Plan
Entry: 999.87
Stop Loss: 1009.87
TP1: 984.87
TP2: 969.87
TP3: 949.88
⚖️ Risk:Reward (TP1) 1:1.50
Trigger: Confirmation of bearish momentum continuation below 999.87
Risk Note: Trading cryptocurrencies carries substantial risk, and losses can exceed initial capital. This setup is for educational purposes only and not financial advice. Always conduct your own research and manage risk appropriately.
Trade the plan, not the emotion.
#SNDKB #sndkb
Pressure is mounting on $SNDKB .
Trade Plan
Entry: 999.87
Stop Loss: 1009.87
TP1: 984.87
TP2: 969.87
TP3: 949.88
⚖️ Risk:Reward (TP1) 1:1.50
Trigger: Confirmation of bearish momentum continuation below 999.87
Risk Note: Trading cryptocurrencies carries substantial risk, and losses can exceed initial capital. This setup is for educational purposes only and not financial advice. Always conduct your own research and manage risk appropriately.
Trade the plan, not the emotion.
#SNDKB #sndkb
54
·
--
Can a 9.23% daily drop find a stable base here?
$SNDKB trades at $1039.04 with $62.29M in daily volume.
The latest hourly close printed up 0.73%, though hourly turnover sits below the daily average at 0.37x.
A bullish continuation scenario depends on holding above the recent 24-hour low of 1015.56. Conversely, dropping below that same 1015.56 boundary invalidates the stabilization case.
Will buyers defend the 1015.56 low before any push toward the 1149.41 high, or will volume dry up completely?
Tap $SNDKB for the live chart. #SNDKB #BinanceSquare
Can a 9.23% daily drop find a stable base here?
$SNDKB trades at $1039.04 with $62.29M in daily volume.
The latest hourly close printed up 0.73%, though hourly turnover sits below the daily average at 0.37x.
A bullish continuation scenario depends on holding above the recent 24-hour low of 1015.56. Conversely, dropping below that same 1015.56 boundary invalidates the stabilization case.
Will buyers defend the 1015.56 low before any push toward the 1149.41 high, or will volume dry up completely?
Tap $SNDKB for the live chart. #SNDKB #BinanceSquare
$SNDKB trades at $1039.04 with $62.29M in daily volume.
The latest hourly close printed up 0.73%, though hourly turnover sits below the daily average at 0.37x.
A bullish continuation scenario depends on holding above the recent 24-hour low of 1015.56. Conversely, dropping below that same 1015.56 boundary invalidates the stabilization case.
Will buyers defend the 1015.56 low before any push toward the 1149.41 high, or will volume dry up completely?
Tap $SNDKB for the live chart. #SNDKB #BinanceSquare
15
·
--
🔻 Triple Threat: 3 Coins Getting Crushed Today — Fade or Fight?
SOXLB, HUMA, and SNDKB are all in freefall with surging volume. When three unrelated assets dump this hard simultaneously, it's either capitulation or the start of something uglier. Let's break each one down.
📉 SOXLB — $65.20 (−9.6%)
RSI at 37.8 on the 4H and already below both the 7 and 25 SMA. Volume is 1.63x average — this isn't low-liquidity drift, it's real selling. Price is trading well below its daily SMA25 ($94), which tells you the downtrend has been building for weeks. No bullish divergence on MACD yet.
📉 HUMA — $0.0169 (−22.4%)
The wildest chart of the three. RSI hit 27.4 on the 4H — deep oversold — but price is still making lower lows. Volume at 3.71x normal screams panic selling. The daily RSI at 28 confirms this isn't just a 4H flush. Catching this knife needs serious confirmation before stepping in.
📉 SNDKB — $1,032 (−7.1%)
Similar story: strong downtrend, surging volume (2.25x), RSI at 35 on the 4H. Price is far below the daily SMA25 ($1,288) and SMA99 ($1,503). The gap between current price and moving averages is massive — either mean reversion is coming or this asset is repricing permanently.
⚡ Trade Plans (SHORT setups — follow the trend):
SOXLB:
Entry: $65.2 – $68.2
SL: $77.1
TP1: $60.4 | TP2: $58.5 | TP3: $56.0
HUMA:
Entry: $0.0159 – $0.0180
SL: $0.0211
TP1: $0.0154 | TP2: $0.0149 | TP3: $0.0143
SNDKB:
Entry: $1,011 – $1,055
SL: $1,120
TP1: $981 | TP2: $950 | TP3: $910
⚠️ Low R:R on all three — these are momentum shorts, not swing holds. Size accordingly and don't overstay.
Which of these do you think bounces first? Or are they all heading lower? 👇
#SOXLB #HUMA #SNDKB
🔻 Triple Threat: 3 Coins Getting Crushed Today — Fade or Fight?
SOXLB, HUMA, and SNDKB are all in freefall with surging volume. When three unrelated assets dump this hard simultaneously, it's either capitulation or the start of something uglier. Let's break each one down.
📉 SOXLB — $65.20 (−9.6%)
RSI at 37.8 on the 4H and already below both the 7 and 25 SMA. Volume is 1.63x average — this isn't low-liquidity drift, it's real selling. Price is trading well below its daily SMA25 ($94), which tells you the downtrend has been building for weeks. No bullish divergence on MACD yet.
📉 HUMA — $0.0169 (−22.4%)
The wildest chart of the three. RSI hit 27.4 on the 4H — deep oversold — but price is still making lower lows. Volume at 3.71x normal screams panic selling. The daily RSI at 28 confirms this isn't just a 4H flush. Catching this knife needs serious confirmation before stepping in.
📉 SNDKB — $1,032 (−7.1%)
Similar story: strong downtrend, surging volume (2.25x), RSI at 35 on the 4H. Price is far below the daily SMA25 ($1,288) and SMA99 ($1,503). The gap between current price and moving averages is massive — either mean reversion is coming or this asset is repricing permanently.
⚡ Trade Plans (SHORT setups — follow the trend):
SOXLB:
Entry: $65.2 – $68.2
SL: $77.1
TP1: $60.4 | TP2: $58.5 | TP3: $56.0
HUMA:
Entry: $0.0159 – $0.0180
SL: $0.0211
TP1: $0.0154 | TP2: $0.0149 | TP3: $0.0143
SNDKB:
Entry: $1,011 – $1,055
SL: $1,120
TP1: $981 | TP2: $950 | TP3: $910
⚠️ Low R:R on all three — these are momentum shorts, not swing holds. Size accordingly and don't overstay.
Which of these do you think bounces first? Or are they all heading lower? 👇
#SOXLB #HUMA #SNDKB
SOXLB, HUMA, and SNDKB are all in freefall with surging volume. When three unrelated assets dump this hard simultaneously, it's either capitulation or the start of something uglier. Let's break each one down.
📉 SOXLB — $65.20 (−9.6%)
RSI at 37.8 on the 4H and already below both the 7 and 25 SMA. Volume is 1.63x average — this isn't low-liquidity drift, it's real selling. Price is trading well below its daily SMA25 ($94), which tells you the downtrend has been building for weeks. No bullish divergence on MACD yet.
📉 HUMA — $0.0169 (−22.4%)
The wildest chart of the three. RSI hit 27.4 on the 4H — deep oversold — but price is still making lower lows. Volume at 3.71x normal screams panic selling. The daily RSI at 28 confirms this isn't just a 4H flush. Catching this knife needs serious confirmation before stepping in.
📉 SNDKB — $1,032 (−7.1%)
Similar story: strong downtrend, surging volume (2.25x), RSI at 35 on the 4H. Price is far below the daily SMA25 ($1,288) and SMA99 ($1,503). The gap between current price and moving averages is massive — either mean reversion is coming or this asset is repricing permanently.
⚡ Trade Plans (SHORT setups — follow the trend):
SOXLB:
Entry: $65.2 – $68.2
SL: $77.1
TP1: $60.4 | TP2: $58.5 | TP3: $56.0
HUMA:
Entry: $0.0159 – $0.0180
SL: $0.0211
TP1: $0.0154 | TP2: $0.0149 | TP3: $0.0143
SNDKB:
Entry: $1,011 – $1,055
SL: $1,120
TP1: $981 | TP2: $950 | TP3: $910
⚠️ Low R:R on all three — these are momentum shorts, not swing holds. Size accordingly and don't overstay.
Which of these do you think bounces first? Or are they all heading lower? 👇
#SOXLB #HUMA #SNDKB
232

·
--
Memory Lane: $SNDKB Holds Ground on Binance Spot 📊
Price action – $SNDKB trades at $1,029.87 on Binance Spot (SNDKB/USDT), down 7.52 % over the last 24 h. Volume is modest but steady, reflecting neutral market sentiment.
Why it matters – The storage‑chip sector is eyeing Q3 earnings; any surprise could swing the token sharply.
Key levels – Immediate support sits around $1,000, with a secondary floor near $970. Resistance clusters at $1,080, while the mid‑range pivot lies near $1,045. A breach above $1,080 could open a test of $1,120; a dip below $1,000 may trigger a retrace toward $970.
Outlook – Neutral. The token is consolidating within a tight range; we recommend waiting for a decisive break before taking directional positions.
#SNDKB #Stocks #BinanceSquare
Memory Lane: $SNDKB Holds Ground on Binance Spot 📊
Price action – $SNDKB trades at $1,029.87 on Binance Spot (SNDKB/USDT), down 7.52 % over the last 24 h. Volume is modest but steady, reflecting neutral market sentiment.
Why it matters – The storage‑chip sector is eyeing Q3 earnings; any surprise could swing the token sharply.
Key levels – Immediate support sits around $1,000, with a secondary floor near $970. Resistance clusters at $1,080, while the mid‑range pivot lies near $1,045. A breach above $1,080 could open a test of $1,120; a dip below $1,000 may trigger a retrace toward $970.
Outlook – Neutral. The token is consolidating within a tight range; we recommend waiting for a decisive break before taking directional positions.
#SNDKB #Stocks #BinanceSquare
Price action – $SNDKB trades at $1,029.87 on Binance Spot (SNDKB/USDT), down 7.52 % over the last 24 h. Volume is modest but steady, reflecting neutral market sentiment.
Why it matters – The storage‑chip sector is eyeing Q3 earnings; any surprise could swing the token sharply.
Key levels – Immediate support sits around $1,000, with a secondary floor near $970. Resistance clusters at $1,080, while the mid‑range pivot lies near $1,045. A breach above $1,080 could open a test of $1,120; a dip below $1,000 may trigger a retrace toward $970.
Outlook – Neutral. The token is consolidating within a tight range; we recommend waiting for a decisive break before taking directional positions.
#SNDKB #Stocks #BinanceSquare
12

·
--
Bullish
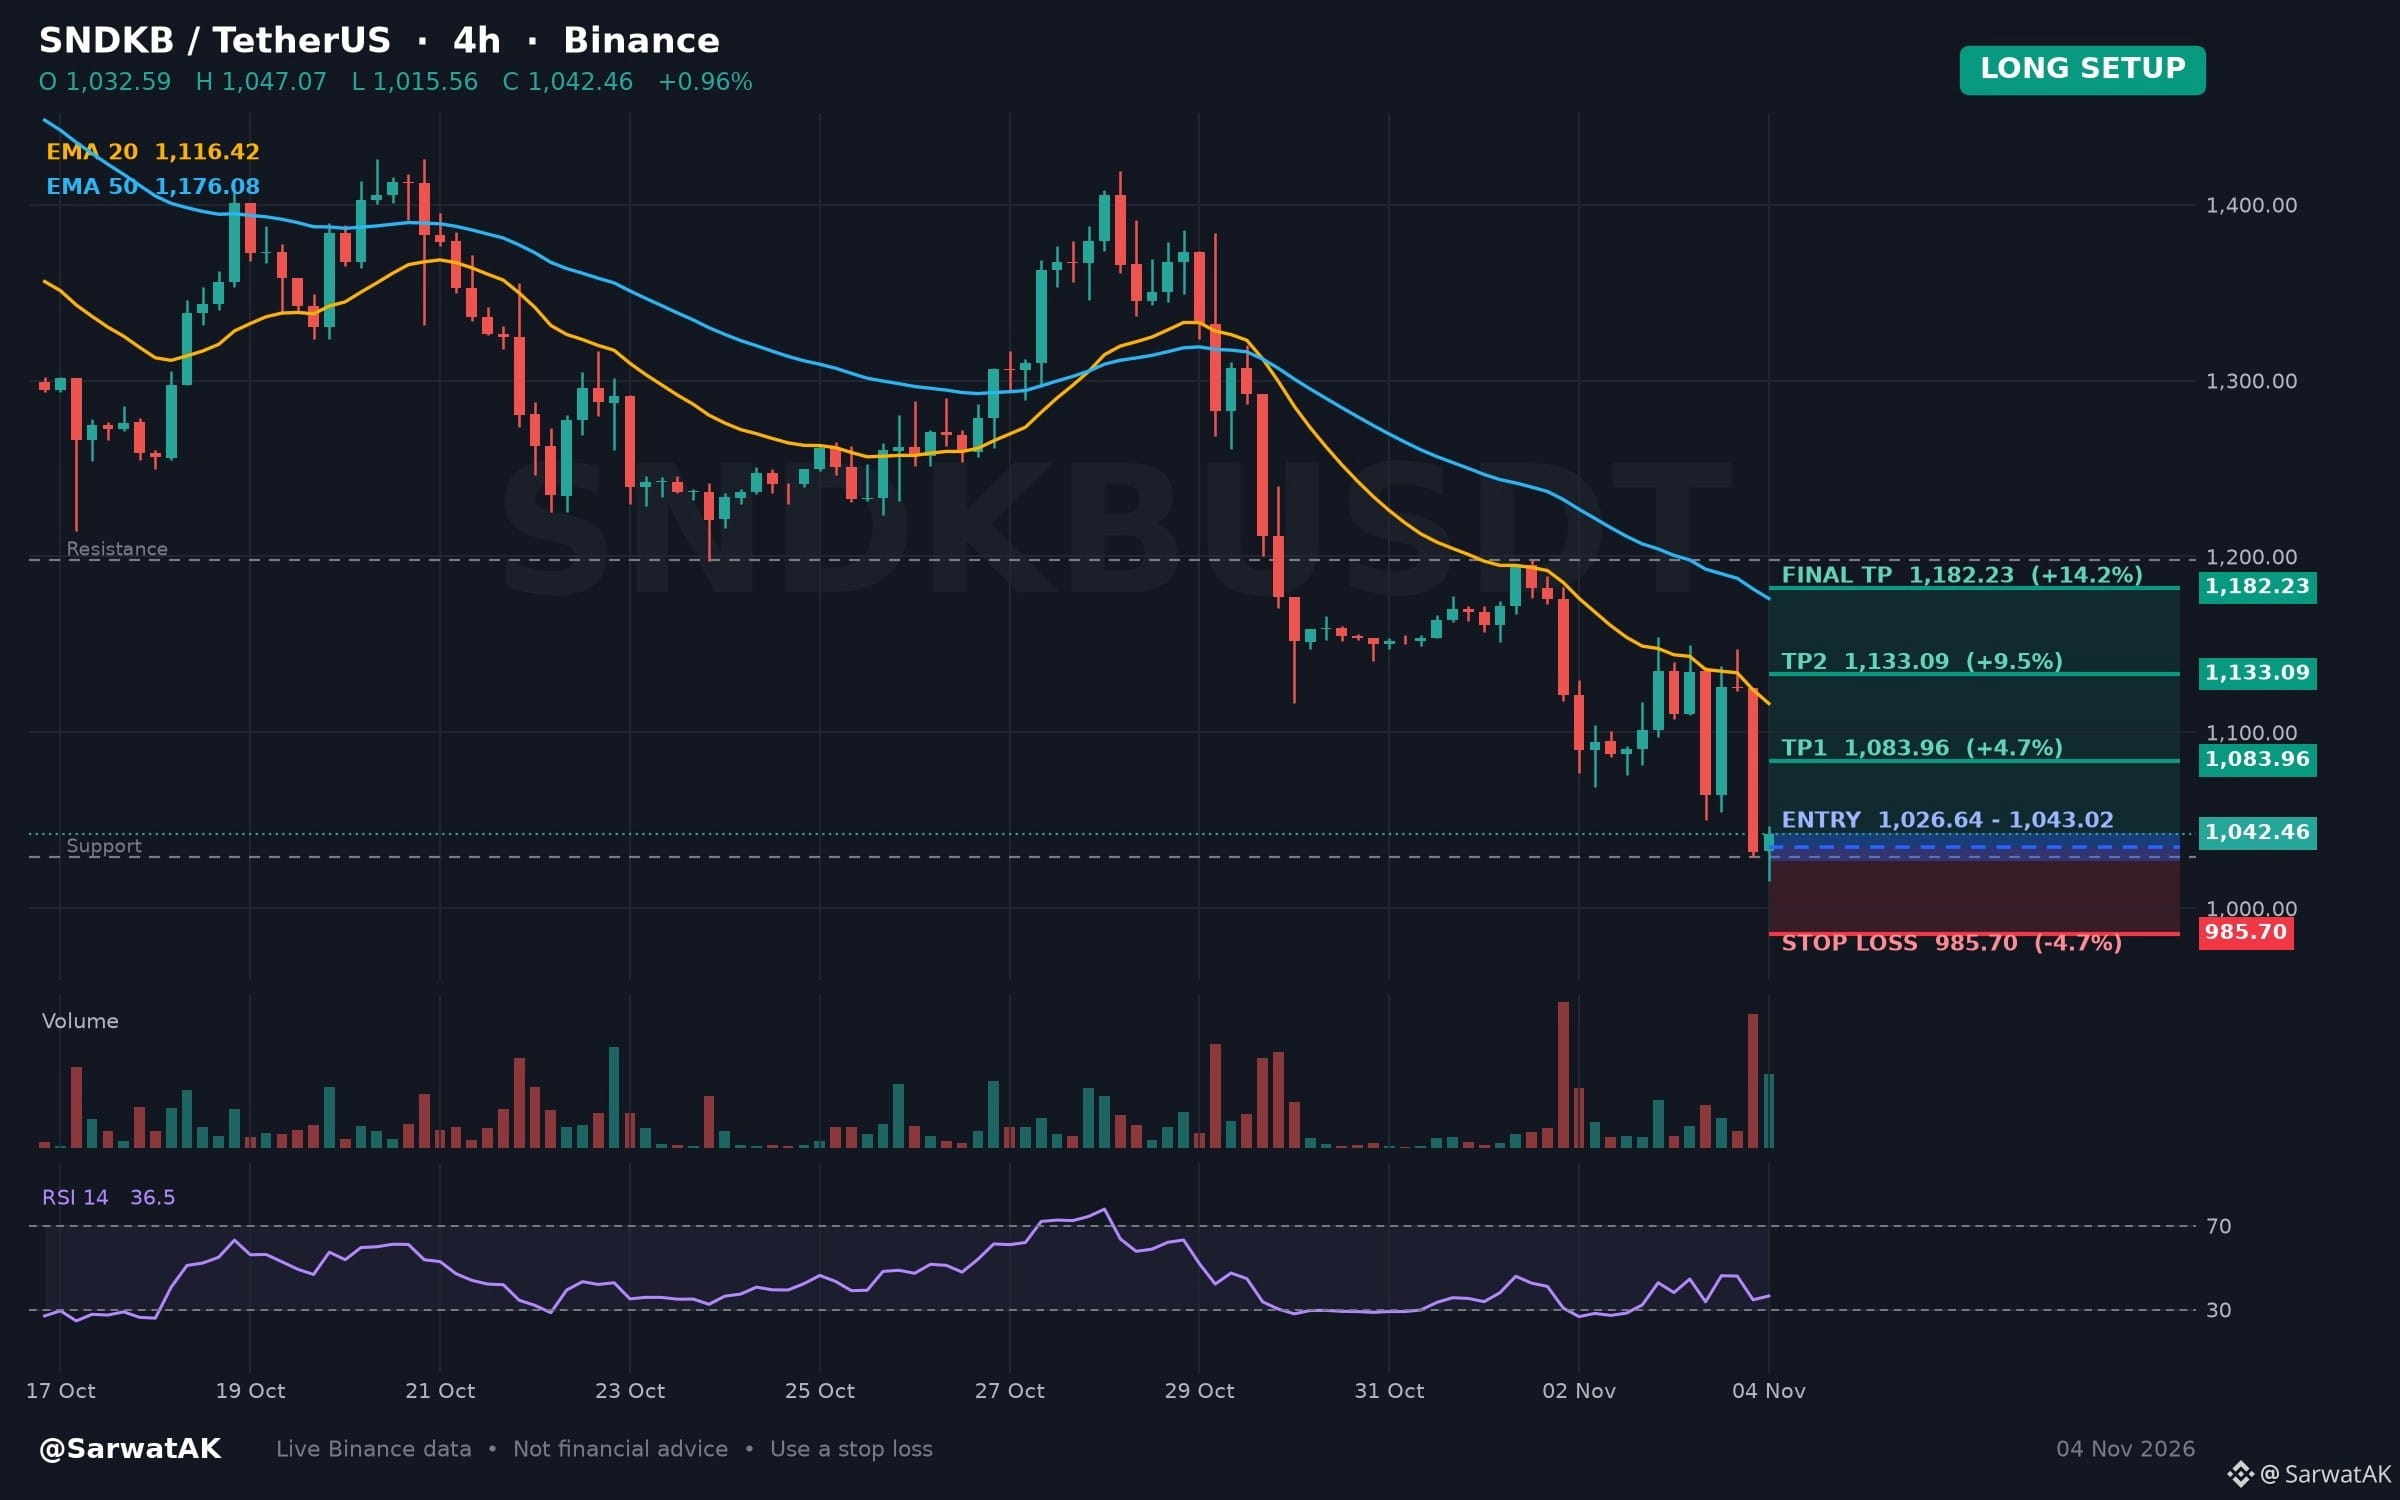
$SNDKB LONG SETUP ... NEXT TARGET 1,182.23
Price Retests Twenty-Candle Swing Low Within Neutral Momentum Framework
Entry: 1,026.64 - 1,043.02 (Long)
TP1: 1,083.96
TP2: 1,133.09
Final TP: 1,182.23
SL: 985.70
Downward movement over the past twenty-four hours brings price to test the twenty-candle swing low. With the four-hour relative strength index in the neutral zone, traders are observing how price responds at this level.
As long as 1,026.64 holds, structure stays constructive
Must use stop loss while trading
Trade $SNDKB
Not financial advice. Always DYOR.
Like & Follow for Daily Trade Analytics & Insider News. @SarwatAK
#SNDKB #TradingSignals #HotTrends
{spot}(SNDKBUSDT)
$SNDKB LONG SETUP ... NEXT TARGET 1,182.23
Price Retests Twenty-Candle Swing Low Within Neutral Momentum Framework
Entry: 1,026.64 - 1,043.02 (Long)
TP1: 1,083.96
TP2: 1,133.09
Final TP: 1,182.23
SL: 985.70
Downward movement over the past twenty-four hours brings price to test the twenty-candle swing low. With the four-hour relative strength index in the neutral zone, traders are observing how price responds at this level.
As long as 1,026.64 holds, structure stays constructive
Must use stop loss while trading
Trade $SNDKB
Not financial advice. Always DYOR.
Like & Follow for Daily Trade Analytics & Insider News. @SarwatAK
#SNDKB #TradingSignals #HotTrends
Price Retests Twenty-Candle Swing Low Within Neutral Momentum Framework
Entry: 1,026.64 - 1,043.02 (Long)
TP1: 1,083.96
TP2: 1,133.09
Final TP: 1,182.23
SL: 985.70
Downward movement over the past twenty-four hours brings price to test the twenty-candle swing low. With the four-hour relative strength index in the neutral zone, traders are observing how price responds at this level.
As long as 1,026.64 holds, structure stays constructive
Must use stop loss while trading
Trade $SNDKB
Not financial advice. Always DYOR.
Like & Follow for Daily Trade Analytics & Insider News. @SarwatAK
#SNDKB #TradingSignals #HotTrends
432
·
--
Volume spiked 4.68x above average as $SNDKB slid 8.06% to $1034.28.
Heavy turnover during the drop below the prior 1050 low signals active supply entering the market.
If buyers reclaim the 1050 level, it could attract relief participation toward recent ranges. Conversely, failure to hold above current levels risks prolonged distribution.
Will a sustained push back above 1050 confirm buyers are stepping in, or will continued heavy volume below that threshold invalidate the recovery attempt?
Tap $SNDKB for the live chart. #SNDKB #BinanceSquare
Volume spiked 4.68x above average as $SNDKB slid 8.06% to $1034.28.
Heavy turnover during the drop below the prior 1050 low signals active supply entering the market.
If buyers reclaim the 1050 level, it could attract relief participation toward recent ranges. Conversely, failure to hold above current levels risks prolonged distribution.
Will a sustained push back above 1050 confirm buyers are stepping in, or will continued heavy volume below that threshold invalidate the recovery attempt?
Tap $SNDKB for the live chart. #SNDKB #BinanceSquare
Heavy turnover during the drop below the prior 1050 low signals active supply entering the market.
If buyers reclaim the 1050 level, it could attract relief participation toward recent ranges. Conversely, failure to hold above current levels risks prolonged distribution.
Will a sustained push back above 1050 confirm buyers are stepping in, or will continued heavy volume below that threshold invalidate the recovery attempt?
Tap $SNDKB for the live chart. #SNDKB #BinanceSquare
2


·
--
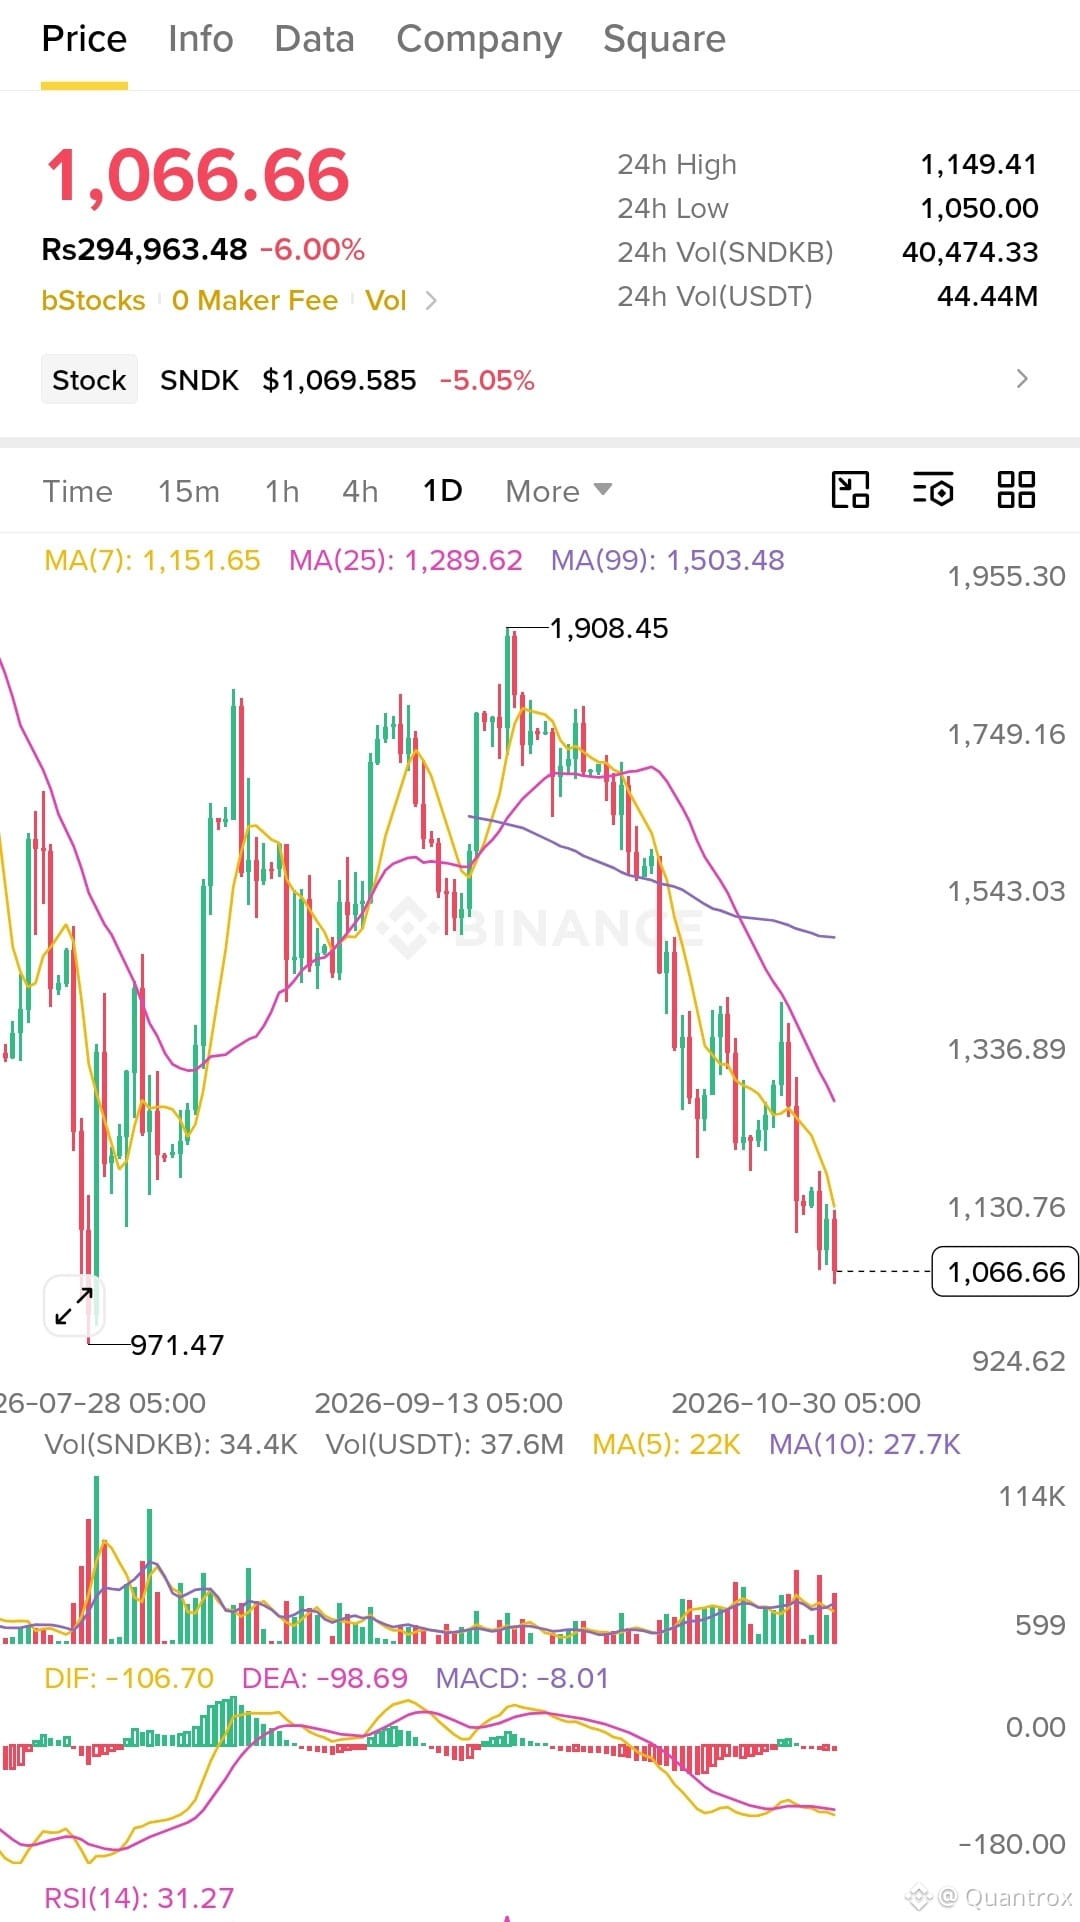
🚨 $SNDKB : BUY THE DIP OR CATCH THE FALL?
Down 44% from 1,908. Now 1,050 is the critical level.
Lose it, and 971 could be next. Hold it, and a bounce toward 1,150 is possible.
I'm waiting for confirmation.
Would you buy at 1,050?
#SNDKB #CryptoTrading #bStocks
DYOR | NFA
🚨 $SNDKB : BUY THE DIP OR CATCH THE FALL?
Down 44% from 1,908. Now 1,050 is the critical level.
Lose it, and 971 could be next. Hold it, and a bounce toward 1,150 is possible.
I'm waiting for confirmation.
Would you buy at 1,050?
#SNDKB #CryptoTrading #bStocks
DYOR | NFA
Down 44% from 1,908. Now 1,050 is the critical level.
Lose it, and 971 could be next. Hold it, and a bounce toward 1,150 is possible.
I'm waiting for confirmation.
Would you buy at 1,050?
#SNDKB #CryptoTrading #bStocks
DYOR | NFA
117
·
--
$SNDKB +4.96% | $SUI +3.35% | $XAUT +2.32%
#SNDKB trades at $1,135.34, up +4.96% on $30.4 M of volume.
#SUI sits at $0.8949, gaining +3.35% with $30.2 M moved. It’s a Layer 1 from Mysten Labs, founded by ex‑Meta blockchain engineers.
#XAUT is priced at $4,009.45, climbing +2.32% on $26.0 M of activity. 👀
The close volume parity between SNDKB and SUI could signal short‑term trader attention shifting between these two sectors.
#Write2Earn #Binance
$SNDKB +4.96% | $SUI +3.35% | $XAUT +2.32%
#SNDKB trades at $1,135.34, up +4.96% on $30.4 M of volume.
#SUI sits at $0.8949, gaining +3.35% with $30.2 M moved. It’s a Layer 1 from Mysten Labs, founded by ex‑Meta blockchain engineers.
#XAUT is priced at $4,009.45, climbing +2.32% on $26.0 M of activity. 👀
The close volume parity between SNDKB and SUI could signal short‑term trader attention shifting between these two sectors.
#Write2Earn #Binance
#SNDKB trades at $1,135.34, up +4.96% on $30.4 M of volume.
#SUI sits at $0.8949, gaining +3.35% with $30.2 M moved. It’s a Layer 1 from Mysten Labs, founded by ex‑Meta blockchain engineers.
#XAUT is priced at $4,009.45, climbing +2.32% on $26.0 M of activity. 👀
The close volume parity between SNDKB and SUI could signal short‑term trader attention shifting between these two sectors.
#Write2Earn #Binance
22
Log in to explore more content
Join global crypto users on Binance Square
⚡️ Get latest and useful information about crypto.
💬 Trusted by the world’s largest crypto exchange.
👍 Discover real insights from verified creators.
Email / Phone number
Trending Topics
1
#BinanceReopensWithdrawalsForMoreAssets
953,393 views
4,892 Discussing
2
#USStocksSlipandCryptoMarketUnderBroadPressure
40,927 views
364 Discussing
3
#StrategySTRCResumesIssuanceAfterOver170Days
34,604 views
489 Discussing
4
#Nasdaq100Tumbles6%
3 views
10 Discussing
5
#GreekParliamentPasses10%CryptoCapitalGainsTaxBill
0 views
13 Discussing
6
#KospiSlideTriggersCircuitBreaker
17 views
10 Discussing
7
#ADPUSPrivateEmployersAdd86000JobsInOctober
52,663 views
634 Discussing
8
#KazakhstanReportedlyInvests$100MInCryptoFunds
3,887 views
65 Discussing
9
#SouthKoreaSeeksCryptoTaxDelayUntil2029
30,492 views
287 Discussing
10
#US10YearTreasuryYieldFallsTo4.845%
49,700 views
227 Discussing