

#s
s
2M views
4,471 Discussing
Hot
Latest


·
--
📡 $S | Layer 1
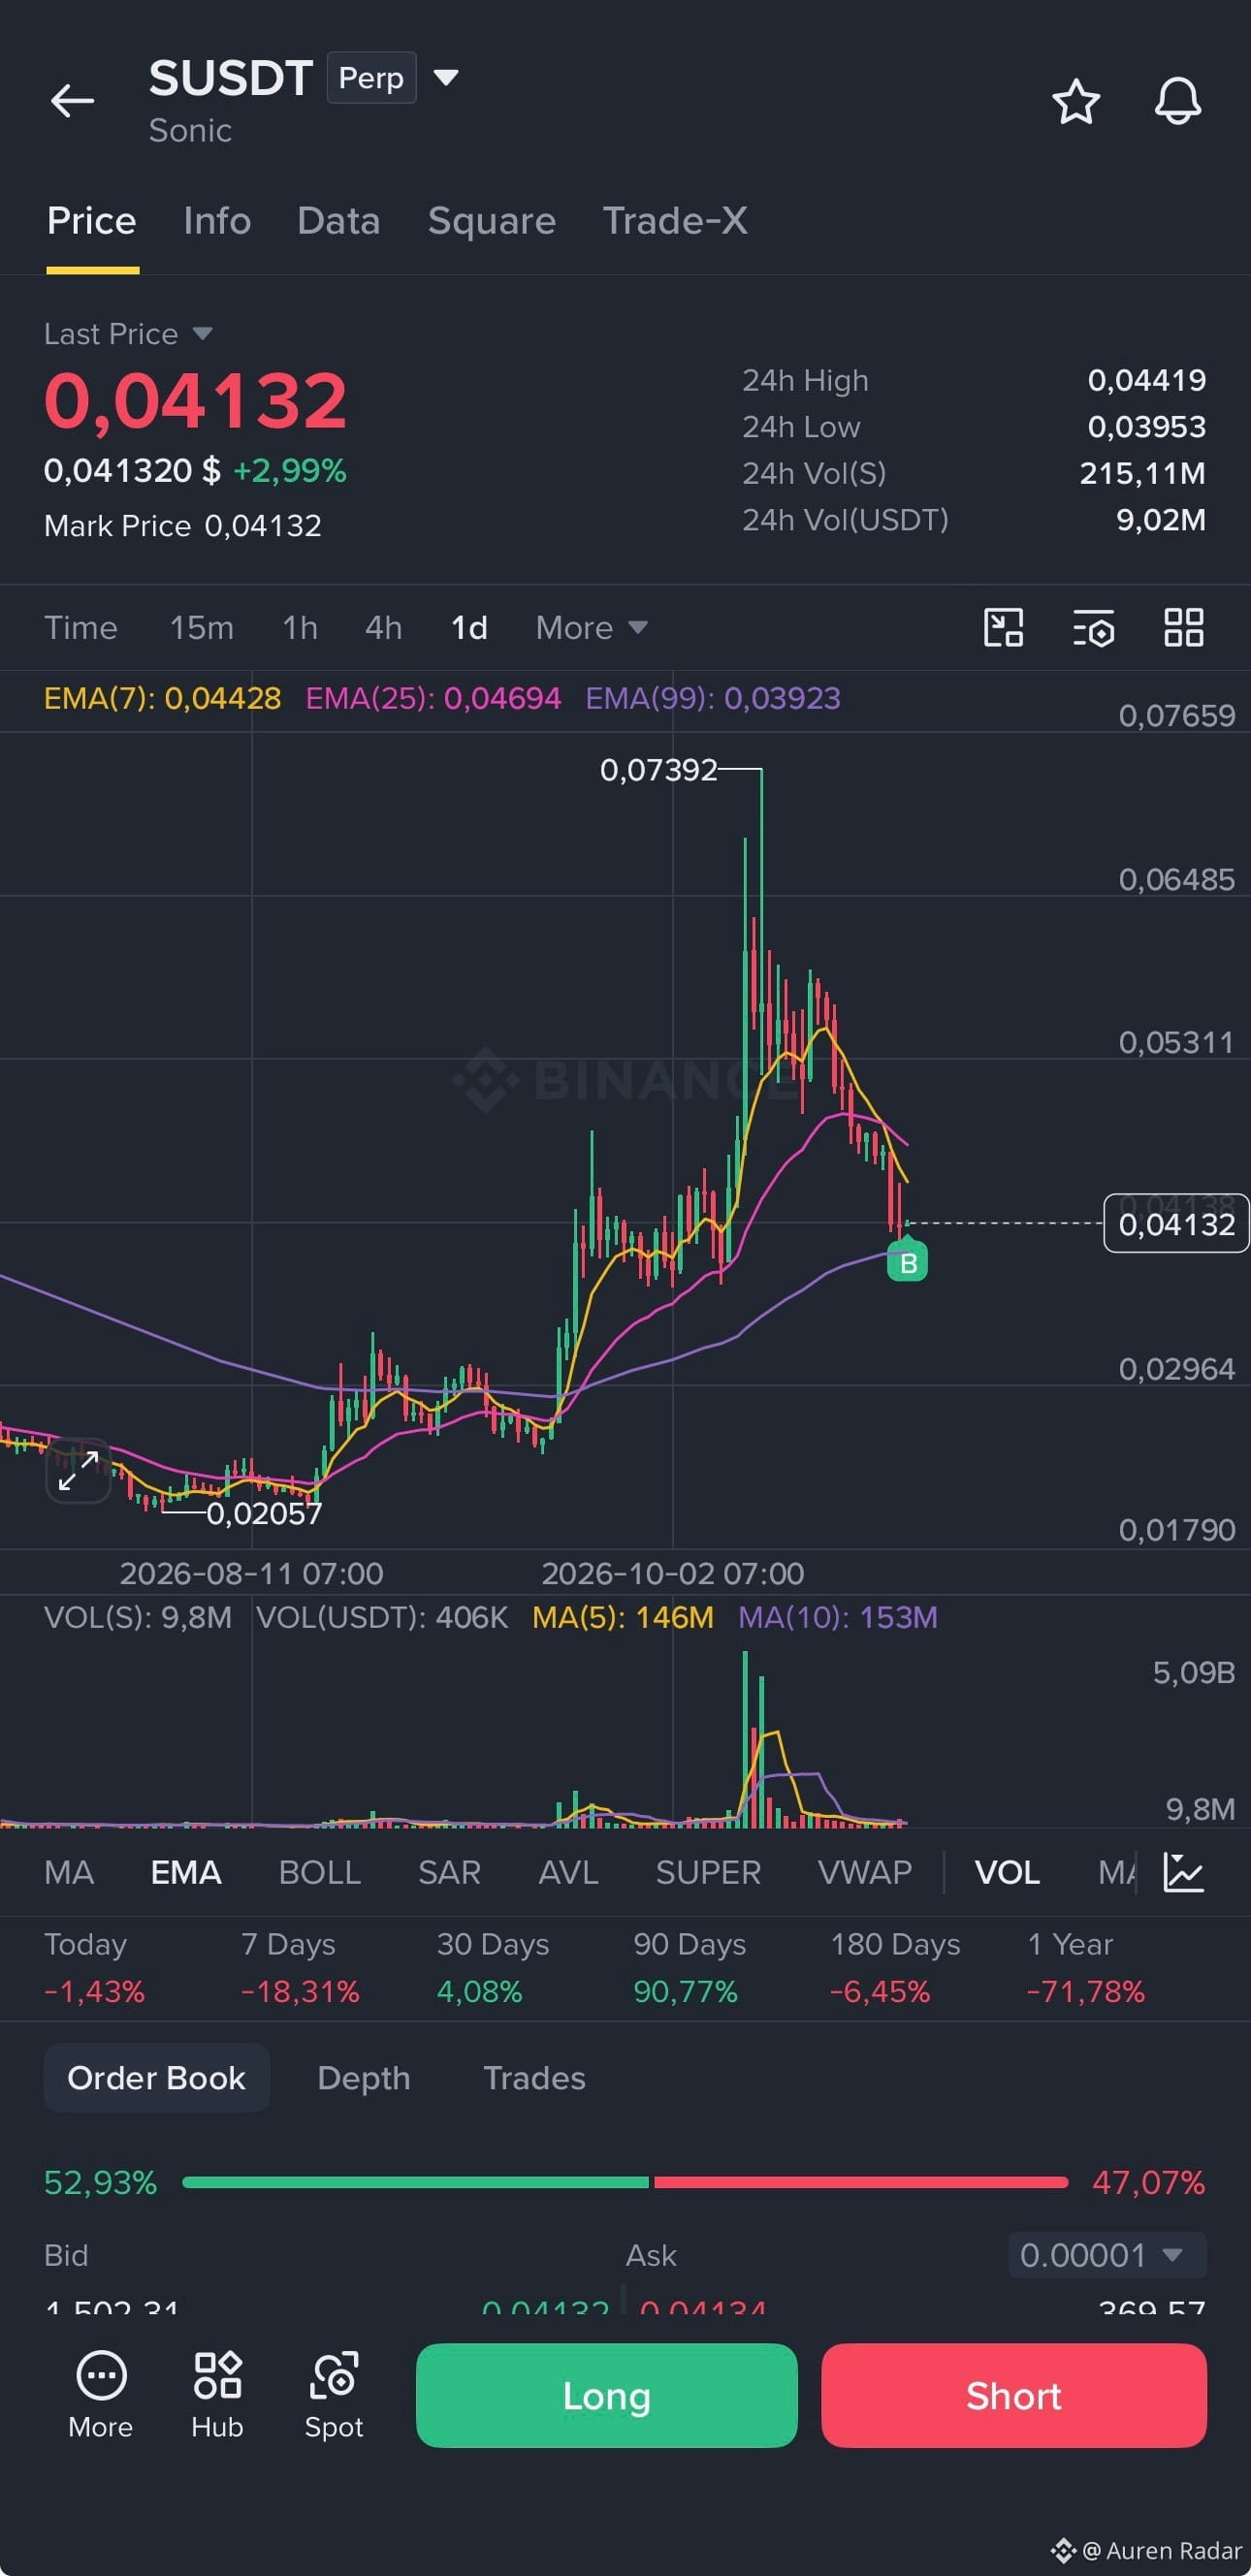
$S is back at strong support around $0.041 after a deep drop from its peak, with the market starting to recover.
Holding this zone could set up a strong recovery leg for $S along with the broader market.
✅ TP: 0.0435 / 0.0455 / 0.055 / 0.069
❌ STL: 0.0365
📌 Personal opinion, not financial advice. DYOR.
#S #Sonic #Layer1 #Altcoins
$SUSDT
1
533

·
--
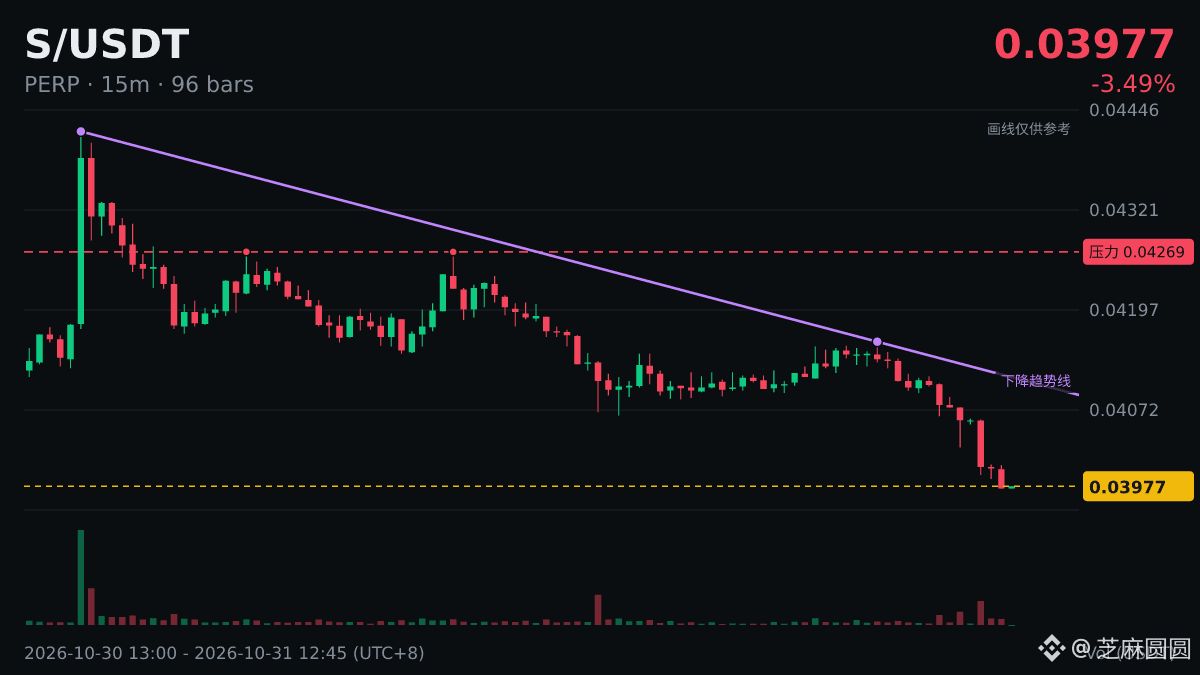
🐻 $S hits a 24-hour low of 0.0398, breaking below the previous low of 0.04025.
Just checked the market, and everything's in the red. The bounce after the first big bearish candle is usually a window to reduce positions. Watch out for further selling.
#S
🐻 $S hits a 24-hour low of 0.0398, breaking below the previous low of 0.04025.
Just checked the market, and everything's in the red. The bounce after the first big bearish candle is usually a window to reduce positions. Watch out for further selling.
#S
Just checked the market, and everything's in the red. The bounce after the first big bearish candle is usually a window to reduce positions. Watch out for further selling.
#S
246

·
--
$S Hit a new 24-hour low of 0.0398, breaking below the previous low of 0.04025.
Selling pressure has clearly intensified. Don't make decisions at the most emotionally charged moment.
#S
$S Hit a new 24-hour low of 0.0398, breaking below the previous low of 0.04025.
Selling pressure has clearly intensified. Don't make decisions at the most emotionally charged moment.
#S
Selling pressure has clearly intensified. Don't make decisions at the most emotionally charged moment.
#S
30

·
--
📋 $S 24-hour new low tracker
Current price 0.0398|Previous low 0.04025|24h -3.73%
The price is below the previous low, which has turned from support into short-term resistance.
Vote in the comments: up or down?
#S
📋 $S 24-hour new low tracker
Current price 0.0398|Previous low 0.04025|24h -3.73%
The price is below the previous low, which has turned from support into short-term resistance.
Vote in the comments: up or down?
#S
Current price 0.0398|Previous low 0.04025|24h -3.73%
The price is below the previous low, which has turned from support into short-term resistance.
Vote in the comments: up or down?
#S
4

·
--
💣 $S hit a new 24-hour low of 0.0398, breaking below the previous low of 0.04025.
It’s fallen hard. During a decline, the most important thing to watch is whether trading volume is shrinking. Did anyone stop-loss early? Share your experience.
#S
💣 $S hit a new 24-hour low of 0.0398, breaking below the previous low of 0.04025.
It’s fallen hard. During a decline, the most important thing to watch is whether trading volume is shrinking. Did anyone stop-loss early? Share your experience.
#S
It’s fallen hard. During a decline, the most important thing to watch is whether trading volume is shrinking. Did anyone stop-loss early? Share your experience.
#S
39

·
--
😵 $S hit a new 24-hour low of 0.0398, breaking below the previous low of 0.04025.
This drop was a bit sudden. A big fall doesn't mean it's bottomed out; patiently wait for a signal. Don't rush—wait for it to stabilize before deciding.
#S
😵 $S hit a new 24-hour low of 0.0398, breaking below the previous low of 0.04025.
This drop was a bit sudden. A big fall doesn't mean it's bottomed out; patiently wait for a signal. Don't rush—wait for it to stabilize before deciding.
#S
This drop was a bit sudden. A big fall doesn't mean it's bottomed out; patiently wait for a signal. Don't rush—wait for it to stabilize before deciding.
#S
135

·
--
🎯 Clean Price Action: $S Rebounding Off Support
Setup: 🟢 LONG $S (FUTURES)
🎯 Entry: 0.04655
🛑 Stop-Loss: 0.04621 (-0.73%)
✅ Take-Profit: 0.04772 (+2.51%)
⚖️ Risk/Reward: 1:3.4
🔍 Technical Reasoning:
The Asian session consolidation range has broken to the upside with strong momentum. Early session breakouts backed by volume typically offer excellent follow-through toward session highs.
💡 Key Confluences:
• Spot+Futures ✓
• 📊 ATR 1.4% — healthy volatility
• 📈 Volume ×1.6 above normal
🚫 Invalidation Rule: If a 1-hour candle closes below $0.04621 (-0.73%), this bullish thesis is invalidated. Exit trade without holding into drawdowns.
💡 Trade Management: Secure 50% profit at Take-Profit target ($0.04772 +2.51%) and move Stop-Loss to Breakeven to eliminate downside risk.
📊 Market Metrics:
• Funding: 0.0050% (Neutral) • Next: 3h 01m
• Open Interest (OI): $6.41M
• 24h Volume: $5.57M
• 24h Range: 0.04511 — 0.04692 (+1.0%)
📈 Strategy Track Record: WR 32% over 1032 trades
#S #CryptoTrading #TechnicalAnalysis #BinanceSquare
⚠️ Not financial advice. Always manage your risk.
13

·
--
S is currently trading at 0.0461, down 1.98% over 24 hours and still down 20.13% over 7 days. The intraday range is 0.0457–0.0480, with a 5.1% amplitude.
【Market action】
According to Binance spot market data, most of the turnover in this move for S took place between 0.0457 and 0.0480.
Key takeaway: The 5.1% amplitude and the 0.0457–0.0480 range indicate that tokens are changing hands around these prices.
S is down 1.98% over 24 hours. Any rebound toward 0.0480 has been pushed back, with heavy overhead supply from holders at a loss.
There are no signs yet of a reversal in the short-term weakness, and selling pressure continues to emerge.
The broader market is up 1.01% over the same period, while S has fallen 1.98%, underperforming the market average.
【Macro】 U.S. stocks rose overnight, with the Nasdaq up 0.82% and the S&P 500 up 0.70% (close on 2026-10-27). BTC ETFs have seen net outflows of about $45.2 billion this month. U.S. CPI came in at 3.7% year over year, above expectations. The probability of an interest rate hike at the 2026-10-27/28 meeting is about 47%. Spot BTC ETFs have seen net outflows of about $45.2 billion this month, as institutional buying has waned.
The short-term outlook leans bearish.
【Bearish case】
Medium-term view: Watch how price behaves around 0.0457; don’t follow short-term sentiment.
The 1.98% drop over 24 hours speaks for itself: sellers have the upper hand in the short term.
One figure hasn’t been priced in: the 20.13% seven-day decline.
$S #S
6

·
--
Technical perspective | $S
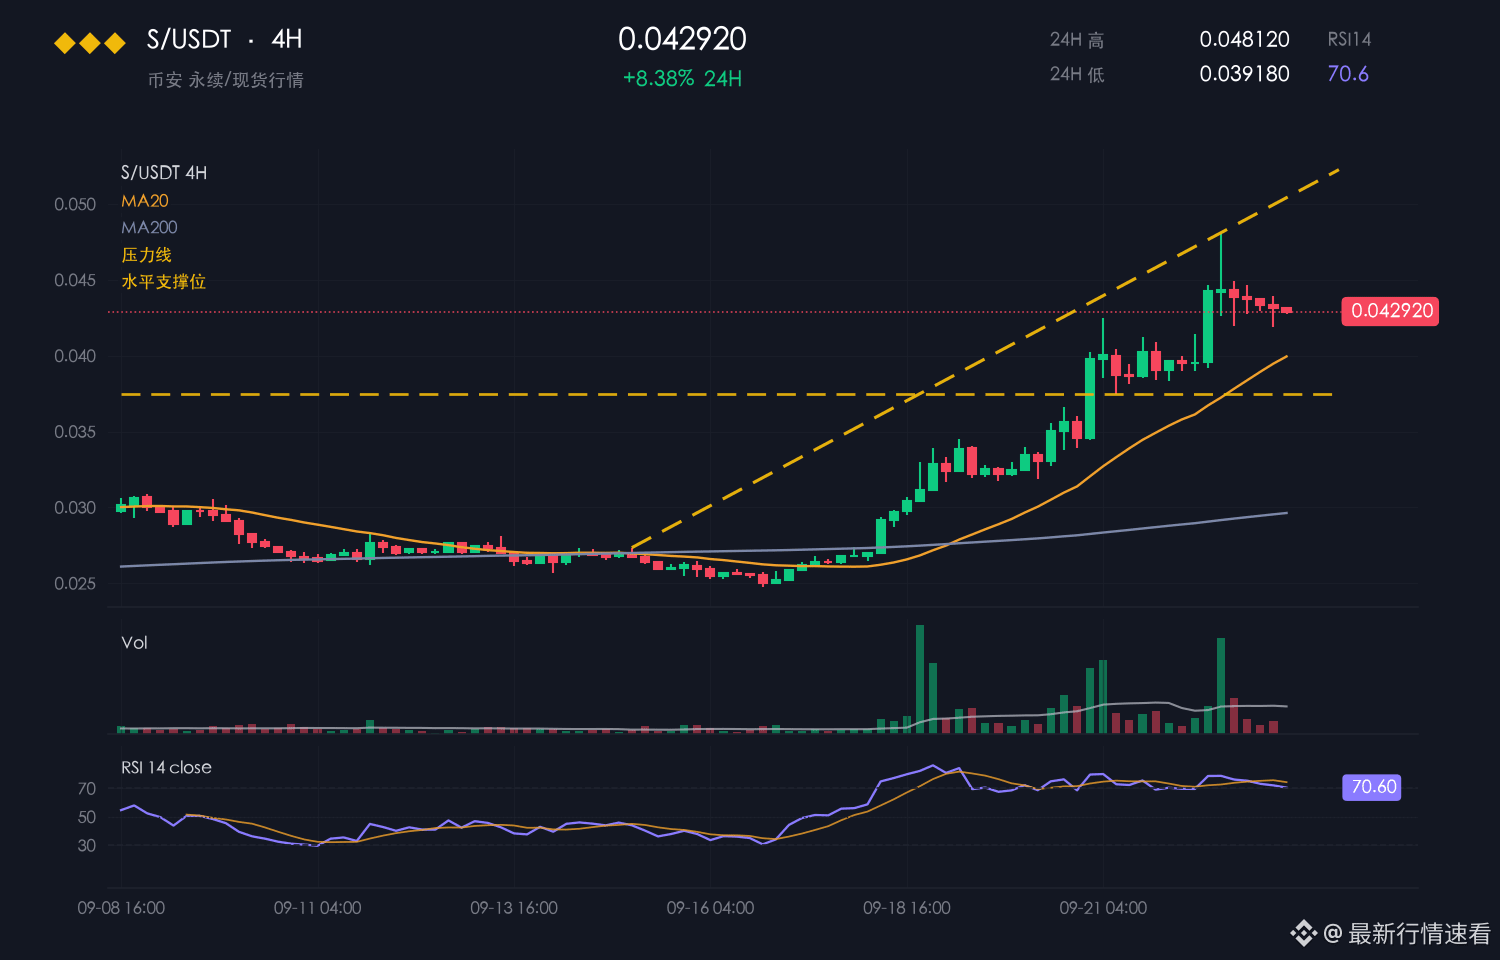
5 min +5.13%, 4h +9.74%, 24h +0.13%
When short sellers are squeezed out, the price often rises sharply and quickly, but it often pulls back afterward.
#S
These are solely my personal views and should not be taken as a basis for buying or selling.
Technical perspective | $S
5 min +5.13%, 4h +9.74%, 24h +0.13%
When short sellers are squeezed out, the price often rises sharply and quickly, but it often pulls back afterward.
#S
These are solely my personal views and should not be taken as a basis for buying or selling.
5 min +5.13%, 4h +9.74%, 24h +0.13%
When short sellers are squeezed out, the price often rises sharply and quickly, but it often pulls back afterward.
#S
These are solely my personal views and should not be taken as a basis for buying or selling.
4

·
--
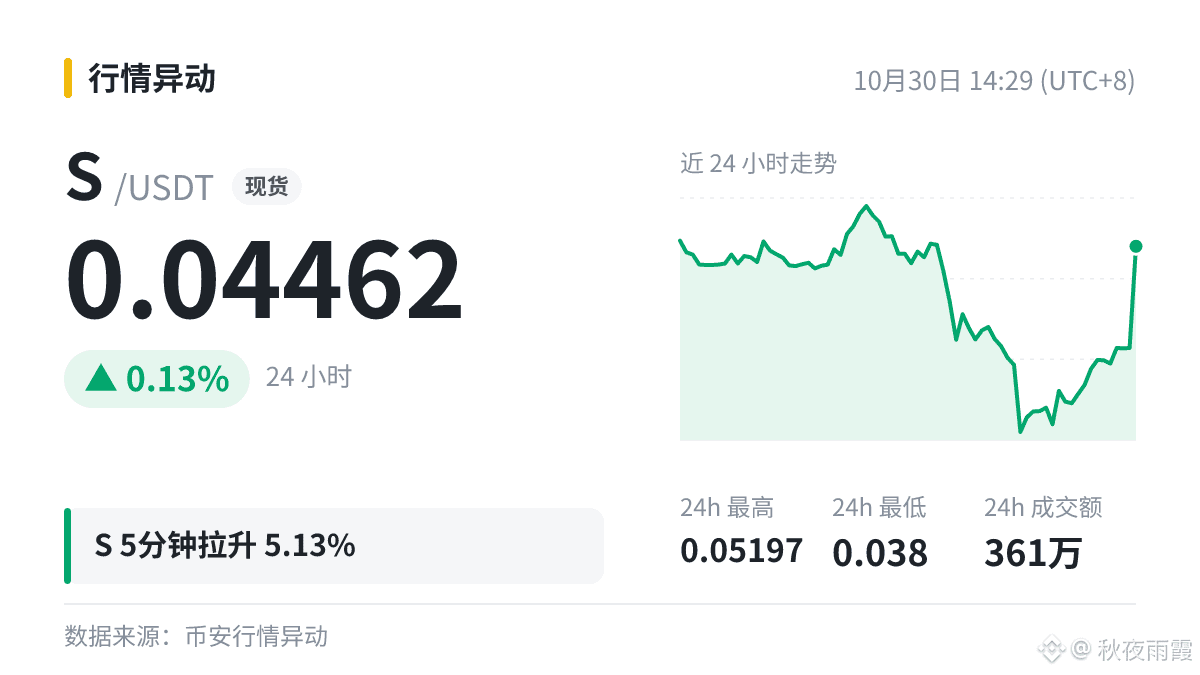
S Spot market: At 14:25 Beijing time on 2026-10-30, the 5-minute change was +6.81%. At the 14:25:01 Beijing time observation on 2026-10-30, the current price was 0.04421, 24h turnover was 3.457 million, above VWAP 0.0410726, and RSI was 91.1. The short-term divergence is what deserves the closest attention. The key question now is whether this is a breakout or just a probing move.
Can the price hold VWAP 0.0410726 on a pullback? Don’t rush to chase it; wait for the pullback and trading volume to provide a second signal.
Note: 24h trading volume is under $5 million, and the order book is thin. Watch out for slippage.
#S #UnusualMoveAlert
Can the price hold VWAP 0.0410726 on a pullback? Don’t rush to chase it; wait for the pullback and trading volume to provide a second signal.
Note: 24h trading volume is under $5 million, and the order book is thin. Watch out for slippage.
#S #UnusualMoveAlert
4

·
--
Multi-timeframe confluence: $S / $FIL / $KSTR weakening on the 4-hour timeframe; daily bearish trend confirmed 🔥
════════════════════
🟢 $S 4-hour bearish signal
⚠️ Technical analysis: Daily bearish confluence confirmed | 4-hour entry: MACD bearish crossover below zero, bearish momentum accelerating | EMA5 < EMA8 < EMA13, bearish alignment | KDJ bearish crossover, short-term outlook bearish (K: 44.1, D: 47.0) | Volume increased (1.7x)
════════════════════
🟢 $FIL 4-hour bearish signal
⚠️ Technical analysis: Daily bearish confluence confirmed | 4-hour entry: MACD bearish crossover below zero, bearish momentum accelerating | EMA5 crossed below EMA8, short-term outlook turns bearish | KDJ bearish crossover, short-term outlook bearish (K: 48.6, D: 57.8) | Volume increased (1.7x)
📢 Market update: Binance Will Support the Filecoin (FIL) Network Upgrade & Hard Fork - 2026-10-19
════════════════════
🟢 $KSTR 4-hour bearish signal
⚠️ Technical analysis: Daily bearish confluence confirmed | 4-hour entry: MACD bearish crossover below zero, bearish momentum accelerating | EMA5 < EMA8 < EMA13, bearish alignment | KDJ in weak territory, bears in control (K: 28.7, D: 30.0) | Volume surged (3.1x)
════════════════════
🔔 Follow for real-time market alerts 🔔
#多周期共振 #S #FIL #KSTR
📌 When trading, pay attention to whether the candlestick pattern confirms the setup
════════════════════
🟢 $S 4-hour bearish signal
⚠️ Technical analysis: Daily bearish confluence confirmed | 4-hour entry: MACD bearish crossover below zero, bearish momentum accelerating | EMA5 < EMA8 < EMA13, bearish alignment | KDJ bearish crossover, short-term outlook bearish (K: 44.1, D: 47.0) | Volume increased (1.7x)
════════════════════
🟢 $FIL 4-hour bearish signal
⚠️ Technical analysis: Daily bearish confluence confirmed | 4-hour entry: MACD bearish crossover below zero, bearish momentum accelerating | EMA5 crossed below EMA8, short-term outlook turns bearish | KDJ bearish crossover, short-term outlook bearish (K: 48.6, D: 57.8) | Volume increased (1.7x)
📢 Market update: Binance Will Support the Filecoin (FIL) Network Upgrade & Hard Fork - 2026-10-19
════════════════════
🟢 $KSTR 4-hour bearish signal
⚠️ Technical analysis: Daily bearish confluence confirmed | 4-hour entry: MACD bearish crossover below zero, bearish momentum accelerating | EMA5 < EMA8 < EMA13, bearish alignment | KDJ in weak territory, bears in control (K: 28.7, D: 30.0) | Volume surged (3.1x)
════════════════════
🔔 Follow for real-time market alerts 🔔
#多周期共振 #S #FIL #KSTR
📌 When trading, pay attention to whether the candlestick pattern confirms the setup
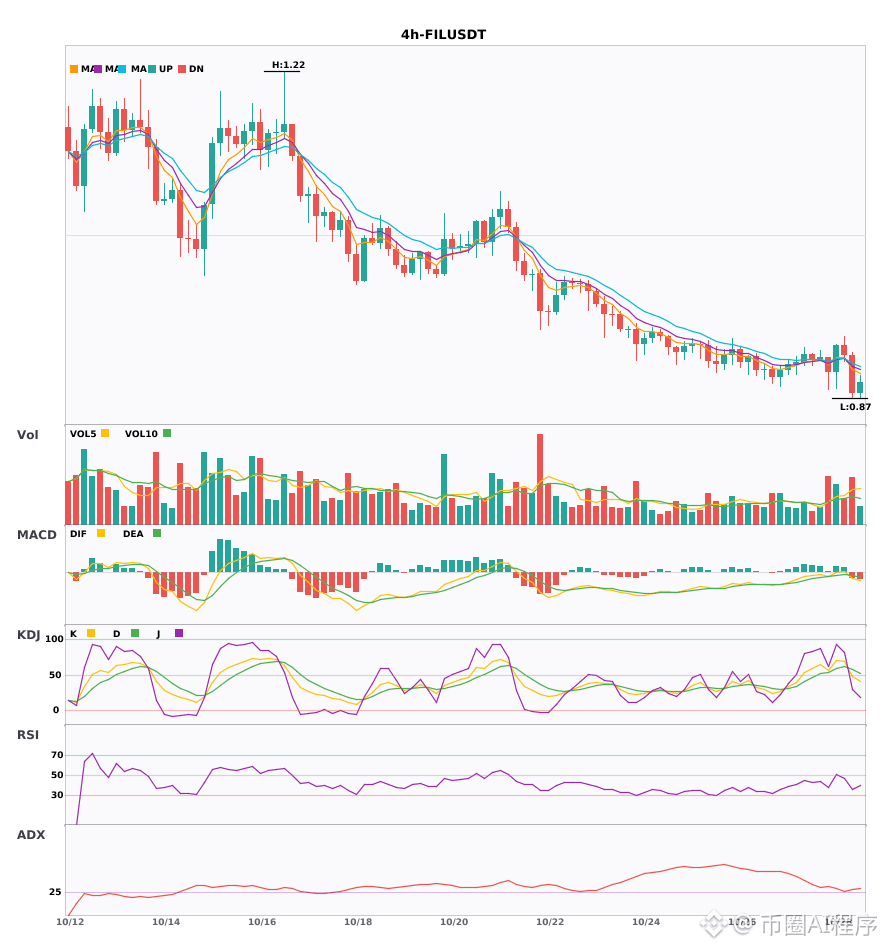
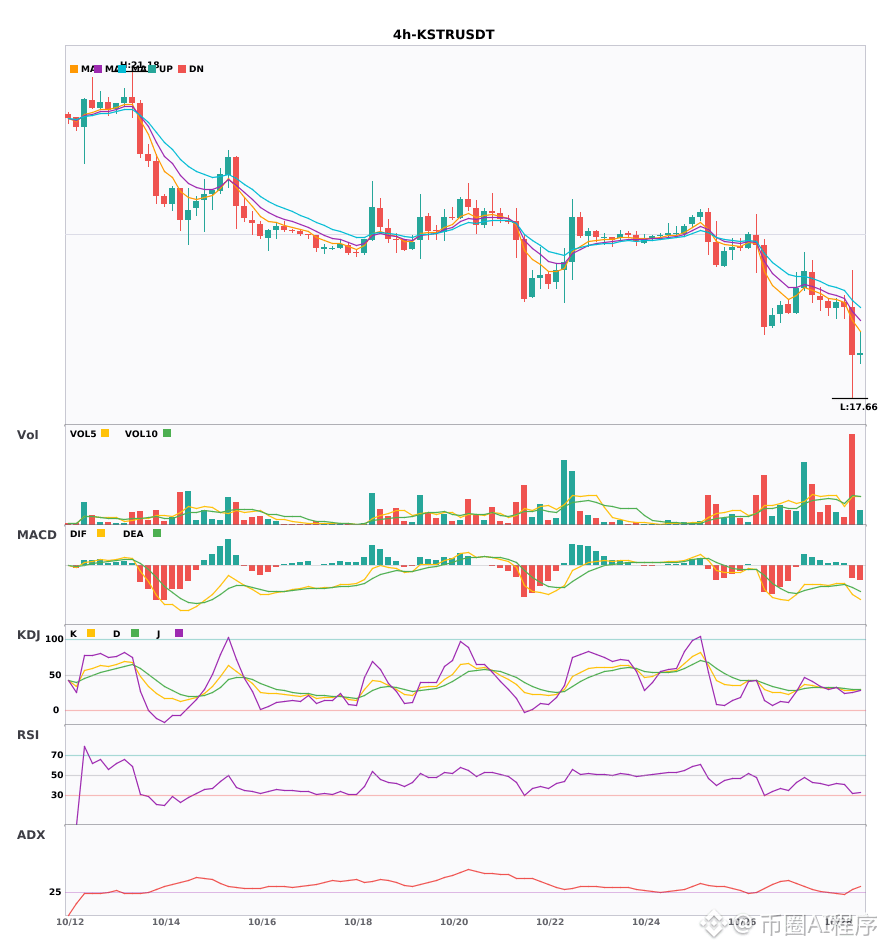
6

·
--
$BABA / $S / $KSTR : Bearish on the 4-hour timeframe, under short-term pressure 🔥
════════════════════
🟢 $BABA 4-hour bearish signal
⚠️Technical analysis: ADX(32) indicates a clear trend | MACD DIF has fallen below the zero line, turning the trend bearish | EMA5 crossed below EMA8, signaling a short-term bearish trend | KDJ is weak, with bears in control (K: 36.0, D: 49.0) | Volume increased (1.8x)
════════════════════
🟢 $S 4-hour bearish signal
⚠️Technical analysis: ADX(50) indicates a very strong trend (beware of an overheated pullback) | MACD bearish crossover below zero, bearish momentum accelerating | EMA5 < EMA8 < EMA13, bearish alignment | KDJ bearish crossover, short-term outlook is bearish (K: 44.1, D: 47.0) | Volume increased (1.7x)
════════════════════
🟢 $KSTR 4-hour bearish signal
⚠️Technical analysis: ADX(29) indicates a trend is forming; there may be an opportunity to enter | MACD bearish crossover below zero, bearish momentum accelerating | EMA5 < EMA8 < EMA13, bearish alignment | KDJ is weak, with bears in control (K: 28.7, D: 30.0) | Volume surged (3.1x)
════════════════════
🔔 Follow for first-hand market movement alerts 🔔
#技术分析 #BABA #S #KSTR
📌 When trading, pay attention to whether the candlestick pattern meets the criteria
════════════════════
🟢 $BABA 4-hour bearish signal
⚠️Technical analysis: ADX(32) indicates a clear trend | MACD DIF has fallen below the zero line, turning the trend bearish | EMA5 crossed below EMA8, signaling a short-term bearish trend | KDJ is weak, with bears in control (K: 36.0, D: 49.0) | Volume increased (1.8x)
════════════════════
🟢 $S 4-hour bearish signal
⚠️Technical analysis: ADX(50) indicates a very strong trend (beware of an overheated pullback) | MACD bearish crossover below zero, bearish momentum accelerating | EMA5 < EMA8 < EMA13, bearish alignment | KDJ bearish crossover, short-term outlook is bearish (K: 44.1, D: 47.0) | Volume increased (1.7x)
════════════════════
🟢 $KSTR 4-hour bearish signal
⚠️Technical analysis: ADX(29) indicates a trend is forming; there may be an opportunity to enter | MACD bearish crossover below zero, bearish momentum accelerating | EMA5 < EMA8 < EMA13, bearish alignment | KDJ is weak, with bears in control (K: 28.7, D: 30.0) | Volume surged (3.1x)
════════════════════
🔔 Follow for first-hand market movement alerts 🔔
#技术分析 #BABA #S #KSTR
📌 When trading, pay attention to whether the candlestick pattern meets the criteria
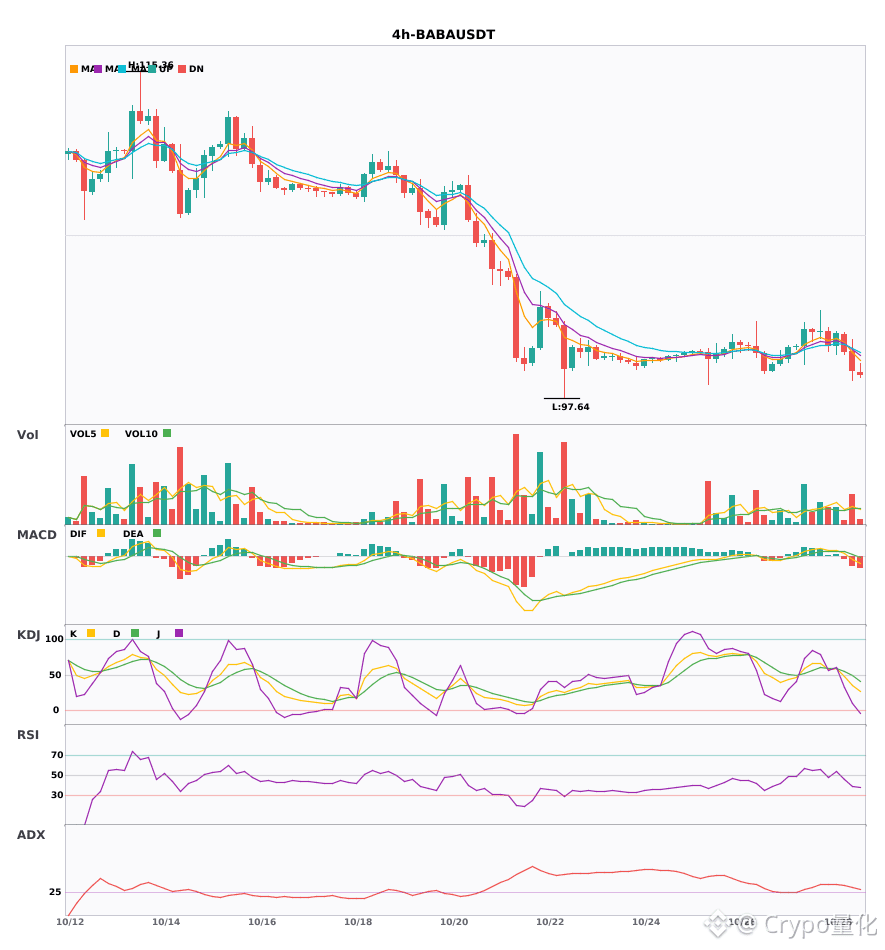
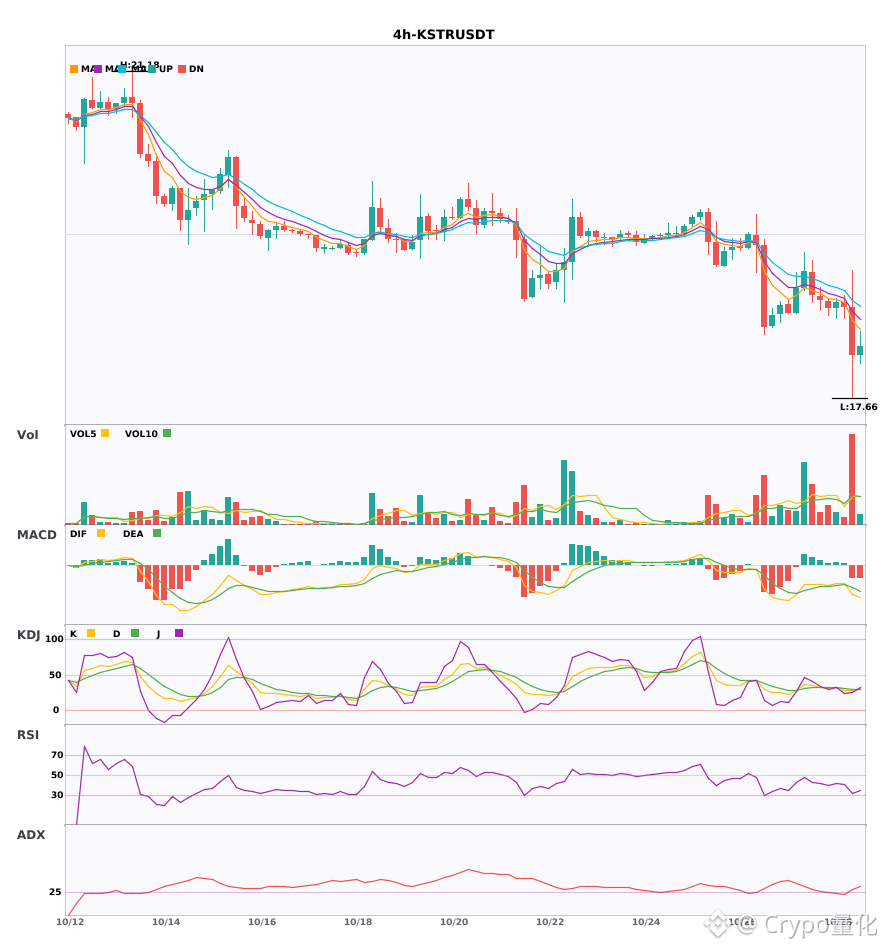
23

·
--
Today's market-watching notes: $S 24-hour high, current price 0.04783, sitting above the previous high of 0.04748.
Whenever a new high is hit, the comments section always splits into two camps: those shouting “it can still go up” and those shouting “it’s topped out.” I’m the third kind: just here to take screenshots.
Be careful of a pullback after a low-volume surge; it only counts once it holds with volume.
#S
Whenever a new high is hit, the comments section always splits into two camps: those shouting “it can still go up” and those shouting “it’s topped out.” I’m the third kind: just here to take screenshots.
Be careful of a pullback after a low-volume surge; it only counts once it holds with volume.
#S
83
·
--
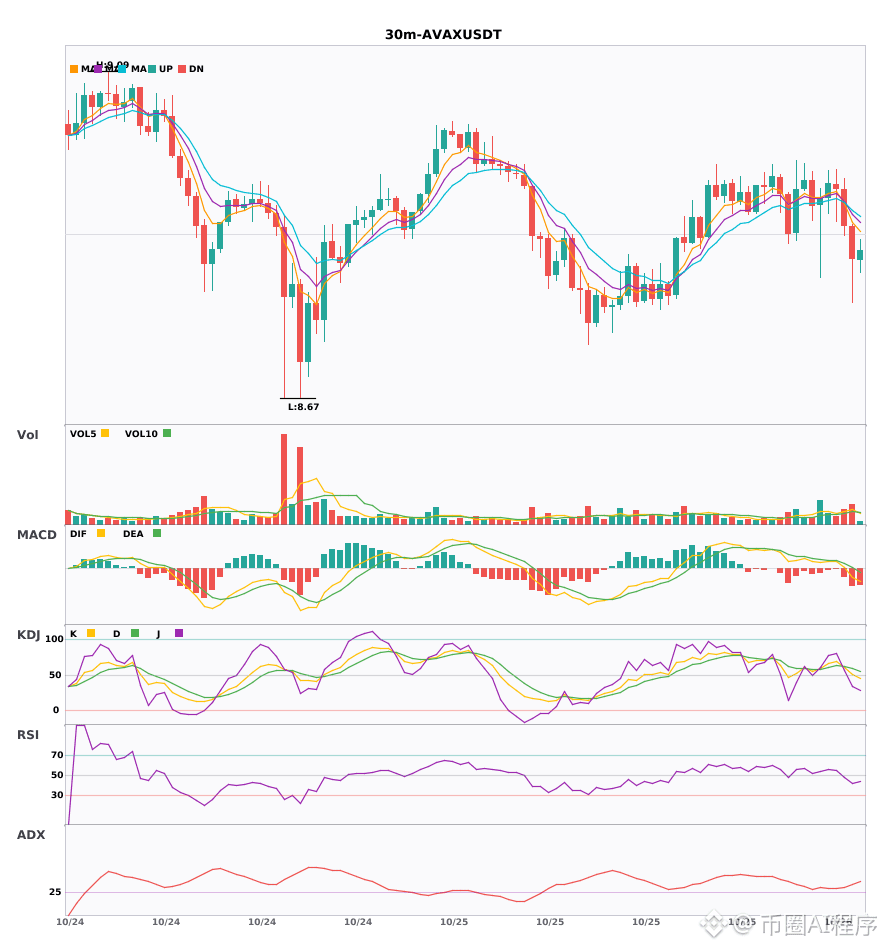
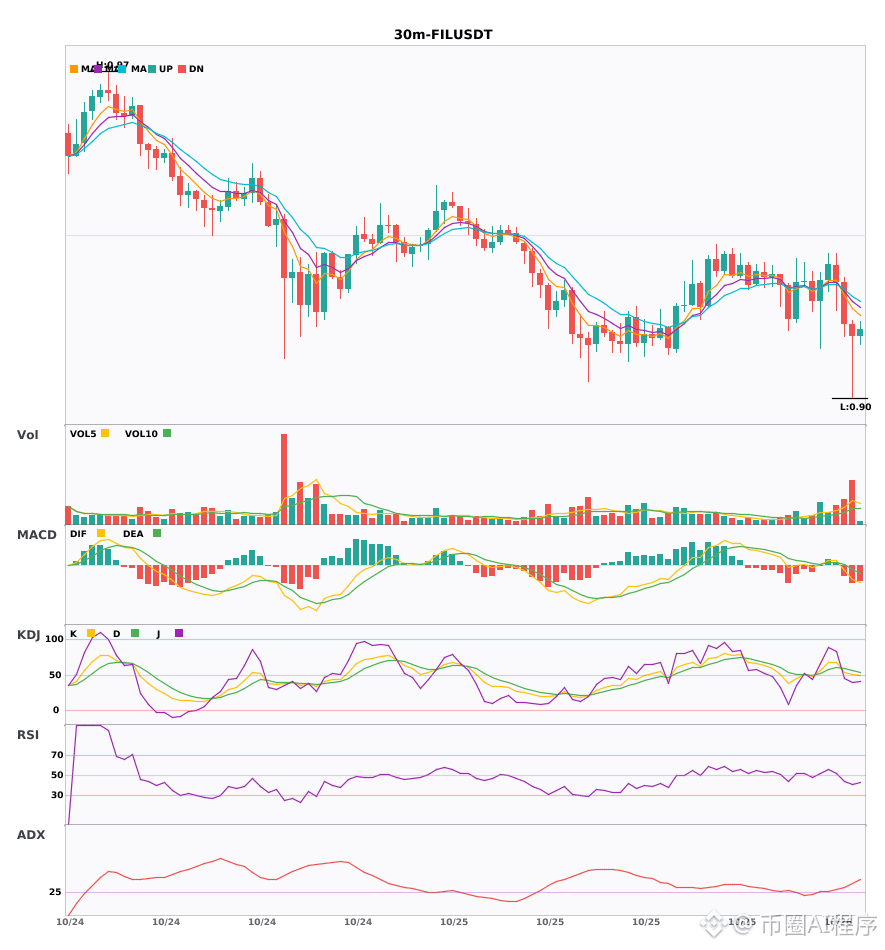
$AVAX / $FIL / $S 30-minute short signals, confirmed by the 4-hour bearish trend 🔥
════════════════════
🟢 $AVAX 30-minute short signal
⚠️Technical analysis: 4-hour bearish confluence confirmed | 30-minute entry: MACD DIF breaks below the zero line, trend turns bearish | EMA5 < EMA8 < EMA13, bearish alignment | KDJ showing strength, bulls in control (K: 50.3, D: 58.5) | Volume increased (1.5x)
════════════════════
🟢 $FIL 30-minute short signal
⚠️Technical analysis: 4-hour bearish confluence confirmed | 30-minute entry: MACD death cross below zero, bearish momentum accelerating | EMA5 crosses below EMA8, short-term outlook turns bearish | KDJ death cross, short-term bearish outlook (K: 54.0, D: 58.6) | Volume increased (2.0x)
📢Market update: Binance Will Support the Filecoin (FIL) Network Upgrade & Hard Fork - 2026-10-19
════════════════════
🟢 $S 30-minute short signal
⚠️Technical analysis: 4-hour bearish confluence confirmed | 30-minute entry: EMA5 crosses below EMA8, short-term outlook turns bearish | KDJ showing strength, bulls in control (K: 61.9, D: 52.9) | Volume normal (1.4x)
════════════════════
🔔 Follow for first-hand market updates 🔔
#多周期共振 #AVAX #FIL #S
📌 When trading, pay attention to whether the candlestick pattern matches
════════════════════
🟢 $AVAX 30-minute short signal
⚠️Technical analysis: 4-hour bearish confluence confirmed | 30-minute entry: MACD DIF breaks below the zero line, trend turns bearish | EMA5 < EMA8 < EMA13, bearish alignment | KDJ showing strength, bulls in control (K: 50.3, D: 58.5) | Volume increased (1.5x)
════════════════════
🟢 $FIL 30-minute short signal
⚠️Technical analysis: 4-hour bearish confluence confirmed | 30-minute entry: MACD death cross below zero, bearish momentum accelerating | EMA5 crosses below EMA8, short-term outlook turns bearish | KDJ death cross, short-term bearish outlook (K: 54.0, D: 58.6) | Volume increased (2.0x)
📢Market update: Binance Will Support the Filecoin (FIL) Network Upgrade & Hard Fork - 2026-10-19
════════════════════
🟢 $S 30-minute short signal
⚠️Technical analysis: 4-hour bearish confluence confirmed | 30-minute entry: EMA5 crosses below EMA8, short-term outlook turns bearish | KDJ showing strength, bulls in control (K: 61.9, D: 52.9) | Volume normal (1.4x)
════════════════════
🔔 Follow for first-hand market updates 🔔
#多周期共振 #AVAX #FIL #S
📌 When trading, pay attention to whether the candlestick pattern matches
29

·
--
🚨 $S CRACKING UNDER SELLER PRESSURE AS DOWNSIDE LIQUIDITY DRAWS PRICE LOWER! 📉
Entry: 0.02824 - 0.0283 ⚡
Target: 0.02798 🎯
Stop Loss: 0.02844 ⚠️
Sellers are relentlessly pushing $S against critical structural support, showing zero sign of buyer defense as distribution speeds up. 📉 A clean sustained move under 0.02685 accelerates this short setup directly into lower liquidity pockets.
Market structure remains heavily tilted to the downside while price stays capped under resistance, with any push above 0.03028 invalidating the bear momentum. 🔍
💬 Are you positioning for the breakdown continuation or watching for a fakeout sweep? 👇
⚠️ Not financial advice. Always manage your risk. 🛡️
🏷️ #S #ShortSetup #Crypto #Breakdown #Trading
📉 🐻
31

·
--
Is $S at $0.0483 setting up a reversal, or is this just the next leg lower? 👀
Down 5.62% today, with the last 4h window off 5.3%. RSI is sitting at 31, but volume is only 0.0x its 20d average. That’s not capitulation. That’s nobody stepping in.
Shorts are paying -0.005% funding.
Still chopping.
Unlike $XRP, $S has no real momentum bid here. At $0.05, I’d wait for a clean reclaim before taking the chart seriously. Until then, this looks like dead volume and weak structure, not a bottom. ⚠️
#S #Altcoin #Binance
Is $S at $0.0483 setting up a reversal, or is this just the next leg lower? 👀
Down 5.62% today, with the last 4h window off 5.3%. RSI is sitting at 31, but volume is only 0.0x its 20d average. That’s not capitulation. That’s nobody stepping in.
Shorts are paying -0.005% funding.
Still chopping.
Unlike $XRP , $S has no real momentum bid here. At $0.05, I’d wait for a clean reclaim before taking the chart seriously. Until then, this looks like dead volume and weak structure, not a bottom. ⚠️
#S #Altcoin #Binance
75

·
--
Defend your capital first. $S trades at $0.04798 within a $0.04696–$0.05143 daily range.
Watch the $0.0465 defense floor; a break invalidates short-term setups. Resistance sits near $0.0515.
**Risk Tip:** Never enter all-in. Use a 3-tranche DCA plan (e.g., 30%-30%-40%) across calculated pullbacks and set a strict stop-loss below support. Define your max risk per trade before clicking buy.
Education only, not financial advice.
$S #BinanceSquare #CryptoTrading #RiskManagement #S
142

$S is trading near a pressure area where weak bounces often get sold quickly.
$S is stuck below resistance, and that keeps sellers slightly in control.
Setup SHORT $S (max 10x)
🎯 Entry: 0.051 - 0.05161
🛑 SL: 0.0523
✅ TP1: 0.05049
✅ TP2: 0.04977
✅ TP3: 0.04906
• emerald-exchange 2.3.4
• Etsy is cracking down on AI slop listings
Would you fade the bounce on $S, or wait for the breakdown?
Trade $S here 👇
#S #MarketStructure #TradingSetup
$S is trading near a pressure area where weak bounces often get sold quickly.
$S is stuck below resistance, and that keeps sellers slightly in control.
Setup SHORT $S (max 10x)
🎯 Entry: 0.051 - 0.05161
🛑 SL: 0.0523
✅ TP1: 0.05049
✅ TP2: 0.04977
✅ TP3: 0.04906
• emerald-exchange 2.3.4
• Etsy is cracking down on AI slop listings
Would you fade the bounce on $S , or wait for the breakdown?
Trade $S here 👇
#S #MarketStructure #TradingSetup
83
·
--
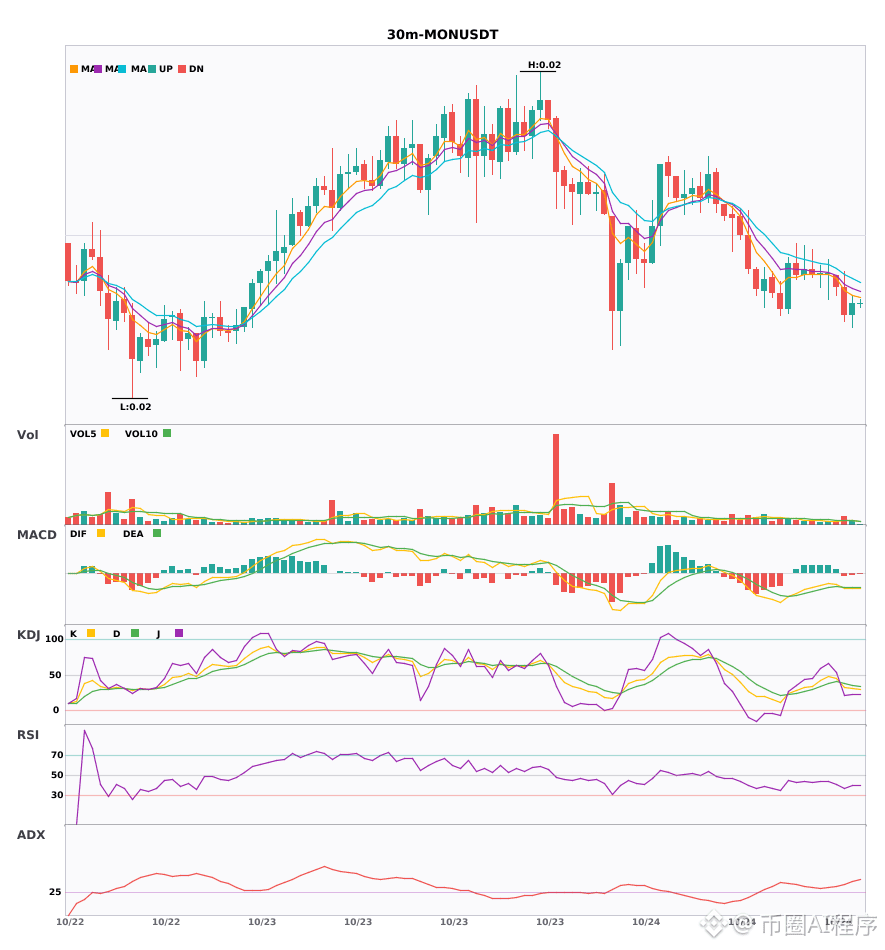
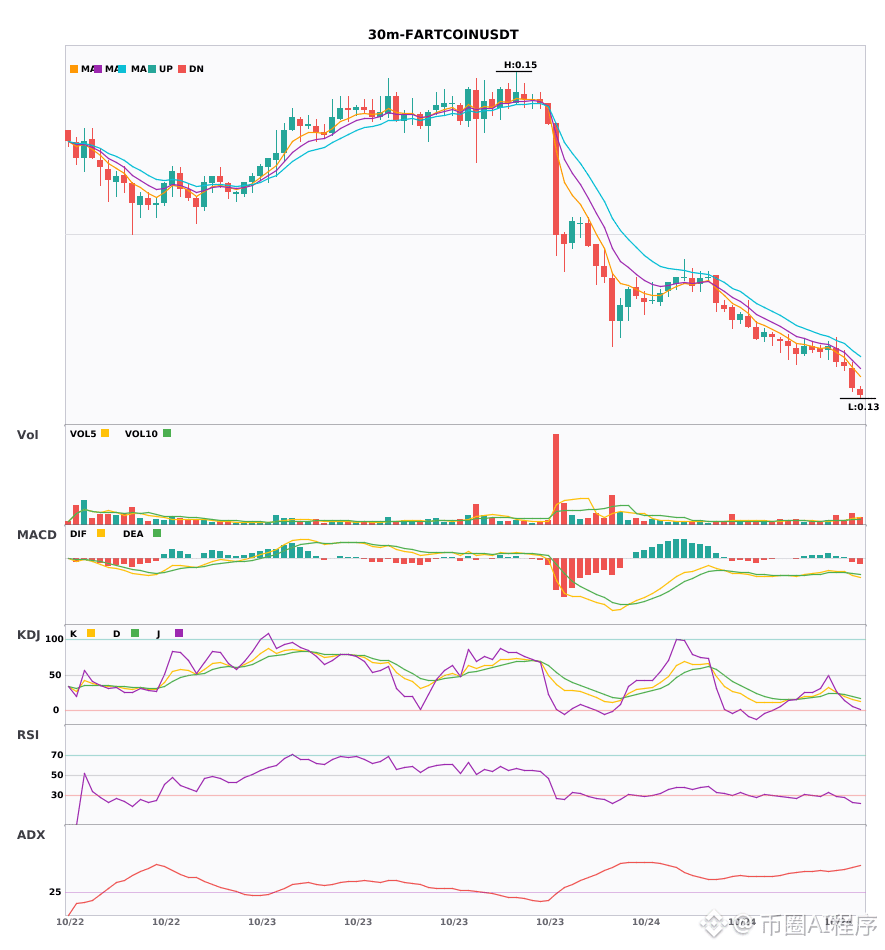
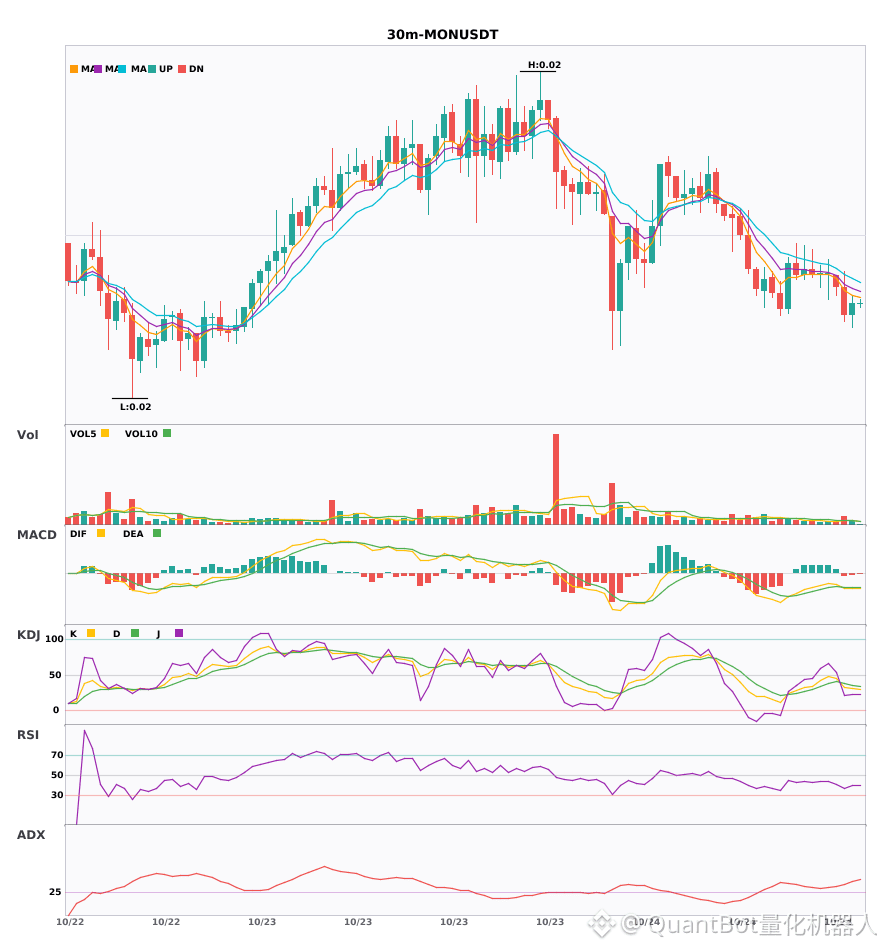
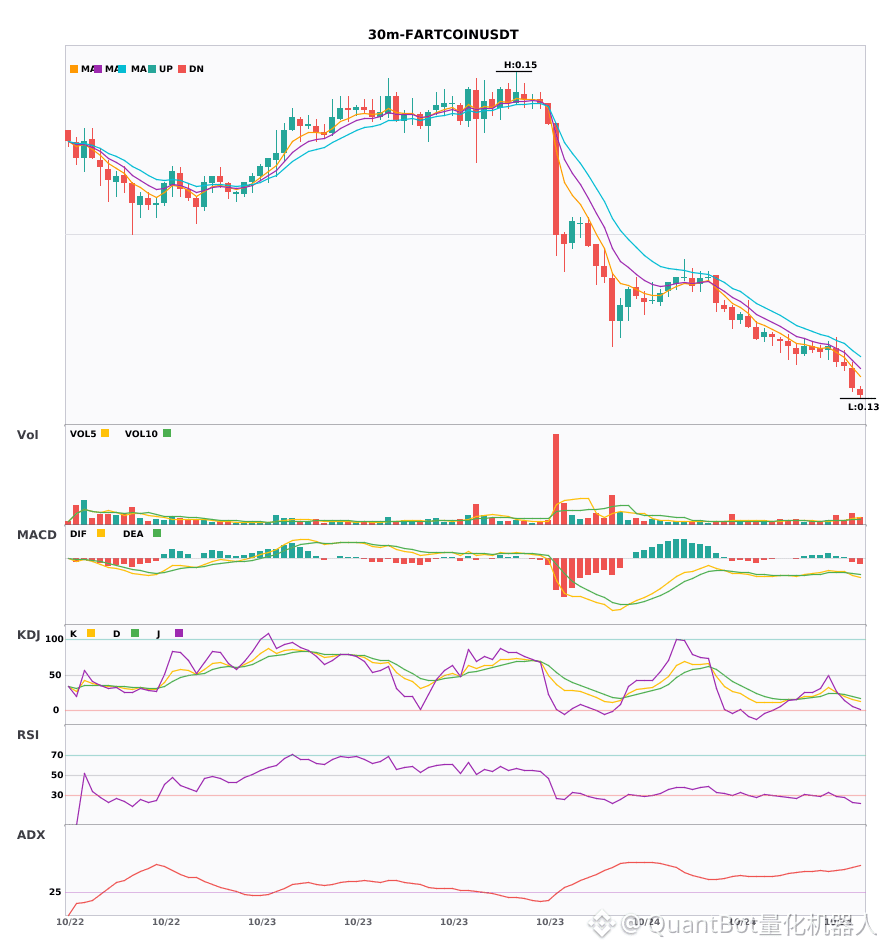
Multi-timeframe confluence: $MON / $FARTCOIN / $S weakening on the 30-minute chart; 4-hour bearish trend confirmed 🔥
════════════════════
🟢 $MON — 30-minute bearish signal
⚠️Technical analysis: 4-hour bearish confluence confirmed | 30-minute entry: MACD bearish cross below zero, bearish momentum accelerating | EMA5 < EMA8 < EMA13, bearish alignment | KDJ bearish cross, short-term outlook bearish (K=32.4, D=37.8) | Volume increased (1.9x)
════════════════════
🟢 $FARTCOIN — 30-minute bearish signal
⚠️Technical analysis: 4-hour bearish confluence confirmed | 30-minute entry: MACD bearish cross below zero, bearish momentum accelerating | EMA5 < EMA8 < EMA13, bearish alignment | KDJ trending weakly, bears in control (K=15.4, D=20.4) | Volume increased (2.1x)
════════════════════
🟢 $S — 30-minute bearish signal
⚠️Technical analysis: 4-hour bearish confluence confirmed | 30-minute entry: MACD bearish cross below zero, bearish momentum accelerating | EMA5 < EMA8 < EMA13, bearish alignment | KDJ trending weakly, bears in control (K=25.4, D=32.9) | Volume increased (2.1x)
════════════════════
🔔 Follow for first-hand market alerts 🔔
#多周期共振 #MON #FARTCOIN #S
📌 When trading, pay attention to whether the candlestick pattern meets the criteria.
════════════════════
🟢 $MON — 30-minute bearish signal
⚠️Technical analysis: 4-hour bearish confluence confirmed | 30-minute entry: MACD bearish cross below zero, bearish momentum accelerating | EMA5 < EMA8 < EMA13, bearish alignment | KDJ bearish cross, short-term outlook bearish (K=32.4, D=37.8) | Volume increased (1.9x)
════════════════════
🟢 $FARTCOIN — 30-minute bearish signal
⚠️Technical analysis: 4-hour bearish confluence confirmed | 30-minute entry: MACD bearish cross below zero, bearish momentum accelerating | EMA5 < EMA8 < EMA13, bearish alignment | KDJ trending weakly, bears in control (K=15.4, D=20.4) | Volume increased (2.1x)
════════════════════
🟢 $S — 30-minute bearish signal
⚠️Technical analysis: 4-hour bearish confluence confirmed | 30-minute entry: MACD bearish cross below zero, bearish momentum accelerating | EMA5 < EMA8 < EMA13, bearish alignment | KDJ trending weakly, bears in control (K=25.4, D=32.9) | Volume increased (2.1x)
════════════════════
🔔 Follow for first-hand market alerts 🔔
#多周期共振 #MON #FARTCOIN #S
📌 When trading, pay attention to whether the candlestick pattern meets the criteria.
10

$MON / $FARTCOIN / $S 30-minute timeframe: bearish, under short-term pressure
📉 $MON | 30-minute bearish signal
━━━━━━━━━━━━━━━━━━
Technical analysis: ADX(36) indicates a clear trending market | MACD bearish crossover below zero, bearish momentum accelerating | EMA5 < EMA8 < EMA13, bearish alignment | KDJ bearish crossover, short-term outlook bearish (K: 32.4, D: 37.8) | Volume increased (1.9x)
Price change: -0.6600%
📉 $FARTCOIN | 30-minute bearish signal
━━━━━━━━━━━━━━━━━━
Technical analysis: ADX(54) indicates a very strong trend (watch for an overheated pullback) | MACD bearish crossover below zero, bearish momentum accelerating | EMA5 < EMA8 < EMA13, bearish alignment | KDJ trending weakly, bears in control (K: 15.4, D: 20.4) | Volume increased (2.1x)
Price change: -0.9100%
📉 $S | 30-minute bearish signal
━━━━━━━━━━━━━━━━━━
Technical analysis: ADX(27) indicates a trend is forming and may be actionable | MACD bearish crossover below zero, bearish momentum accelerating | EMA5 < EMA8 < EMA13, bearish alignment | KDJ trending weakly, bears in control (K: 25.4, D: 32.9) | Volume increased (2.1x)
Price change: -0.7500%
━━━━━━━━━━━━━━━━━━
#技术分析 #MON #FARTCOIN #S
📌 The above is for reference only and does not constitute investment advice
6
Log in to explore more content
Join global crypto users on Binance Square
⚡️ Get latest and useful information about crypto.
💬 Trusted by the world’s largest crypto exchange.
👍 Discover real insights from verified creators.
Email / Phone number
Trending Topics
1
#BinanceToResumePhaseOneOfWithdrawals
4,354 views
231 Discussing
2
#BinanceHadAlreadyCovered$6BofHackLoss
1,248 views
43 Discussing
3
#FBIConfirmsNorthKoreaIsResponsibleForBinanceCryptoHack
7,556 views
54 Discussing
4
#BinanceSAFUFundTransferCompleted7499BTC
71,399 views
1,249 Discussing
5
#CZDismissesClaimsBinanceHackWasPredicted
761 views
51 Discussing
6
#BinanceRecovery90% of stolen assets
197,534 views
219 Discussing
7
#YiHe:ProofOfReserves:10TokensAt100%Backing
178,335 views
1,068 Discussing
8
#BackedNotBroken:RichardTengSaysUsersBearNoLoss
62,133 views
657 Discussing
9
#B14gReportsUnauthorizedTransferOfAbout97MCORE
3,709 views
115 Discussing
10
#USSpotETHETFsPost23StraightDaysOfNetOutflows
4,547 views
113 Discussing