
#soxlb
soxlb
58,231 views
2,082 Discussing
Hot
Latest


$SOXLB: Analyzing Hourly Variance on the Watchlist
When $SOXLB moves in an upward hourly direction while volume remains above its baseline, it highlights a specific moment of high activity. This visibility puts the asset on a watchlist, but a leaderboard rank is not a total market summary. To understand how price holds, we look at different hourly behaviors on the same venue. For instance, $ETH shows a downward hourly direction with volume above its baseline. Meanwhile, $HOT also moves downward, yet its volume is not above its baseline. These differing hourly results show that activity levels and price direction vary even among listed peers.
One mechanism to consider is how volume supports a move. When volume is above the baseline, it implies that the current hourly candle is backed by more trading interest than usual. However, a shared direction between assets during one hour does not prove they are moving because of a common cause. It is simply an observation of timing. This comparison cannot establish measured correlation or capital rotation. To reassess this interpretation, monitor if the $SOXLB price stays above the 46.4541 or if the 55.6777 of 55.6777 signals a change in momentum. Watching whether high volume continues during a pullback helps distinguish a brief spike from a steady trend.
Probabilistic market research, not a recommendation or guaranteed return.
The comparison to keep in mind: $ETH has hourly direction down and volume above its baseline; $HOT has hourly direction down and volume not above its baseline. This alone does not establish correlation.
Which matters more in this comparison: direction or how the move holds?
#SOXLB #ETH #HOT
$SOXLB : Analyzing Hourly Variance on the Watchlist
When $SOXLB moves in an upward hourly direction while volume remains above its baseline, it highlights a specific moment of high activity. This visibility puts the asset on a watchlist, but a leaderboard rank is not a total market summary. To understand how price holds, we look at different hourly behaviors on the same venue. For instance, $ETH shows a downward hourly direction with volume above its baseline. Meanwhile, $HOT also moves downward, yet its volume is not above its baseline. These differing hourly results show that activity levels and price direction vary even among listed peers.
One mechanism to consider is how volume supports a move. When volume is above the baseline, it implies that the current hourly candle is backed by more trading interest than usual. However, a shared direction between assets during one hour does not prove they are moving because of a common cause. It is simply an observation of timing. This comparison cannot establish measured correlation or capital rotation. To reassess this interpretation, monitor if the $SOXLB price stays above the 46.4541 or if the 55.6777 of 55.6777 signals a change in momentum. Watching whether high volume continues during a pullback helps distinguish a brief spike from a steady trend.
Probabilistic market research, not a recommendation or guaranteed return.
The comparison to keep in mind: $ETH has hourly direction down and volume above its baseline; $HOT has hourly direction down and volume not above its baseline. This alone does not establish correlation.
Which matters more in this comparison: direction or how the move holds?
#SOXLB #ETH #HOT
When $SOXLB moves in an upward hourly direction while volume remains above its baseline, it highlights a specific moment of high activity. This visibility puts the asset on a watchlist, but a leaderboard rank is not a total market summary. To understand how price holds, we look at different hourly behaviors on the same venue. For instance, $ETH shows a downward hourly direction with volume above its baseline. Meanwhile, $HOT also moves downward, yet its volume is not above its baseline. These differing hourly results show that activity levels and price direction vary even among listed peers.
One mechanism to consider is how volume supports a move. When volume is above the baseline, it implies that the current hourly candle is backed by more trading interest than usual. However, a shared direction between assets during one hour does not prove they are moving because of a common cause. It is simply an observation of timing. This comparison cannot establish measured correlation or capital rotation. To reassess this interpretation, monitor if the $SOXLB price stays above the 46.4541 or if the 55.6777 of 55.6777 signals a change in momentum. Watching whether high volume continues during a pullback helps distinguish a brief spike from a steady trend.
Probabilistic market research, not a recommendation or guaranteed return.
The comparison to keep in mind: $ETH has hourly direction down and volume above its baseline; $HOT has hourly direction down and volume not above its baseline. This alone does not establish correlation.
Which matters more in this comparison: direction or how the move holds?
#SOXLB #ETH #HOT
29

·
--
$SOXLB +1.31% | $ARB +1.01% | $TON +0.95%
#SOXLB nudged to $46.54, gaining +1.31% on $5.5 M volume. The modest rise suggests a small inflow of interest, though the move is still within a tight range.
#ARB slipped up to $0.1696, up +1.01% with $5.9 M changing hands. Volume is decent, hinting at some trader activity supporting the price bump.
#TON traded at $1.60, climbing +0.95% on $7.7 M volume. The higher turnover could indicate a brief rally, but it’s not yet a decisive breakout.
💡 Watch the relative volume ratios; if TON’s volume outpaces the others, it may signal a shift in short‑term momentum.
#Write2Earn #Binance
$SOXLB +1.31% | $ARB +1.01% | $TON +0.95%
#SOXLB nudged to $46.54, gaining +1.31% on $5.5 M volume. The modest rise suggests a small inflow of interest, though the move is still within a tight range.
#ARB slipped up to $0.1696, up +1.01% with $5.9 M changing hands. Volume is decent, hinting at some trader activity supporting the price bump.
#TON traded at $1.60, climbing +0.95% on $7.7 M volume. The higher turnover could indicate a brief rally, but it’s not yet a decisive breakout.
💡 Watch the relative volume ratios; if TON’s volume outpaces the others, it may signal a shift in short‑term momentum.
#Write2Earn #Binance
#SOXLB nudged to $46.54, gaining +1.31% on $5.5 M volume. The modest rise suggests a small inflow of interest, though the move is still within a tight range.
#ARB slipped up to $0.1696, up +1.01% with $5.9 M changing hands. Volume is decent, hinting at some trader activity supporting the price bump.
#TON traded at $1.60, climbing +0.95% on $7.7 M volume. The higher turnover could indicate a brief rally, but it’s not yet a decisive breakout.
💡 Watch the relative volume ratios; if TON’s volume outpaces the others, it may signal a shift in short‑term momentum.
#Write2Earn #Binance
6
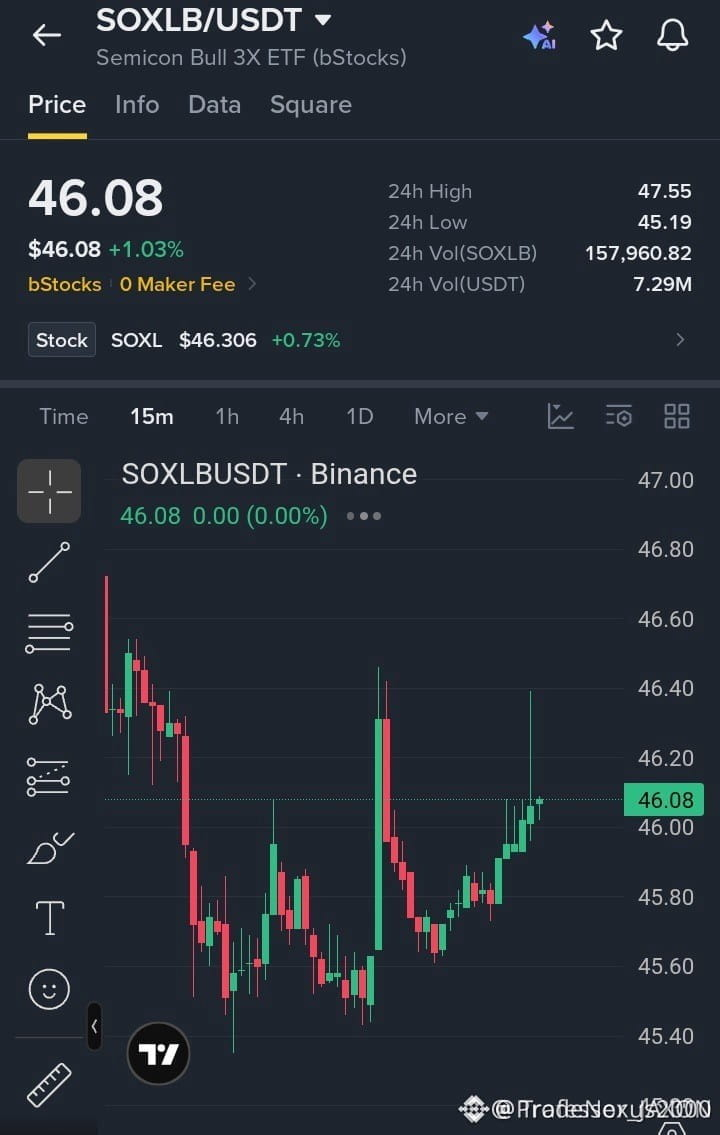
🦈 $SOXLB FORMING HIGHER LOWS AS SMART MONEY ABSORBS SUPPLY NEAR 45.50 SUPPORT! ⚡
Entry: 45.95–46.10 ⚡
Target: 46.70 🚀
Stop Loss: 45.70 ⚠️
📌 Price action on the 15-minute timeframe reveals a methodical recovery off the 45.50 demand zone, printing consecutive higher lows as institutional buyers step in.
⚡ Momentum is building toward the 46.20 structural pivot, where a clean breakout will likely trigger an impulsive expansion into higher resistance liquidity pools.
💬 Are you positioning ahead of the breakout or waiting for a retest of the range equilibrium? 👇
⚠️ Not financial advice. Always manage your risk. 🛡️
🏷️ #SOXLB #LongSetup #MarketStructure #OrderFlow
🔥 💎
🦈 $SOXLB FORMING HIGHER LOWS AS SMART MONEY ABSORBS SUPPLY NEAR 45.50 SUPPORT! ⚡
Entry: 45.95–46.10 ⚡
Target: 46.70 🚀
Stop Loss: 45.70 ⚠️
📌 Price action on the 15-minute timeframe reveals a methodical recovery off the 45.50 demand zone, printing consecutive higher lows as institutional buyers step in.
⚡ Momentum is building toward the 46.20 structural pivot, where a clean breakout will likely trigger an impulsive expansion into higher resistance liquidity pools.
💬 Are you positioning ahead of the breakout or waiting for a retest of the range equilibrium? 👇
⚠️ Not financial advice. Always manage your risk. 🛡️
🏷️ #SOXLB #LongSetup #MarketStructure #OrderFlow
🔥 💎
Entry: 45.95–46.10 ⚡
Target: 46.70 🚀
Stop Loss: 45.70 ⚠️
📌 Price action on the 15-minute timeframe reveals a methodical recovery off the 45.50 demand zone, printing consecutive higher lows as institutional buyers step in.
⚡ Momentum is building toward the 46.20 structural pivot, where a clean breakout will likely trigger an impulsive expansion into higher resistance liquidity pools.
💬 Are you positioning ahead of the breakout or waiting for a retest of the range equilibrium? 👇
⚠️ Not financial advice. Always manage your risk. 🛡️
🏷️ #SOXLB #LongSetup #MarketStructure #OrderFlow
🔥 💎
6

·
--
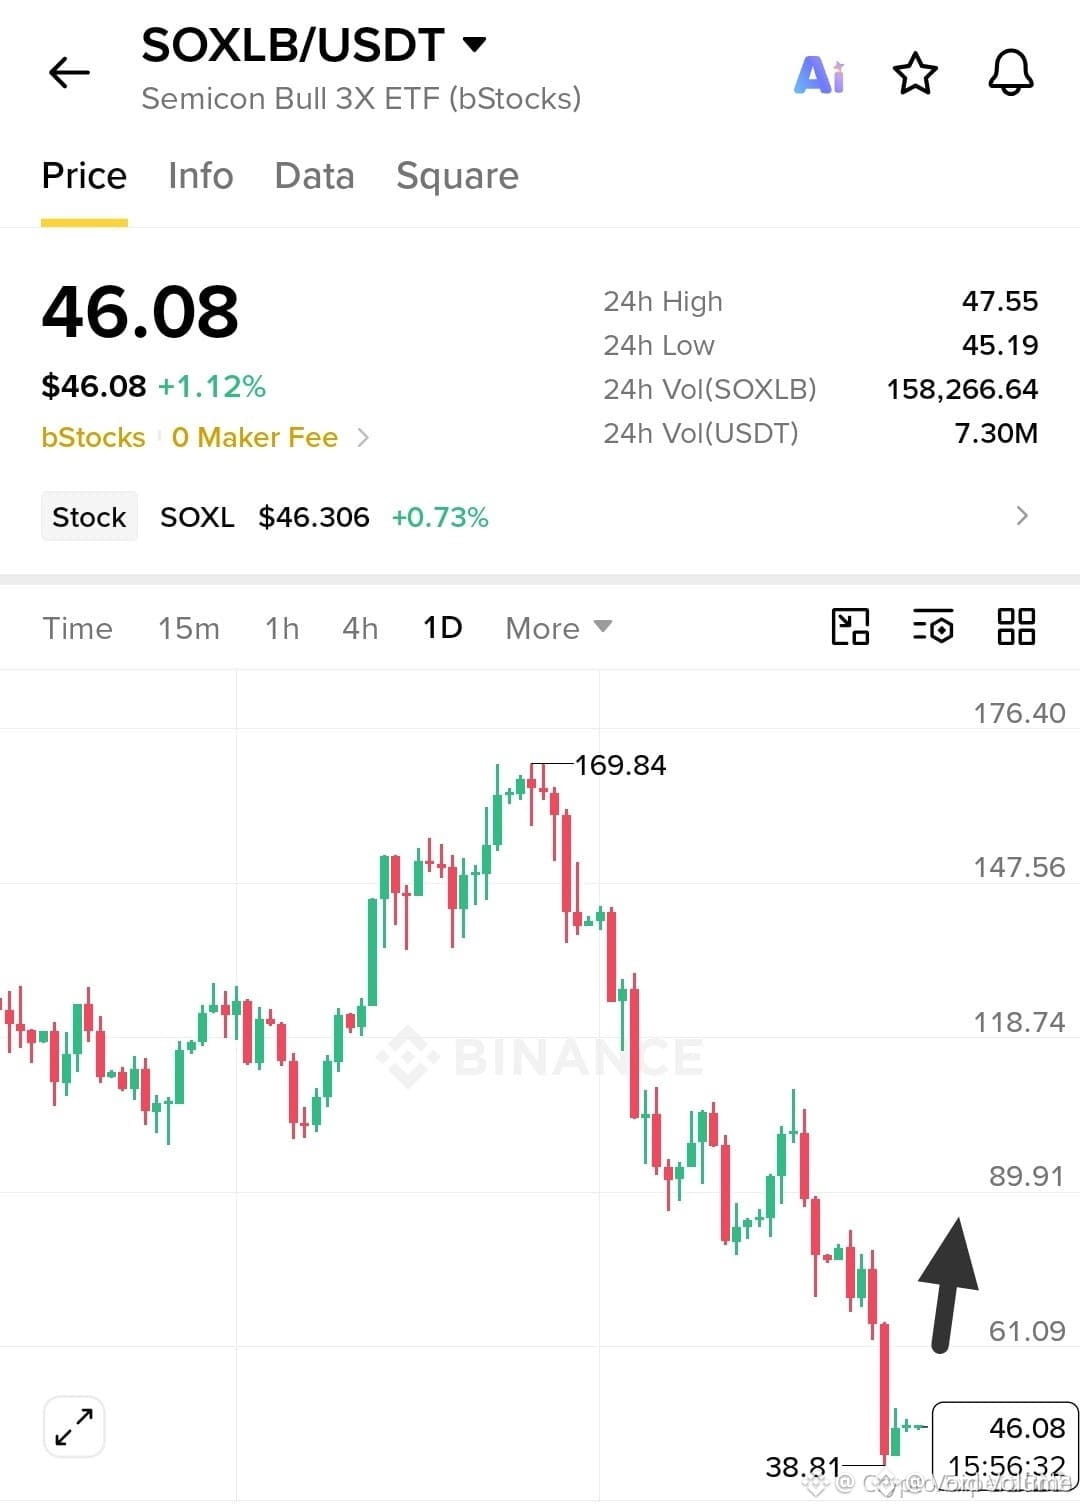
🦈 $SOXLB TESTING INSTITUTIONAL SUPPORT AWAITING A MAJOR LIQUIDITY RECOVERY SWEEP ⚡
Entry: 45.50 to 47.00 ⚡
Target: 61.00 🚀
Stop Loss: 42.50 ⚠️
Smart money is tracking the primary demand block sitting tightly between 43.00 and 45.00, absorbing local distribution. 📊 Volume profiles indicate structural exhaustion among trapped sellers as price compresses near the current accumulation range. 💡
Leveraged instruments demand strict risk management due to compounding volatility drag during consolidation phases. 🛡️ Are you positioning your entries inside the demand zone or waiting for a confirmed break above 50.00 before scaling in? 🤔
⚠️ Not financial advice. Always manage your risk. 🛡️
🏷️ #SOXLB #LongSetup #SmartMoney #Crypto
🦈 📈
🦈 $SOXLB TESTING INSTITUTIONAL SUPPORT AWAITING A MAJOR LIQUIDITY RECOVERY SWEEP ⚡
Entry: 45.50 to 47.00 ⚡
Target: 61.00 🚀
Stop Loss: 42.50 ⚠️
Smart money is tracking the primary demand block sitting tightly between 43.00 and 45.00, absorbing local distribution. 📊 Volume profiles indicate structural exhaustion among trapped sellers as price compresses near the current accumulation range. 💡
Leveraged instruments demand strict risk management due to compounding volatility drag during consolidation phases. 🛡️ Are you positioning your entries inside the demand zone or waiting for a confirmed break above 50.00 before scaling in? 🤔
⚠️ Not financial advice. Always manage your risk. 🛡️
🏷️ #SOXLB #LongSetup #SmartMoney #Crypto
🦈 📈
Entry: 45.50 to 47.00 ⚡
Target: 61.00 🚀
Stop Loss: 42.50 ⚠️
Smart money is tracking the primary demand block sitting tightly between 43.00 and 45.00, absorbing local distribution. 📊 Volume profiles indicate structural exhaustion among trapped sellers as price compresses near the current accumulation range. 💡
Leveraged instruments demand strict risk management due to compounding volatility drag during consolidation phases. 🛡️ Are you positioning your entries inside the demand zone or waiting for a confirmed break above 50.00 before scaling in? 🤔
⚠️ Not financial advice. Always manage your risk. 🛡️
🏷️ #SOXLB #LongSetup #SmartMoney #Crypto
🦈 📈
5

·
--
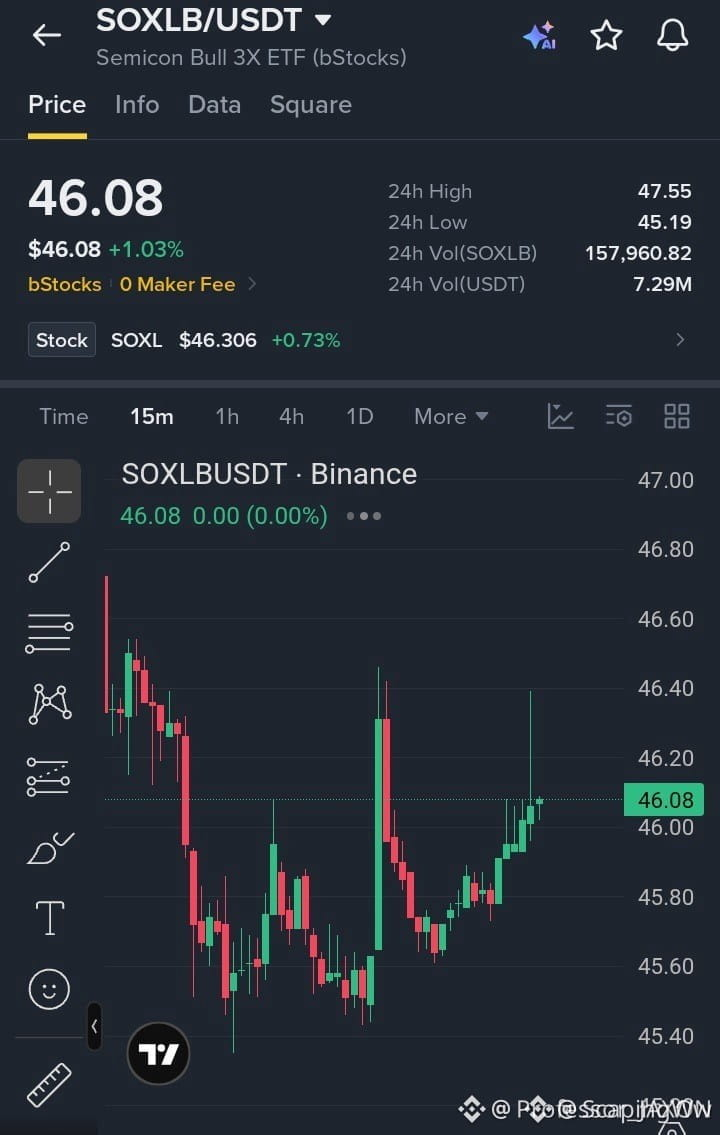
⚡ $SOXLB COILED AT SUPPORT AND READY TO IGNITE HIGHER! 🚀
Entry: 45.95–46.10 ⚡
Target: 46.30, 46.50, 46.70 🚀
Stop Loss: 45.70 ⚠️
Bulls are quietly constructing a rock-solid base above the 45.50 demand zone, printing crisp higher lows on the fifteen-minute chart. 📊 Order flow shows aggressive buyers stepping in to defend every dip while momentum builds toward that crucial 46.20 pivot. ⚡
Once that ceiling cracks open, expect rapid acceleration straight into our tiered targets as trapped shorts scramble to cover. 💡 Are you positioned ahead of the breakout or waiting for confirmation above resistance? 👇
⚠️ Not financial advice. Always manage your risk. 🛡️
🏷️ #SOXLB #LongSetup #Momentum #Breakout #Crypto
🔥 💎
⚡ $SOXLB COILED AT SUPPORT AND READY TO IGNITE HIGHER! 🚀
Entry: 45.95–46.10 ⚡
Target: 46.30, 46.50, 46.70 🚀
Stop Loss: 45.70 ⚠️
Bulls are quietly constructing a rock-solid base above the 45.50 demand zone, printing crisp higher lows on the fifteen-minute chart. 📊 Order flow shows aggressive buyers stepping in to defend every dip while momentum builds toward that crucial 46.20 pivot. ⚡
Once that ceiling cracks open, expect rapid acceleration straight into our tiered targets as trapped shorts scramble to cover. 💡 Are you positioned ahead of the breakout or waiting for confirmation above resistance? 👇
⚠️ Not financial advice. Always manage your risk. 🛡️
🏷️ #SOXLB #LongSetup #Momentum #Breakout #Crypto
🔥 💎
Entry: 45.95–46.10 ⚡
Target: 46.30, 46.50, 46.70 🚀
Stop Loss: 45.70 ⚠️
Bulls are quietly constructing a rock-solid base above the 45.50 demand zone, printing crisp higher lows on the fifteen-minute chart. 📊 Order flow shows aggressive buyers stepping in to defend every dip while momentum builds toward that crucial 46.20 pivot. ⚡
Once that ceiling cracks open, expect rapid acceleration straight into our tiered targets as trapped shorts scramble to cover. 💡 Are you positioned ahead of the breakout or waiting for confirmation above resistance? 👇
⚠️ Not financial advice. Always manage your risk. 🛡️
🏷️ #SOXLB #LongSetup #Momentum #Breakout #Crypto
🔥 💎
7

·
--
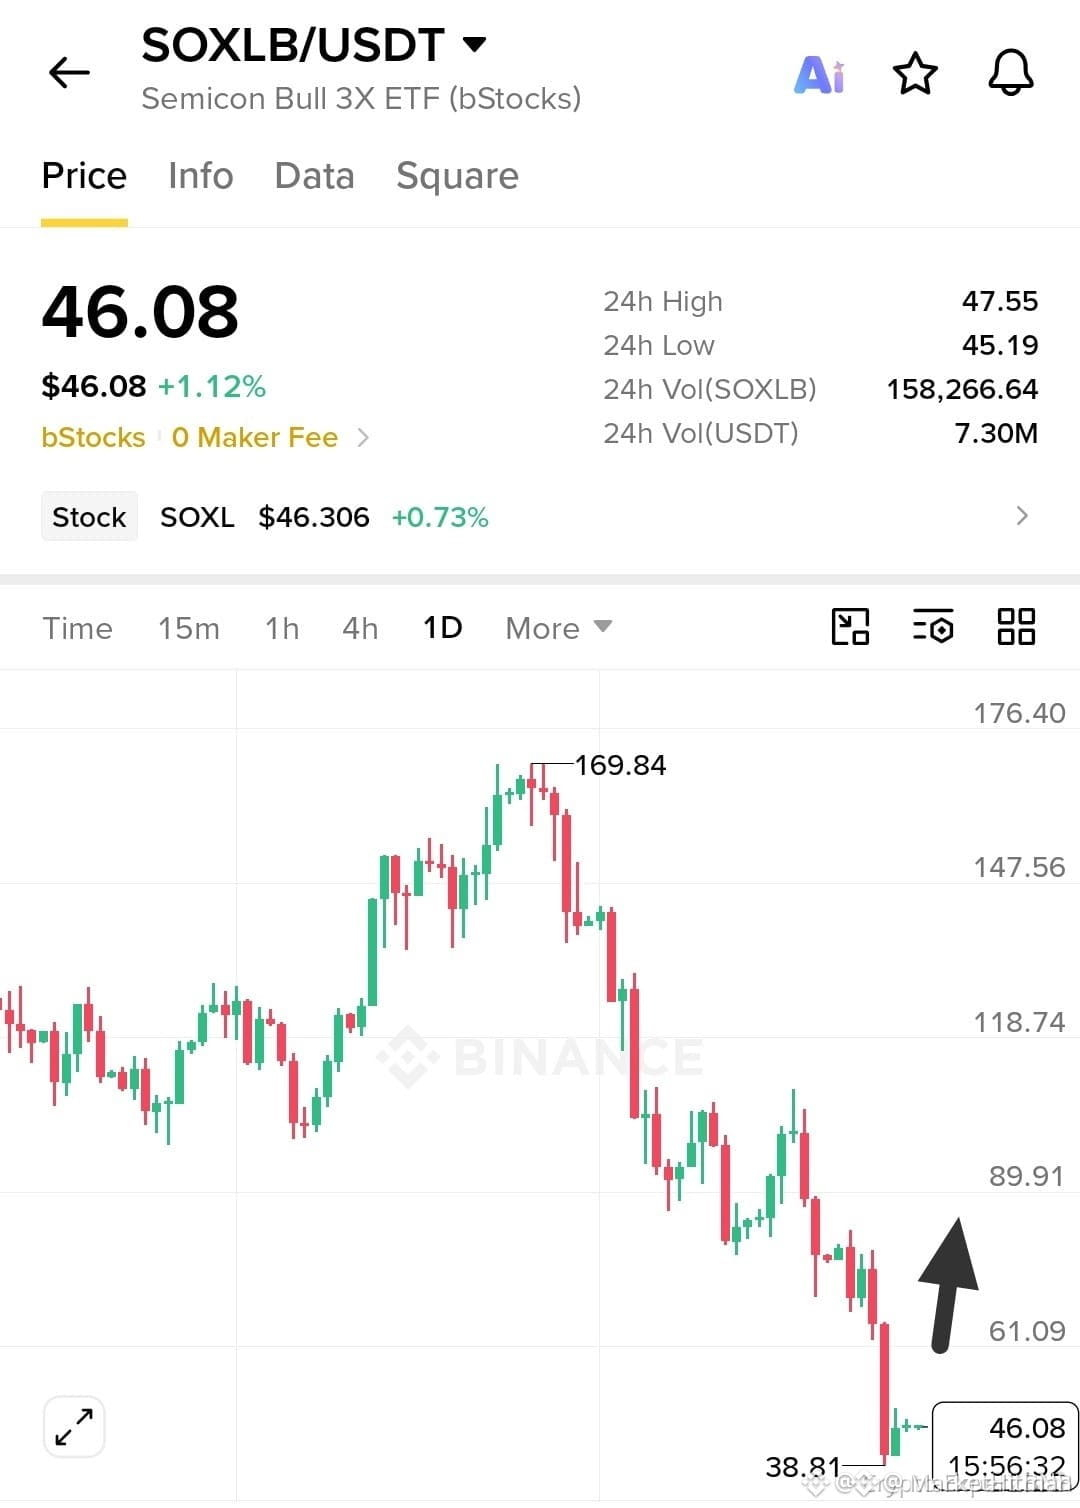
🚨 $SOXLB FORMING A PIVOT BASE AS BUYERS DEFEND THE KEY SUPPORT ZONE! 💥
Entry: $45.50–$47.00 ⚡
Target: $50.00, $55.00, $61.00 🚀
Stop Loss: $42.50 ⚠️
Bulls are stepping in around the 43 to 45 demand pocket, absorbing selling pressure to build a durable springboard. 📊 Volume profiles show steady accumulation while price action compresses right below the crucial 50 resistance line. ⚡
Keep in mind this instrument operates as a leveraged vehicle where daily compounding amplifies price swings, demanding tighter risk boundaries. 💡 Are you locking in early tranches at these levels or waiting for that confirmation breakout above 50? 👇
⚠️ Not financial advice. Always manage your risk. 🛡️
🏷️ #SOXLB #LongSetup #Trading #Breakout #Crypto
🔥 💎
🚨 $SOXLB FORMING A PIVOT BASE AS BUYERS DEFEND THE KEY SUPPORT ZONE! 💥
Entry: $45.50–$47.00 ⚡
Target: $50.00, $55.00, $61.00 🚀
Stop Loss: $42.50 ⚠️
Bulls are stepping in around the 43 to 45 demand pocket, absorbing selling pressure to build a durable springboard. 📊 Volume profiles show steady accumulation while price action compresses right below the crucial 50 resistance line. ⚡
Keep in mind this instrument operates as a leveraged vehicle where daily compounding amplifies price swings, demanding tighter risk boundaries. 💡 Are you locking in early tranches at these levels or waiting for that confirmation breakout above 50? 👇
⚠️ Not financial advice. Always manage your risk. 🛡️
🏷️ #SOXLB #LongSetup #Trading #Breakout #Crypto
🔥 💎
Entry: $45.50–$47.00 ⚡
Target: $50.00, $55.00, $61.00 🚀
Stop Loss: $42.50 ⚠️
Bulls are stepping in around the 43 to 45 demand pocket, absorbing selling pressure to build a durable springboard. 📊 Volume profiles show steady accumulation while price action compresses right below the crucial 50 resistance line. ⚡
Keep in mind this instrument operates as a leveraged vehicle where daily compounding amplifies price swings, demanding tighter risk boundaries. 💡 Are you locking in early tranches at these levels or waiting for that confirmation breakout above 50? 👇
⚠️ Not financial advice. Always manage your risk. 🛡️
🏷️ #SOXLB #LongSetup #Trading #Breakout #Crypto
🔥 💎
6
·
--
$SOXLB +0.66% | $COTI +0.53% | $POLY +0.52%
#SOXLB nudged to $45.97, up +0.66% on $8.9 M of volume. The modest gain suggests a steady interest without a sharp surge.
#COTI ticked higher at $0.00951000, climbing +0.53% with $1.2 M traded. Its low‑price move may attract small‑scale buyers.
#POLY rose to $0.2696, up +0.52% on $1.5 M volume. The consistent uptick hints at a mild bullish sentiment.
📊 Watching the combined $11.6 M volume could reveal whether these small gains gain traction or fade.
#Write2Earn #Binance
$SOXLB +0.66% | $COTI +0.53% | $POLY +0.52%
#SOXLB nudged to $45.97, up +0.66% on $8.9 M of volume. The modest gain suggests a steady interest without a sharp surge.
#COTI ticked higher at $0.00951000, climbing +0.53% with $1.2 M traded. Its low‑price move may attract small‑scale buyers.
#POLY rose to $0.2696, up +0.52% on $1.5 M volume. The consistent uptick hints at a mild bullish sentiment.
📊 Watching the combined $11.6 M volume could reveal whether these small gains gain traction or fade.
#Write2Earn #Binance
#SOXLB nudged to $45.97, up +0.66% on $8.9 M of volume. The modest gain suggests a steady interest without a sharp surge.
#COTI ticked higher at $0.00951000, climbing +0.53% with $1.2 M traded. Its low‑price move may attract small‑scale buyers.
#POLY rose to $0.2696, up +0.52% on $1.5 M volume. The consistent uptick hints at a mild bullish sentiment.
📊 Watching the combined $11.6 M volume could reveal whether these small gains gain traction or fade.
#Write2Earn #Binance
1

·
--
$OPEN +4.15% | $NIGHT +3.53% | $SOXLB +3.51%
OpenLedger rose to $0.0903, up +4.15% on about $1.0 M of volume. Its AI‑driven liquidity story may be attracting fresh interest.
#NIGHT climbed to $0.0405, gaining +3.53% with $1.3 M changing hands. The modest rise suggests steady buying despite its low price.
#SOXLB traded at $46.62, up +3.51% on a solid $11.7 M volume. The broader market move could be lifting this index‑linked token.
👀 Watch if the $1 M‑plus volumes for #OPEN and NIGHT can hold as the day’s broader risk appetite shifts.
#Write2Earn #Binance
$OPEN +4.15% | $NIGHT +3.53% | $SOXLB +3.51%
OpenLedger rose to $0.0903, up +4.15% on about $1.0 M of volume. Its AI‑driven liquidity story may be attracting fresh interest.
#NIGHT climbed to $0.0405, gaining +3.53% with $1.3 M changing hands. The modest rise suggests steady buying despite its low price.
#SOXLB traded at $46.62, up +3.51% on a solid $11.7 M volume. The broader market move could be lifting this index‑linked token.
👀 Watch if the $1 M‑plus volumes for #OPEN and NIGHT can hold as the day’s broader risk appetite shifts.
#Write2Earn #Binance
OpenLedger rose to $0.0903, up +4.15% on about $1.0 M of volume. Its AI‑driven liquidity story may be attracting fresh interest.
#NIGHT climbed to $0.0405, gaining +3.53% with $1.3 M changing hands. The modest rise suggests steady buying despite its low price.
#SOXLB traded at $46.62, up +3.51% on a solid $11.7 M volume. The broader market move could be lifting this index‑linked token.
👀 Watch if the $1 M‑plus volumes for #OPEN and NIGHT can hold as the day’s broader risk appetite shifts.
#Write2Earn #Binance
7

·
--
Low volume often precedes a sharp move in $SOXLB prices.
With $13.45M in 24h volume and a slight pullback to $45.50, liquidity remains thin compared to the recent hourly average. The asset is currently consolidating within the 43.49 to 47.55 range.
A reclaim of 47.55 would suggest renewed momentum, while a sustained drop below 43.49 shifts the narrative toward further distribution.
Would you prioritize a breakout above 47.55 or wait for potential stability if the 43.49 floor is tested?
Tap $SOXLB for the live chart. #SOXLB #BinanceSquare
Low volume often precedes a sharp move in $SOXLB prices.
With $13.45M in 24h volume and a slight pullback to $45.50, liquidity remains thin compared to the recent hourly average. The asset is currently consolidating within the 43.49 to 47.55 range.
A reclaim of 47.55 would suggest renewed momentum, while a sustained drop below 43.49 shifts the narrative toward further distribution.
Would you prioritize a breakout above 47.55 or wait for potential stability if the 43.49 floor is tested?
Tap $SOXLB for the live chart. #SOXLB #BinanceSquare
With $13.45M in 24h volume and a slight pullback to $45.50, liquidity remains thin compared to the recent hourly average. The asset is currently consolidating within the 43.49 to 47.55 range.
A reclaim of 47.55 would suggest renewed momentum, while a sustained drop below 43.49 shifts the narrative toward further distribution.
Would you prioritize a breakout above 47.55 or wait for potential stability if the 43.49 floor is tested?
Tap $SOXLB for the live chart. #SOXLB #BinanceSquare
3

·
--
Volume dried up to 0.11x the daily average as $SOXLB eased to $45.44.
Total 24-hour turnover sits at $19.97M alongside a 2.15% daily decline. This quiet participation keeps price action range-bound within the recent 43.49 to 48.41 extreme boundaries.
A bullish continuation scenario requires a volume-backed reclaim pushing past the 48.41 high. Conversely, failure to sustain liquidity risks a slide back toward the 43.49 low.
Will a breakout above 48.41 confirm new buyers, or does slipping under 43.49 invalidate the setup?
Tap $SOXLB for the live chart. #SOXLB #BinanceSquare
Volume dried up to 0.11x the daily average as $SOXLB eased to $45.44.
Total 24-hour turnover sits at $19.97M alongside a 2.15% daily decline. This quiet participation keeps price action range-bound within the recent 43.49 to 48.41 extreme boundaries.
A bullish continuation scenario requires a volume-backed reclaim pushing past the 48.41 high. Conversely, failure to sustain liquidity risks a slide back toward the 43.49 low.
Will a breakout above 48.41 confirm new buyers, or does slipping under 43.49 invalidate the setup?
Tap $SOXLB for the live chart. #SOXLB #BinanceSquare
Total 24-hour turnover sits at $19.97M alongside a 2.15% daily decline. This quiet participation keeps price action range-bound within the recent 43.49 to 48.41 extreme boundaries.
A bullish continuation scenario requires a volume-backed reclaim pushing past the 48.41 high. Conversely, failure to sustain liquidity risks a slide back toward the 43.49 low.
Will a breakout above 48.41 confirm new buyers, or does slipping under 43.49 invalidate the setup?
Tap $SOXLB for the live chart. #SOXLB #BinanceSquare
48
$SOXLB: Choosing Rules Over Regret
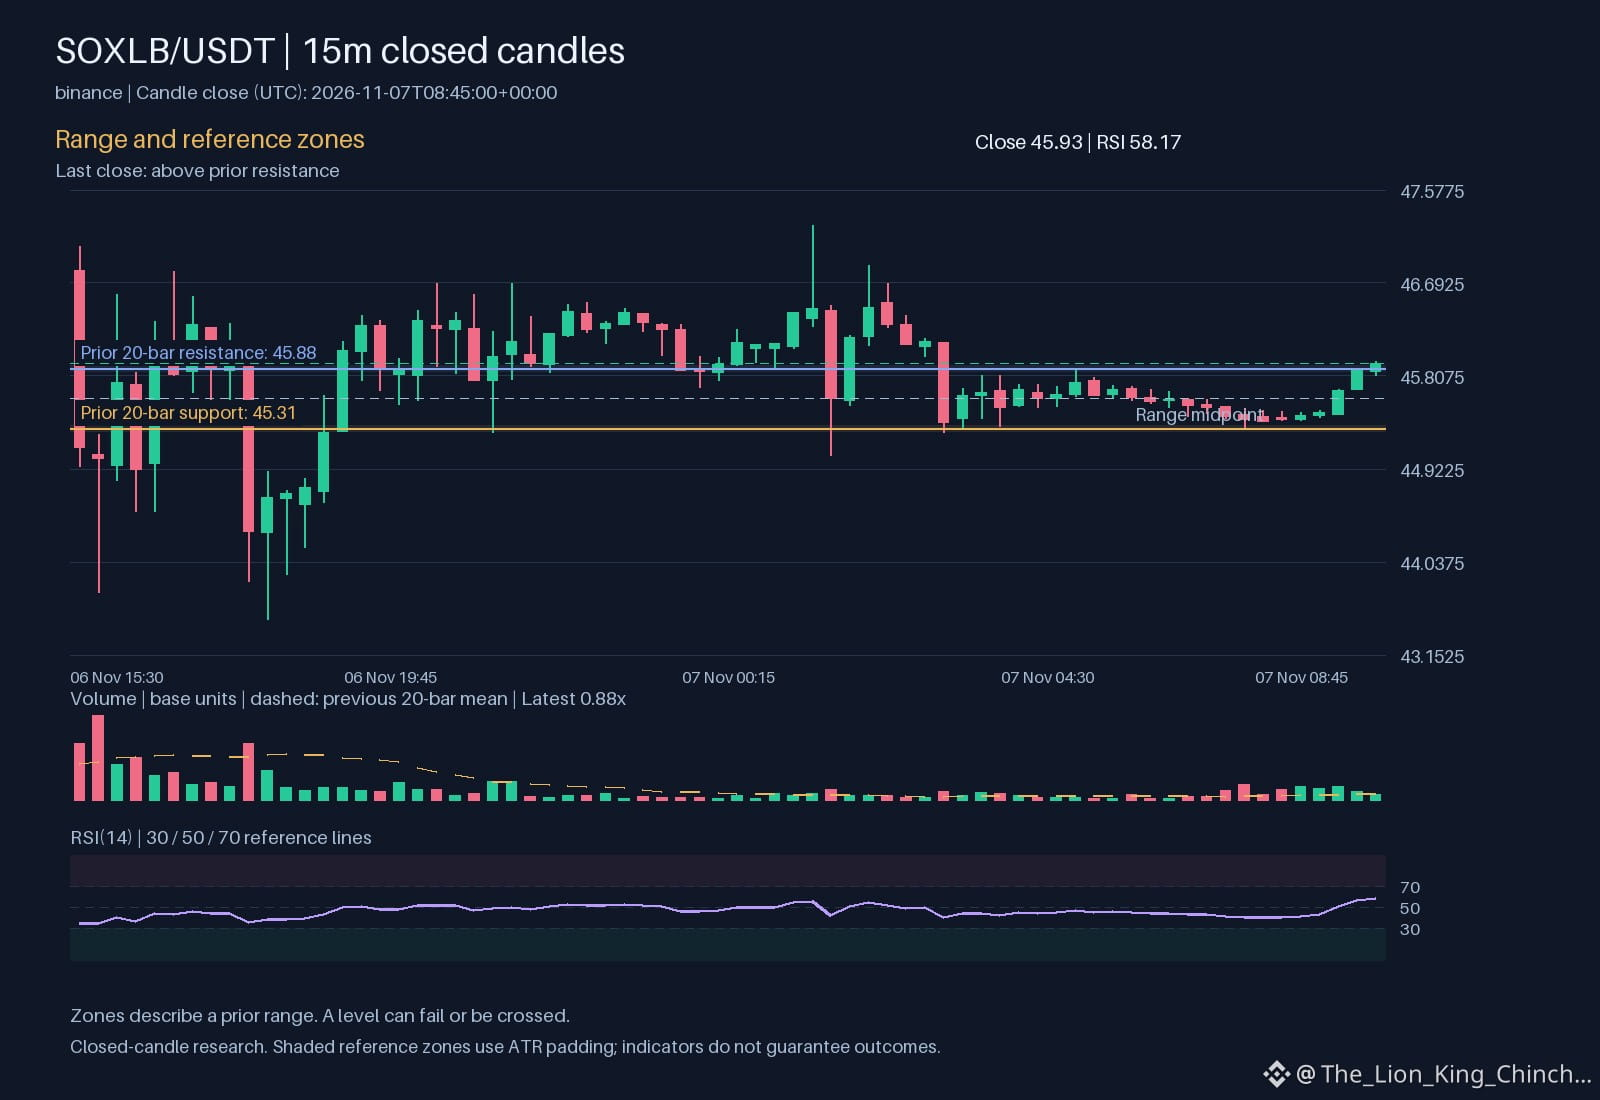
Anchoring keeps your attention fixed on a specific price level. You might feel stuck at 45.88 because earlier charts printed there. This mental shortcut helps you compare new data quickly, but it can block objective analysis.
The current observation shows $SOXLB trading above resistance. The hourly direction is up, yet volume is not above baseline. Such a combination often creates uncertainty. Traders may wonder if the move will hold without strong buying pressure. If you missed the initial break, you might feel pressure to chase the entry. That reaction stems from the fear of missing out against the anchored level. You may double down on a rule just to feel certain, rather than reassessing the context.
This is a thought experiment, not a statement of actual trader motives. Many participants simply execute their system without emotional attachment. The risk lies in modifying your strategy mid-session because you missed the first move. Instead, treat the missed entry as data. Ask if your original entry criteria were still valid. If the volume lacks conviction, the break might be weak regardless of your feelings.
A practical self-check involves writing down your entry rule before the move happens. When price moves, check if the rule was met. If you missed it, do not alter the standard for the next signal. Keep your criteria consistent. This reduces the impact of regret on future decisions. Use 58.1743 to gauge momentum strength, but do not let it override your predefined rules. Sticking to a plan ensures your analysis remains neutral. The goal is to trade the current data, not your past missed opportunities. This approach helps maintain discipline and prevents emotional chasing.
Probabilistic market research, not a recommendation or guaranteed return.
Would you keep the same rule after missing a move?
#SOXLB #TradingPsychology #CryptoLearning
Binance spot proof for $SOXLB: closed price 45.93 USDT.
Source: binance. Closed candle: 2026-11-07T08:45:00+00:00.
$SOXLB : Choosing Rules Over Regret
Anchoring keeps your attention fixed on a specific price level. You might feel stuck at 45.88 because earlier charts printed there. This mental shortcut helps you compare new data quickly, but it can block objective analysis.
The current observation shows $SOXLB trading above resistance. The hourly direction is up, yet volume is not above baseline. Such a combination often creates uncertainty. Traders may wonder if the move will hold without strong buying pressure. If you missed the initial break, you might feel pressure to chase the entry. That reaction stems from the fear of missing out against the anchored level. You may double down on a rule just to feel certain, rather than reassessing the context.
This is a thought experiment, not a statement of actual trader motives. Many participants simply execute their system without emotional attachment. The risk lies in modifying your strategy mid-session because you missed the first move. Instead, treat the missed entry as data. Ask if your original entry criteria were still valid. If the volume lacks conviction, the break might be weak regardless of your feelings.
A practical self-check involves writing down your entry rule before the move happens. When price moves, check if the rule was met. If you missed it, do not alter the standard for the next signal. Keep your criteria consistent. This reduces the impact of regret on future decisions. Use 58.1743 to gauge momentum strength, but do not let it override your predefined rules. Sticking to a plan ensures your analysis remains neutral. The goal is to trade the current data, not your past missed opportunities. This approach helps maintain discipline and prevents emotional chasing.
Probabilistic market research, not a recommendation or guaranteed return.
Would you keep the same rule after missing a move?
#SOXLB #TradingPsychology #CryptoLearning
Binance spot proof for $SOXLB : closed price 45.93 USDT.
Source: binance. Closed candle: 2026-11-07T08:45:00+00:00.
Anchoring keeps your attention fixed on a specific price level. You might feel stuck at 45.88 because earlier charts printed there. This mental shortcut helps you compare new data quickly, but it can block objective analysis.
The current observation shows $SOXLB trading above resistance. The hourly direction is up, yet volume is not above baseline. Such a combination often creates uncertainty. Traders may wonder if the move will hold without strong buying pressure. If you missed the initial break, you might feel pressure to chase the entry. That reaction stems from the fear of missing out against the anchored level. You may double down on a rule just to feel certain, rather than reassessing the context.
This is a thought experiment, not a statement of actual trader motives. Many participants simply execute their system without emotional attachment. The risk lies in modifying your strategy mid-session because you missed the first move. Instead, treat the missed entry as data. Ask if your original entry criteria were still valid. If the volume lacks conviction, the break might be weak regardless of your feelings.
A practical self-check involves writing down your entry rule before the move happens. When price moves, check if the rule was met. If you missed it, do not alter the standard for the next signal. Keep your criteria consistent. This reduces the impact of regret on future decisions. Use 58.1743 to gauge momentum strength, but do not let it override your predefined rules. Sticking to a plan ensures your analysis remains neutral. The goal is to trade the current data, not your past missed opportunities. This approach helps maintain discipline and prevents emotional chasing.
Probabilistic market research, not a recommendation or guaranteed return.
Would you keep the same rule after missing a move?
#SOXLB #TradingPsychology #CryptoLearning
Binance spot proof for $SOXLB : closed price 45.93 USDT.
Source: binance. Closed candle: 2026-11-07T08:45:00+00:00.
29
·
--
$ZEC +5.68% | $SOXLB +9.76% | $AAOIB +15.05%
#ZEC trades at $1,334.10, climbing +5.68% on a solid $293.2 M of volume. Its privacy‑focused design keeps it in the conversation despite a modest price move.
#SOXLB is at $46.33, up +9.76% with $65.5 M changing hands. The surge suggests growing interest, though the market remains volatile.
#AAOIB sits at $50.38, jumping +15.05% on just $2.3 M of volume. Such a spike on low liquidity can be fragile, so the rally could ease if broader sentiment shifts.
👀 Watch whether AAOIB’s price can hold above $50 as volume stays thin.
#Write2Earn #Binance
$ZEC +5.68% | $SOXLB +9.76% | $AAOIB +15.05%
#ZEC trades at $1,334.10, climbing +5.68% on a solid $293.2 M of volume. Its privacy‑focused design keeps it in the conversation despite a modest price move.
#SOXLB is at $46.33, up +9.76% with $65.5 M changing hands. The surge suggests growing interest, though the market remains volatile.
#AAOIB sits at $50.38, jumping +15.05% on just $2.3 M of volume. Such a spike on low liquidity can be fragile, so the rally could ease if broader sentiment shifts.
👀 Watch whether AAOIB’s price can hold above $50 as volume stays thin.
#Write2Earn #Binance
#ZEC trades at $1,334.10, climbing +5.68% on a solid $293.2 M of volume. Its privacy‑focused design keeps it in the conversation despite a modest price move.
#SOXLB is at $46.33, up +9.76% with $65.5 M changing hands. The surge suggests growing interest, though the market remains volatile.
#AAOIB sits at $50.38, jumping +15.05% on just $2.3 M of volume. Such a spike on low liquidity can be fragile, so the rally could ease if broader sentiment shifts.
👀 Watch whether AAOIB’s price can hold above $50 as volume stays thin.
#Write2Earn #Binance
1

·
--
🚨 MARKET ALERT:
Hyperliquid Strategies files with CFTC to become FCM for US clients
The filing could diversify regulated access to onchain futures for US traders, but regulatory delays may impact market entry timelines
$SOXLB is back on the radar as regulation starts shifting sentiment again.
This is the kind of headline that can pull fast attention if price starts reacting in the same direction.
Crowd attention can shift fast here, which is why traders will be watching this move closely.
Are you watching $SOXLB now, or waiting for confirmation?
Trade $SOXLB here 👇
#SOXLB #CryptoNews #MarketWatch
🚨 MARKET ALERT:
Hyperliquid Strategies files with CFTC to become FCM for US clients
The filing could diversify regulated access to onchain futures for US traders, but regulatory delays may impact market entry timelines
$SOXLB is back on the radar as regulation starts shifting sentiment again.
This is the kind of headline that can pull fast attention if price starts reacting in the same direction.
Crowd attention can shift fast here, which is why traders will be watching this move closely.
Are you watching $SOXLB now, or waiting for confirmation?
Trade $SOXLB here 👇
#SOXLB #CryptoNews #MarketWatch
Hyperliquid Strategies files with CFTC to become FCM for US clients
The filing could diversify regulated access to onchain futures for US traders, but regulatory delays may impact market entry timelines
$SOXLB is back on the radar as regulation starts shifting sentiment again.
This is the kind of headline that can pull fast attention if price starts reacting in the same direction.
Crowd attention can shift fast here, which is why traders will be watching this move closely.
Are you watching $SOXLB now, or waiting for confirmation?
Trade $SOXLB here 👇
#SOXLB #CryptoNews #MarketWatch
1

·
--
$SOXLB looks ready to go higher from here
Trading volume is almost double the normal average today
Price jumped 12.2 percent and is holding its ground
Buy $SOXLB 44.9269 to 46.5308
SL 42.4207
Targets 51.8939 / 55.6832 / 61.3671
Sitting inside the zone as I type this
Tap $SOXLB to buy
Taking it or watching it
#SOXLB #TradingSignals
$SOXLB looks ready to go higher from here
Trading volume is almost double the normal average today
Price jumped 12.2 percent and is holding its ground
Buy $SOXLB 44.9269 to 46.5308
SL 42.4207
Targets 51.8939 / 55.6832 / 61.3671
Sitting inside the zone as I type this
Tap $SOXLB to buy
Taking it or watching it
#SOXLB #TradingSignals
Trading volume is almost double the normal average today
Price jumped 12.2 percent and is holding its ground
Buy $SOXLB 44.9269 to 46.5308
SL 42.4207
Targets 51.8939 / 55.6832 / 61.3671
Sitting inside the zone as I type this
Tap $SOXLB to buy
Taking it or watching it
#SOXLB #TradingSignals
2
·
--
Volume surged 1.31x above average as $SOXLB held a $45.20 quote.
Hourly candles dropped 5.02% to close at $45.75 after touching a 49.97 high. This shows fading short-term momentum inside a wide 38.81 to 49.97 range on $91.73M volume.
A sustained move back above the 49.97 high confirms continuation, whereas dropping below the 38.81 low invalidates the recent 4.32% daily gain.
Will you wait for a confirmed break above 49.97, or does a drop toward 38.81 change your risk outlook?
Tap $SOXLB for the live chart. #SOXLB #BinanceSquare
Volume surged 1.31x above average as $SOXLB held a $45.20 quote.
Hourly candles dropped 5.02% to close at $45.75 after touching a 49.97 high. This shows fading short-term momentum inside a wide 38.81 to 49.97 range on $91.73M volume.
A sustained move back above the 49.97 high confirms continuation, whereas dropping below the 38.81 low invalidates the recent 4.32% daily gain.
Will you wait for a confirmed break above 49.97, or does a drop toward 38.81 change your risk outlook?
Tap $SOXLB for the live chart. #SOXLB #BinanceSquare
Hourly candles dropped 5.02% to close at $45.75 after touching a 49.97 high. This shows fading short-term momentum inside a wide 38.81 to 49.97 range on $91.73M volume.
A sustained move back above the 49.97 high confirms continuation, whereas dropping below the 38.81 low invalidates the recent 4.32% daily gain.
Will you wait for a confirmed break above 49.97, or does a drop toward 38.81 change your risk outlook?
Tap $SOXLB for the live chart. #SOXLB #BinanceSquare
7

·
--
📉 SOXLB -20%, SNDKB -9.5%, TQQQB -14% — Tokenized Equities Are Having a Bloodbath
If you thought crypto was volatile, try tokenized stocks on a red day. These three equity-backed tokens are getting absolutely wrecked and the correlation between them tells a clear story: TradFi contagion is real 🩸
Why group these? All three are tokenized equity products. When they dump in unison, it means the sell-off is macro, not crypto-native.
📊 SOXLB — $48.87 (-20.15%)
The hardest hit of the bunch. Daily RSI at 29.7 — textbook oversold. But do not try to catch this knife yet. Volume surging at 2.07x average means genuine liquidation pressure, not just low-liquidity wicks. Price is well below both SMA7 ($45.8) and SMA25 ($62.9). This is capitulation-level selling.
📊 SNDKB — $901.64 (-9.48%)
RSI 4H at 36.8, daily at 30.3. Both firmly in oversold territory. The MACD spread is widening negative (-74.7 with histogram at -14.9), which means sellers are in full control with no sign of exhaustion. Volume at 1.23x suggests steady distribution rather than panic.
📊 TQQQB — $52.81 (-13.93%)
Leveraged equity token feeling every bit of the tech downturn. RSI 4H at 35.9, volume surging at 2.08x. Price has blown through SMA7 ($52.0) and is approaching SMA25 ($58.4) from below — that is now overhead resistance. The fact that leveraged products are dropping this hard signals broad risk-off positioning.
📋 Trade Plans (All SHORT):
• SOXLB: Entry $45.8-$51.9 | SL $61.0 | TP $44.5 / $43.1
• SNDKB: Entry $875-$928 | SL $1,006 | TP $849 / $823
• TQQQB: Entry $51.4-$54.3 | SL $58.6 | TP $49.8 / $47.6
⚠️ These instruments carry amplified risk. Position sizing should reflect that. Oversold can always get more oversold.
Tokenized stocks: innovation or just amplified pain? Would you trade these or stick to spot crypto? 👇
#SOXLB #SNDKB #TQQQB
📉 SOXLB -20%, SNDKB -9.5%, TQQQB -14% — Tokenized Equities Are Having a Bloodbath
If you thought crypto was volatile, try tokenized stocks on a red day. These three equity-backed tokens are getting absolutely wrecked and the correlation between them tells a clear story: TradFi contagion is real 🩸
Why group these? All three are tokenized equity products. When they dump in unison, it means the sell-off is macro, not crypto-native.
📊 SOXLB — $48.87 (-20.15%)
The hardest hit of the bunch. Daily RSI at 29.7 — textbook oversold. But do not try to catch this knife yet. Volume surging at 2.07x average means genuine liquidation pressure, not just low-liquidity wicks. Price is well below both SMA7 ($45.8) and SMA25 ($62.9). This is capitulation-level selling.
📊 SNDKB — $901.64 (-9.48%)
RSI 4H at 36.8, daily at 30.3. Both firmly in oversold territory. The MACD spread is widening negative (-74.7 with histogram at -14.9), which means sellers are in full control with no sign of exhaustion. Volume at 1.23x suggests steady distribution rather than panic.
📊 TQQQB — $52.81 (-13.93%)
Leveraged equity token feeling every bit of the tech downturn. RSI 4H at 35.9, volume surging at 2.08x. Price has blown through SMA7 ($52.0) and is approaching SMA25 ($58.4) from below — that is now overhead resistance. The fact that leveraged products are dropping this hard signals broad risk-off positioning.
📋 Trade Plans (All SHORT):
• SOXLB: Entry $45.8-$51.9 | SL $61.0 | TP $44.5 / $43.1
• SNDKB: Entry $875-$928 | SL $1,006 | TP $849 / $823
• TQQQB: Entry $51.4-$54.3 | SL $58.6 | TP $49.8 / $47.6
⚠️ These instruments carry amplified risk. Position sizing should reflect that. Oversold can always get more oversold.
Tokenized stocks: innovation or just amplified pain? Would you trade these or stick to spot crypto? 👇
#SOXLB #SNDKB #TQQQB
If you thought crypto was volatile, try tokenized stocks on a red day. These three equity-backed tokens are getting absolutely wrecked and the correlation between them tells a clear story: TradFi contagion is real 🩸
Why group these? All three are tokenized equity products. When they dump in unison, it means the sell-off is macro, not crypto-native.
📊 SOXLB — $48.87 (-20.15%)
The hardest hit of the bunch. Daily RSI at 29.7 — textbook oversold. But do not try to catch this knife yet. Volume surging at 2.07x average means genuine liquidation pressure, not just low-liquidity wicks. Price is well below both SMA7 ($45.8) and SMA25 ($62.9). This is capitulation-level selling.
📊 SNDKB — $901.64 (-9.48%)
RSI 4H at 36.8, daily at 30.3. Both firmly in oversold territory. The MACD spread is widening negative (-74.7 with histogram at -14.9), which means sellers are in full control with no sign of exhaustion. Volume at 1.23x suggests steady distribution rather than panic.
📊 TQQQB — $52.81 (-13.93%)
Leveraged equity token feeling every bit of the tech downturn. RSI 4H at 35.9, volume surging at 2.08x. Price has blown through SMA7 ($52.0) and is approaching SMA25 ($58.4) from below — that is now overhead resistance. The fact that leveraged products are dropping this hard signals broad risk-off positioning.
📋 Trade Plans (All SHORT):
• SOXLB: Entry $45.8-$51.9 | SL $61.0 | TP $44.5 / $43.1
• SNDKB: Entry $875-$928 | SL $1,006 | TP $849 / $823
• TQQQB: Entry $51.4-$54.3 | SL $58.6 | TP $49.8 / $47.6
⚠️ These instruments carry amplified risk. Position sizing should reflect that. Oversold can always get more oversold.
Tokenized stocks: innovation or just amplified pain? Would you trade these or stick to spot crypto? 👇
#SOXLB #SNDKB #TQQQB
784

·
--
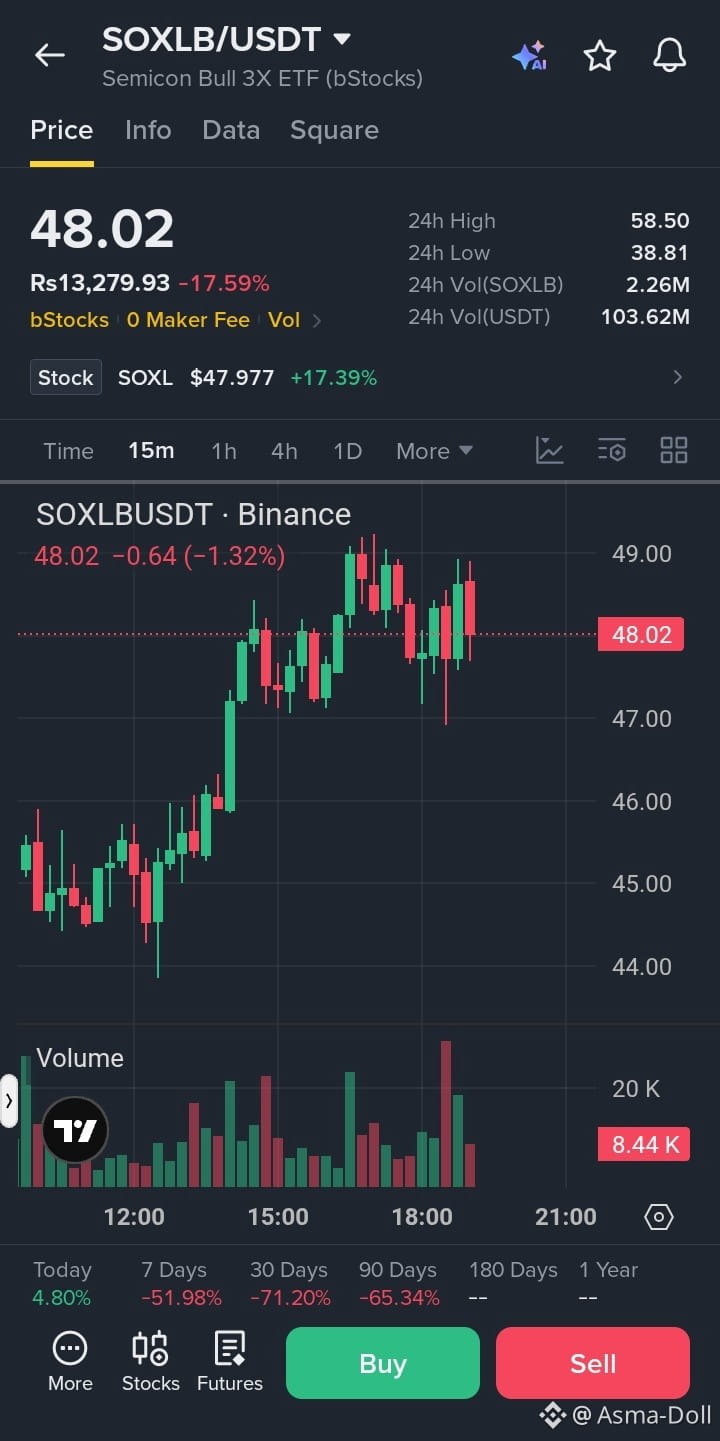
🔴 $SOXLB /USDT — SHORT SIGNAL
Trade Plan:
Direction: SHORT 📉
Entry Zone: 48.00 – 49.00
Stop Loss (SL): 50.50
Take Profit Targets:
TP1: 46.00
TP2: 44.00
TP3: 41.00
Trade here$SOXLB
{spot}(SOXLBUSDT)
Analysis:
Strong daily decline of 17.59%.
Price showing bearish intraday pressure.
Weak momentum around the $48 zone.
High volatility indicates increased downside risk.
Breakdown below $47 may trigger further selling.
A temporary bounce may provide another short-entry opportunity.
Confirmation: Wait for a clean 15m candle close below $47.00 with selling volume before entering.
Risk-to-Reward (approx.):
TP1: 1:1.2
TP2: 1:2
TP3: 1:3.5
⚠️ Risk Warning: SOXLB is a 3X leveraged ETF token. Your supplied data shows a discrepancy between SOXLB's percentage change and the underlying SOXL quote. Verify the live price before trading.
Trade smart. Use proper risk management! ⚡
#SOXLB #SHORTSignal #CryptoTrading #BinanceFutures #BearishTrend
🔴 $SOXLB /USDT — SHORT SIGNAL
Trade Plan:
Direction: SHORT 📉
Entry Zone: 48.00 – 49.00
Stop Loss (SL): 50.50
Take Profit Targets:
TP1: 46.00
TP2: 44.00
TP3: 41.00
Trade here$SOXLB
Analysis:
Strong daily decline of 17.59%.
Price showing bearish intraday pressure.
Weak momentum around the $48 zone.
High volatility indicates increased downside risk.
Breakdown below $47 may trigger further selling.
A temporary bounce may provide another short-entry opportunity.
Confirmation: Wait for a clean 15m candle close below $47.00 with selling volume before entering.
Risk-to-Reward (approx.):
TP1: 1:1.2
TP2: 1:2
TP3: 1:3.5
⚠️ Risk Warning: SOXLB is a 3X leveraged ETF token. Your supplied data shows a discrepancy between SOXLB's percentage change and the underlying SOXL quote. Verify the live price before trading.
Trade smart. Use proper risk management! ⚡
#SOXLB #SHORTSignal #CryptoTrading #BinanceFutures #BearishTrend
Trade Plan:
Direction: SHORT 📉
Entry Zone: 48.00 – 49.00
Stop Loss (SL): 50.50
Take Profit Targets:
TP1: 46.00
TP2: 44.00
TP3: 41.00
Trade here$SOXLB
Analysis:
Strong daily decline of 17.59%.
Price showing bearish intraday pressure.
Weak momentum around the $48 zone.
High volatility indicates increased downside risk.
Breakdown below $47 may trigger further selling.
A temporary bounce may provide another short-entry opportunity.
Confirmation: Wait for a clean 15m candle close below $47.00 with selling volume before entering.
Risk-to-Reward (approx.):
TP1: 1:1.2
TP2: 1:2
TP3: 1:3.5
⚠️ Risk Warning: SOXLB is a 3X leveraged ETF token. Your supplied data shows a discrepancy between SOXLB's percentage change and the underlying SOXL quote. Verify the live price before trading.
Trade smart. Use proper risk management! ⚡
#SOXLB #SHORTSignal #CryptoTrading #BinanceFutures #BearishTrend
38
·
--
$SOXLB -19.07% | $ONE +33.12% | $SCRT -22.83%
#SOXLB sits at $47.84, down 19.07% on a hefty $102.4 M of volume, suggesting sellers are still in control.
#ONE climbs to $0.00147100, up 33.12% with $6.4 M traded, a sharp bounce that may reflect renewed interest.
#SCRT is at $0.00710000, slipping 22.83% on modest $1.5 M volume, indicating limited buying pressure.
📊 Watch how the divergent volume sizes could influence the next price moves for these assets.
#Write2Earn #Binance
$SOXLB -19.07% | $ONE +33.12% | $SCRT -22.83%
#SOXLB sits at $47.84, down 19.07% on a hefty $102.4 M of volume, suggesting sellers are still in control.
#ONE climbs to $0.00147100, up 33.12% with $6.4 M traded, a sharp bounce that may reflect renewed interest.
#SCRT is at $0.00710000, slipping 22.83% on modest $1.5 M volume, indicating limited buying pressure.
📊 Watch how the divergent volume sizes could influence the next price moves for these assets.
#Write2Earn #Binance
#SOXLB sits at $47.84, down 19.07% on a hefty $102.4 M of volume, suggesting sellers are still in control.
#ONE climbs to $0.00147100, up 33.12% with $6.4 M traded, a sharp bounce that may reflect renewed interest.
#SCRT is at $0.00710000, slipping 22.83% on modest $1.5 M volume, indicating limited buying pressure.
📊 Watch how the divergent volume sizes could influence the next price moves for these assets.
#Write2Earn #Binance
3
·
--
Is a 23.9% drop for $SOXLB exhausting its downside momentum?
Price sits at $47.40 after touching a 23-hour low of $38.81.
The latest hourly candle closed up 3.29%, showing early signs of stabilization.
Hourly volume sits at 0.73x the 23-hour average, indicating muted buying interest so far.
A sustained move back toward the $62.56 high requires rising volume confirmation. Conversely, a breakdown below $38.81 invalidates this stabilization setup.
Will volume return to confirm a bullish reversal, or does a drop below the low invalidate the bounce?
Tap $SOXLB for the live chart. #SOXLB #BinanceSquare
Is a 23.9% drop for $SOXLB exhausting its downside momentum?
Price sits at $47.40 after touching a 23-hour low of $38.81.
The latest hourly candle closed up 3.29%, showing early signs of stabilization.
Hourly volume sits at 0.73x the 23-hour average, indicating muted buying interest so far.
A sustained move back toward the $62.56 high requires rising volume confirmation. Conversely, a breakdown below $38.81 invalidates this stabilization setup.
Will volume return to confirm a bullish reversal, or does a drop below the low invalidate the bounce?
Tap $SOXLB for the live chart. #SOXLB #BinanceSquare
Price sits at $47.40 after touching a 23-hour low of $38.81.
The latest hourly candle closed up 3.29%, showing early signs of stabilization.
Hourly volume sits at 0.73x the 23-hour average, indicating muted buying interest so far.
A sustained move back toward the $62.56 high requires rising volume confirmation. Conversely, a breakdown below $38.81 invalidates this stabilization setup.
Will volume return to confirm a bullish reversal, or does a drop below the low invalidate the bounce?
Tap $SOXLB for the live chart. #SOXLB #BinanceSquare
·
--
$SOXLB -28.09% | $UNI -9.30% | $SNDKB -16.34%
#SOXLB slipped to $44.78, down ‑28.09% on $100.2 M of volume. The heavy trading suggests sellers are still dominant despite the price drop.
#UNI is at $6.96, down ‑9.30% with $96.1 M changing hands. Volume remains solid, hinting at continued interest even as the token eases lower.
#SNDKB trades around $850.86, down ‑16.34% on $94.5 M of volume. The market’s appetite stays relatively high for a token in decline. 📉
The narrowing volume gap between UNI and SNDKB could point to shifting liquidity preferences.
#Write2Earn #Binance
$SOXLB -28.09% | $UNI -9.30% | $SNDKB -16.34%
#SOXLB slipped to $44.78, down ‑28.09% on $100.2 M of volume. The heavy trading suggests sellers are still dominant despite the price drop.
#UNI is at $6.96, down ‑9.30% with $96.1 M changing hands. Volume remains solid, hinting at continued interest even as the token eases lower.
#SNDKB trades around $850.86, down ‑16.34% on $94.5 M of volume. The market’s appetite stays relatively high for a token in decline. 📉
The narrowing volume gap between UNI and SNDKB could point to shifting liquidity preferences.
#Write2Earn #Binance
#SOXLB slipped to $44.78, down ‑28.09% on $100.2 M of volume. The heavy trading suggests sellers are still dominant despite the price drop.
#UNI is at $6.96, down ‑9.30% with $96.1 M changing hands. Volume remains solid, hinting at continued interest even as the token eases lower.
#SNDKB trades around $850.86, down ‑16.34% on $94.5 M of volume. The market’s appetite stays relatively high for a token in decline. 📉
The narrowing volume gap between UNI and SNDKB could point to shifting liquidity preferences.
#Write2Earn #Binance
7
Log in to explore more content
Join global crypto users on Binance Square
⚡️ Get latest and useful information about crypto.
💬 Trusted by the world’s largest crypto exchange.
👍 Discover real insights from verified creators.
Email / Phone number
Trending Topics
1
#BinanceReopensWithdrawalsForHYPE&APT
74,056 views
907 Discussing
2
#SouthKoreaDraftLawTargets15To20%ShareholderCap
74,533 views
597 Discussing
3
#TradFiForBeginners
174,045 views
1,795 Discussing
4
#KeplrAdvisesSocialLoginUsersToTransferAssets
41,820 views
486 Discussing
5
#TetherPlans€28.8MForJuventusCapitalIncrease
28,816 views
375 Discussing
6
#JobsReportRaisesHikeOdds
839,311 views
4,406 Discussing
7
#CPITestsDecemberRateOutlook
337,435 views
1,860 Discussing
8
#US Data Center Rules May Constrain AI Expansion
126,119 views
258 Discussing
9
#ARKPlans14ThematicETFsCoveringAIAndTokenizedMarkets
9,025 views
89 Discussing
10
#WillAnthropicListOnTime
266,262 views
1,873 Discussing