
#pnt
pnt
160,241 views
768 Discussing
Hot
Latest

+45.23% in 24 hours.
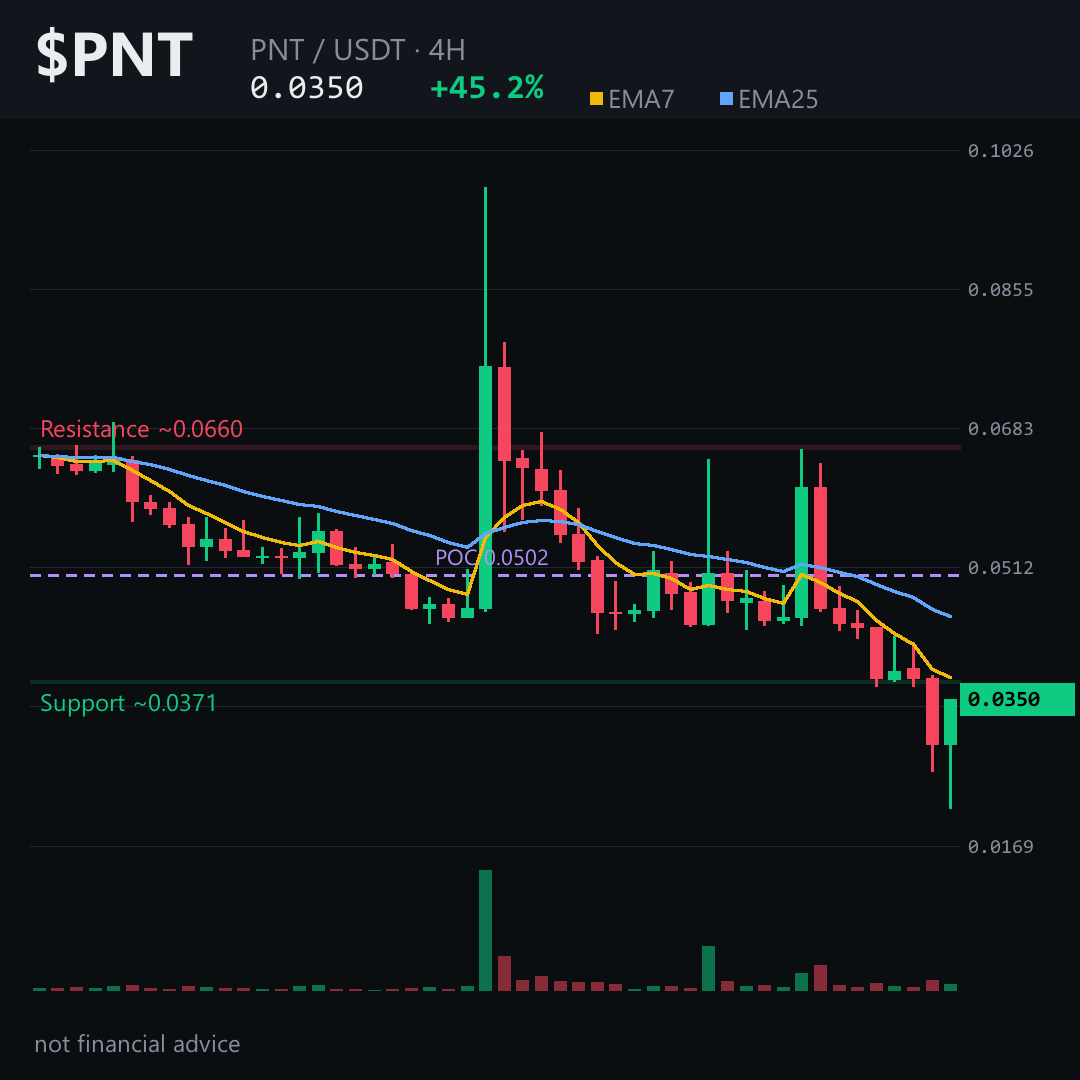
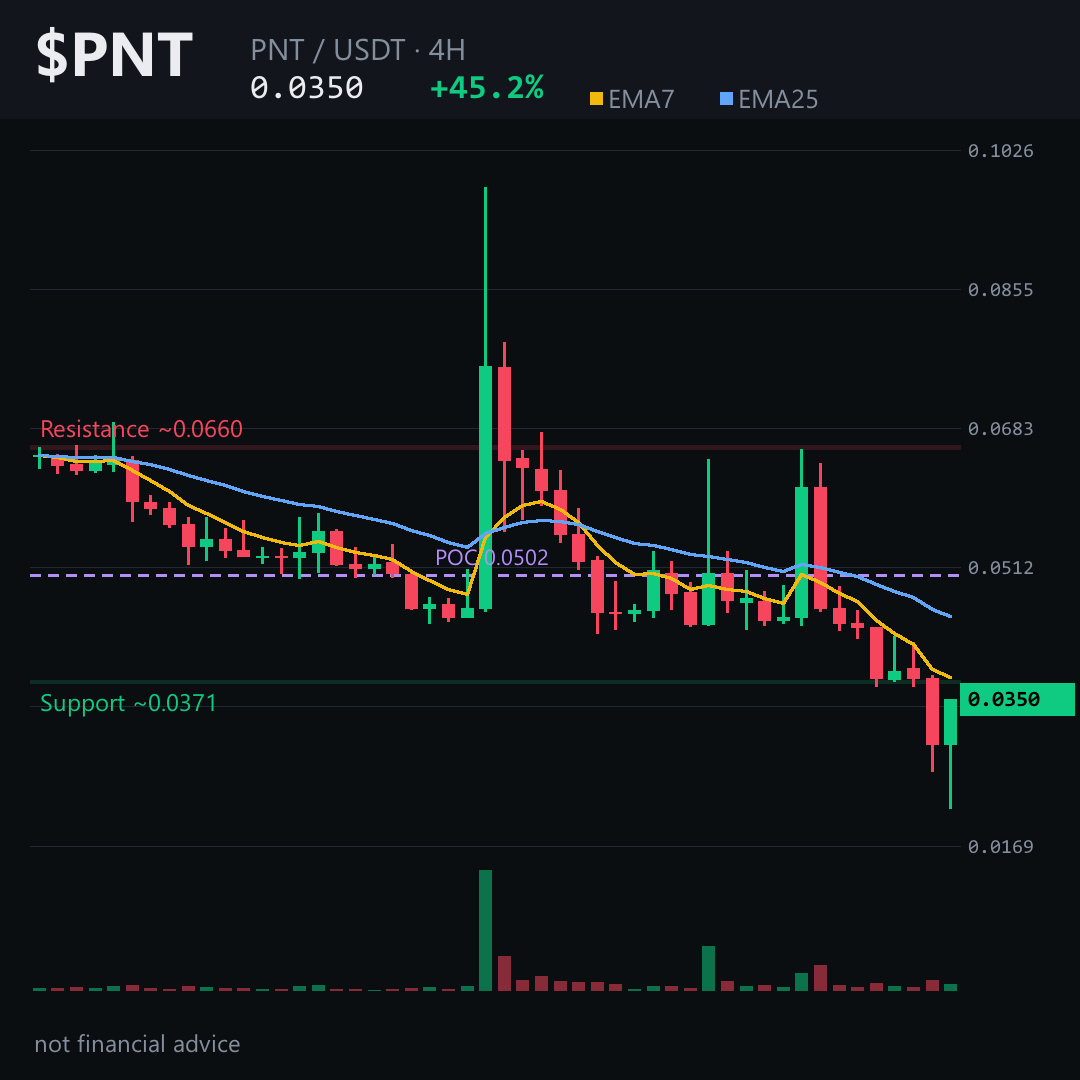
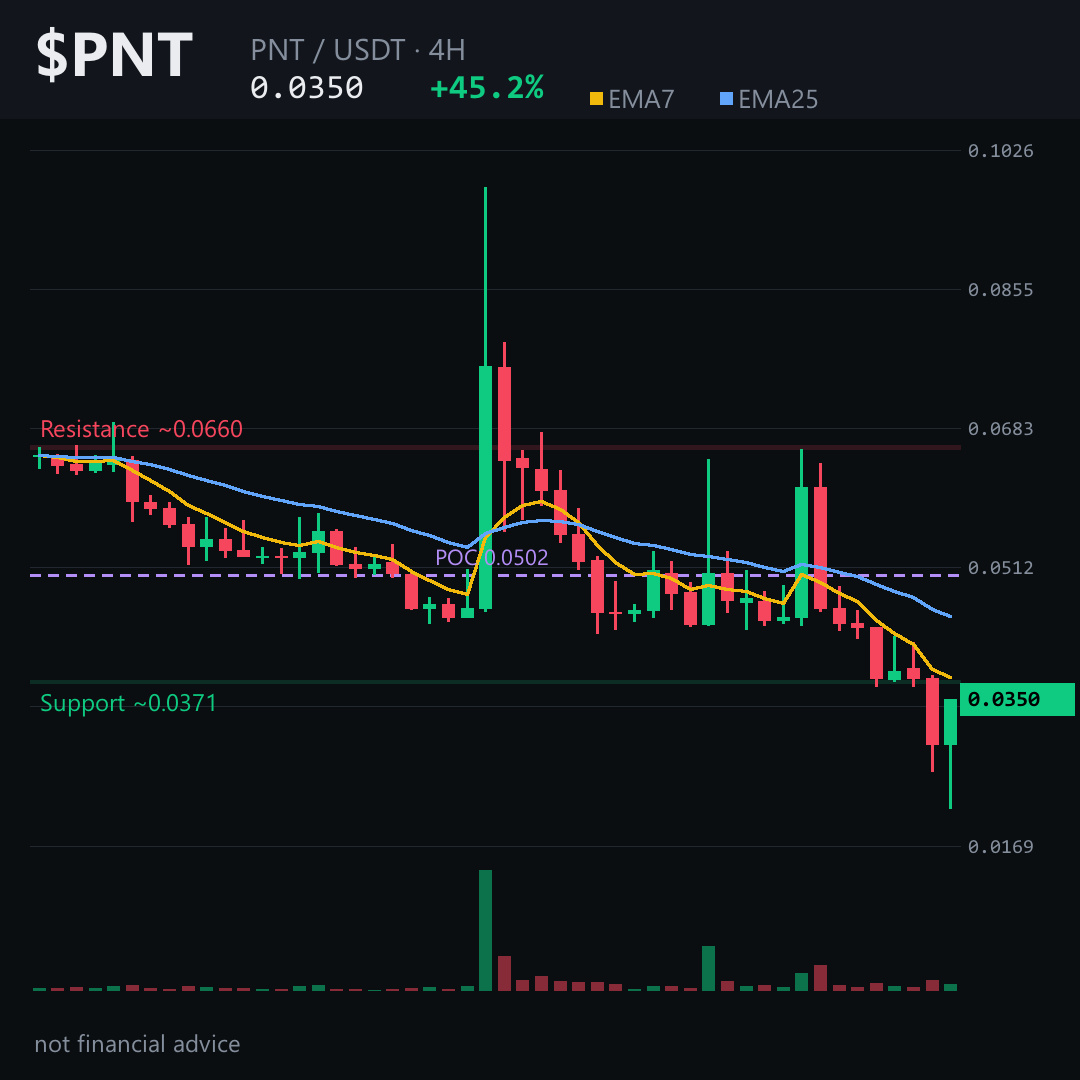
Now look at the 4H candles: a 35% pump, then a 24% rejection, then a 21% flush.
That's not momentum. That's exhaustion.
The daily picture is even colder. Price sits at 35 cents while the 25-day average is nearly double that. RSI on the daily is deep in the low 20s — oversold, but in a downtrend, oversold can stay oversold for weeks.
Volume profile shows the heaviest traded zone around 50 cents. We're far below that, so every bounce toward it becomes supply.
My read on the levels that matter, using the 4H structure: the pivot is the 35-cent area. The invalidation sits just above 36.9 cents. If $PNT cannot reclaim that zone, the path of least resistance points toward the 32-cent area.
That's the setup. Not a bounce play — a continuation read.
What I'm really watching: the 21-cent low from the last 24 hours. That's where the real demand test happened. Lose that on a daily close, and the macro objective near 22 cents suddenly doesn't look so distant.
Tap $PNT to pull up the chart and check these levels against the candles yourself.
My read: the bounce is real but fragile. Trend structure across every timeframe still points down, and funding at zero means the chart's own geometry is the only real signal.
Follow me for the breakdown when price reaches the 32-cent zone — I'll be watching whether it holds or breaks. Which level are you tracking more closely, the 32-cent floor or the 37-cent ceiling? 👇
⚠️ Not financial advice. DYOR.
#PNT #Crypto #BinanceSquare
+45.23% in 24 hours.
Now look at the 4H candles: a 35% pump, then a 24% rejection, then a 21% flush.
That's not momentum. That's exhaustion.
The daily picture is even colder. Price sits at 35 cents while the 25-day average is nearly double that. RSI on the daily is deep in the low 20s — oversold, but in a downtrend, oversold can stay oversold for weeks.
Volume profile shows the heaviest traded zone around 50 cents. We're far below that, so every bounce toward it becomes supply.
My read on the levels that matter, using the 4H structure: the pivot is the 35-cent area. The invalidation sits just above 36.9 cents. If $PNT cannot reclaim that zone, the path of least resistance points toward the 32-cent area.
That's the setup. Not a bounce play — a continuation read.
What I'm really watching: the 21-cent low from the last 24 hours. That's where the real demand test happened. Lose that on a daily close, and the macro objective near 22 cents suddenly doesn't look so distant.
Tap $PNT to pull up the chart and check these levels against the candles yourself.
My read: the bounce is real but fragile. Trend structure across every timeframe still points down, and funding at zero means the chart's own geometry is the only real signal.
Follow me for the breakdown when price reaches the 32-cent zone — I'll be watching whether it holds or breaks. Which level are you tracking more closely, the 32-cent floor or the 37-cent ceiling? 👇
⚠️ Not financial advice. DYOR.
#PNT #Crypto #BinanceSquare
Now look at the 4H candles: a 35% pump, then a 24% rejection, then a 21% flush.
That's not momentum. That's exhaustion.
The daily picture is even colder. Price sits at 35 cents while the 25-day average is nearly double that. RSI on the daily is deep in the low 20s — oversold, but in a downtrend, oversold can stay oversold for weeks.
Volume profile shows the heaviest traded zone around 50 cents. We're far below that, so every bounce toward it becomes supply.
My read on the levels that matter, using the 4H structure: the pivot is the 35-cent area. The invalidation sits just above 36.9 cents. If $PNT cannot reclaim that zone, the path of least resistance points toward the 32-cent area.
That's the setup. Not a bounce play — a continuation read.
What I'm really watching: the 21-cent low from the last 24 hours. That's where the real demand test happened. Lose that on a daily close, and the macro objective near 22 cents suddenly doesn't look so distant.
Tap $PNT to pull up the chart and check these levels against the candles yourself.
My read: the bounce is real but fragile. Trend structure across every timeframe still points down, and funding at zero means the chart's own geometry is the only real signal.
Follow me for the breakdown when price reaches the 32-cent zone — I'll be watching whether it holds or breaks. Which level are you tracking more closely, the 32-cent floor or the 37-cent ceiling? 👇
⚠️ Not financial advice. DYOR.
#PNT #Crypto #BinanceSquare
5
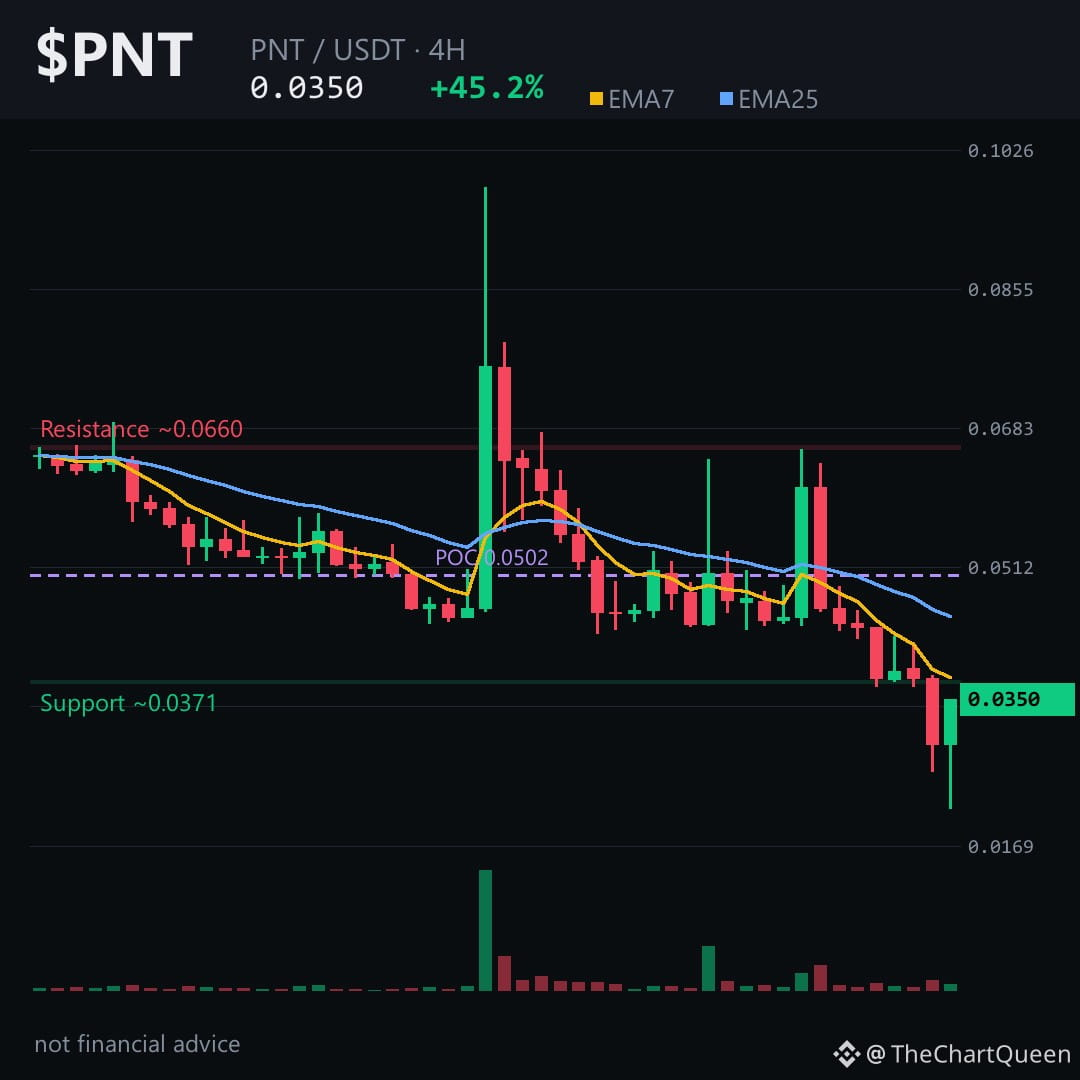
45% gain in 24 h, yet the 4‑hour EMA7 has slipped under EMA25 – a silent sell signal.
While the ticker glitters, the chart is already testing the 0.0352 pivot and the next barrier sits just above at ~0.0369.
The price hugs that pivot, but a sub‑40 RSI and the bearish EMA crossover whisper further downside. Funding is flat, so there’s no extra incentive pushing longs.
If $PNT slides below the ~0.032 zone, the bearish case strengthens. The current swing could drift toward that low‑0.032 area unless a bounce clears the ~0.0369 ceiling. Tap $PNT to pull up the chart and see the 0.0352 pivot for yourself.
My read: $PNT is likely to drift toward the low‑0.032 zone unless it rebounds above the ~0.0369 ceiling.
Follow me for the next update when the 0.032 area holds or fails – I’ll break down what that means for the swing.
What level are you watching on PNT? 👇
⚠️ Not financial advice. DYOR.
#PNT #Polygon #Crypto #BinanceSquare
45% gain in 24 h, yet the 4‑hour EMA7 has slipped under EMA25 – a silent sell signal.
While the ticker glitters, the chart is already testing the 0.0352 pivot and the next barrier sits just above at ~0.0369.
The price hugs that pivot, but a sub‑40 RSI and the bearish EMA crossover whisper further downside. Funding is flat, so there’s no extra incentive pushing longs.
If $PNT slides below the ~0.032 zone, the bearish case strengthens. The current swing could drift toward that low‑0.032 area unless a bounce clears the ~0.0369 ceiling. Tap $PNT to pull up the chart and see the 0.0352 pivot for yourself.
My read: $PNT is likely to drift toward the low‑0.032 zone unless it rebounds above the ~0.0369 ceiling.
Follow me for the next update when the 0.032 area holds or fails – I’ll break down what that means for the swing.
What level are you watching on PNT? 👇
⚠️ Not financial advice. DYOR.
#PNT #Polygon #Crypto #BinanceSquare
While the ticker glitters, the chart is already testing the 0.0352 pivot and the next barrier sits just above at ~0.0369.
The price hugs that pivot, but a sub‑40 RSI and the bearish EMA crossover whisper further downside. Funding is flat, so there’s no extra incentive pushing longs.
If $PNT slides below the ~0.032 zone, the bearish case strengthens. The current swing could drift toward that low‑0.032 area unless a bounce clears the ~0.0369 ceiling. Tap $PNT to pull up the chart and see the 0.0352 pivot for yourself.
My read: $PNT is likely to drift toward the low‑0.032 zone unless it rebounds above the ~0.0369 ceiling.
Follow me for the next update when the 0.032 area holds or fails – I’ll break down what that means for the swing.
What level are you watching on PNT? 👇
⚠️ Not financial advice. DYOR.
#PNT #Polygon #Crypto #BinanceSquare
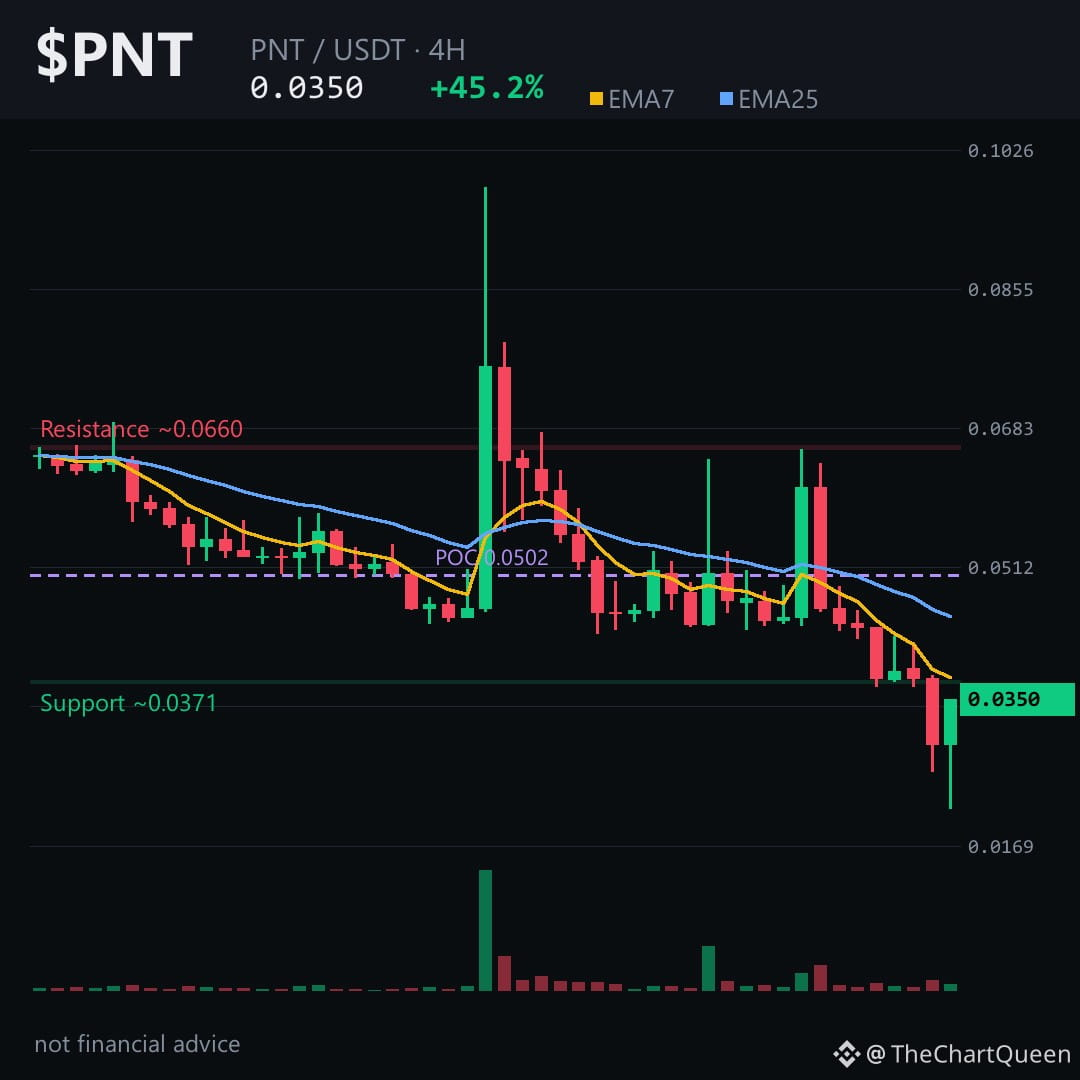
When a 4‑hour candle rockets from 0.045 to 0.061 and then crashes back to 0.035, the market is shouting “reverse”. $PNT is at a crossroads.
Price is clearly in a downtrend, yet the sudden 35% intraday spike left a lingering bullish imprint in the order flow. The EMA gap and a waning RSI around 40 suggest sellers are still in control, but the lingering bullish pressure could trap the next move.
On the 4‑hour chart $PNT is hugging the ~0.035 zone; a break above the ~0.0369 ceiling would flip the bias, while a slide toward the ~0.032 area looks like the next logical stop. Tap $PNT to pull up the chart and see these levels yourself.
I think the most probable path is a test of the low‑0.032 region, with the real danger if price re‑captures the ~0.0369 barrier.
Follow me for the next update when this zone either holds or collapses – you’ll see the next move before the market reacts. What level do you think will be the decisive test for PNT? 👇
⚠️ Not financial advice. DYOR.
#PNT #pNetwork #Crypto #BinanceSquare
When a 4‑hour candle rockets from 0.045 to 0.061 and then crashes back to 0.035, the market is shouting “reverse”. $PNT is at a crossroads.
Price is clearly in a downtrend, yet the sudden 35% intraday spike left a lingering bullish imprint in the order flow. The EMA gap and a waning RSI around 40 suggest sellers are still in control, but the lingering bullish pressure could trap the next move.
On the 4‑hour chart $PNT is hugging the ~0.035 zone; a break above the ~0.0369 ceiling would flip the bias, while a slide toward the ~0.032 area looks like the next logical stop. Tap $PNT to pull up the chart and see these levels yourself.
I think the most probable path is a test of the low‑0.032 region, with the real danger if price re‑captures the ~0.0369 barrier.
Follow me for the next update when this zone either holds or collapses – you’ll see the next move before the market reacts. What level do you think will be the decisive test for PNT? 👇
⚠️ Not financial advice. DYOR.
#PNT #pNetwork #Crypto #BinanceSquare
Price is clearly in a downtrend, yet the sudden 35% intraday spike left a lingering bullish imprint in the order flow. The EMA gap and a waning RSI around 40 suggest sellers are still in control, but the lingering bullish pressure could trap the next move.
On the 4‑hour chart $PNT is hugging the ~0.035 zone; a break above the ~0.0369 ceiling would flip the bias, while a slide toward the ~0.032 area looks like the next logical stop. Tap $PNT to pull up the chart and see these levels yourself.
I think the most probable path is a test of the low‑0.032 region, with the real danger if price re‑captures the ~0.0369 barrier.
Follow me for the next update when this zone either holds or collapses – you’ll see the next move before the market reacts. What level do you think will be the decisive test for PNT? 👇
⚠️ Not financial advice. DYOR.
#PNT #pNetwork #Crypto #BinanceSquare
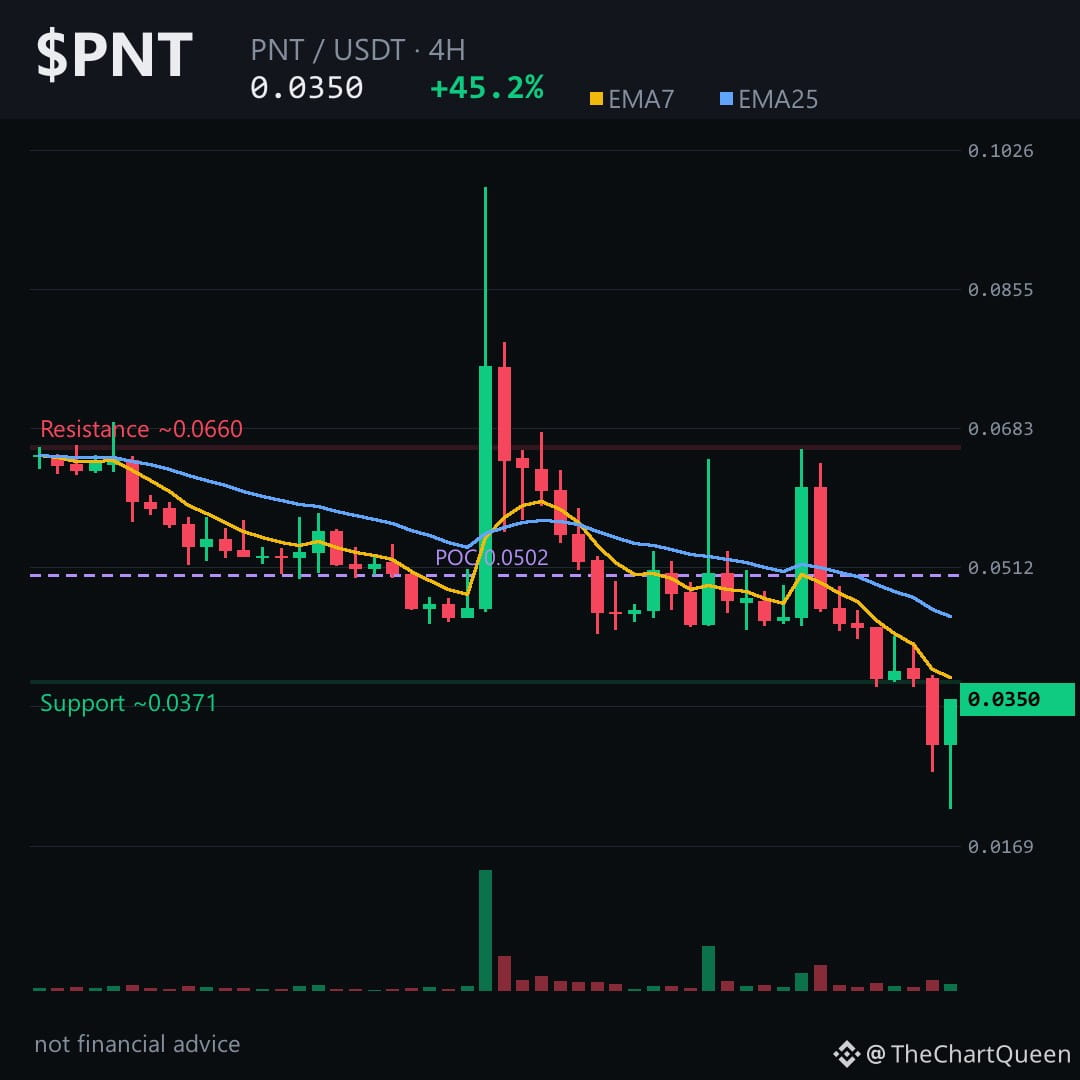
A 4‑hour candle just slipped beneath the ~0.0352 pivot, turning today’s 45 % rally into a potential flash‑crash.
Read on before the next swing wipes out the gains 👇
Price is flashing bearish – EMA 7 is under EMA 25 and RSI hovers near 40, hinting at weakening momentum. Yet the volume‑profile point‑of‑control still clings to the 0.050 area, a lingering pocket of buying that could stall a clean drop.
On the 4‑hour chart the key support sits around the ~0.032 zone; a close below the ~0.0369 invalidation would erase the bearish bias. If sellers stay in charge, the next target lies near the ~0.029‑0.030 area. Tap $PNT to pull up the chart and see these levels yourself.
I see the 4‑hour picture screaming lower, with the real risk being a break below the ~0.032 support.
If $PNT holds above that band I’ll break down why the next swing could rebound – follow me for that update.
What do you think the price will do around the ~0.032 level, $PNT? 👇
⚠️ Not financial advice. DYOR.
#PNT #Crypto #TopGainer #BinanceSquare
A 4‑hour candle just slipped beneath the ~0.0352 pivot, turning today’s 45 % rally into a potential flash‑crash.
Read on before the next swing wipes out the gains 👇
Price is flashing bearish – EMA 7 is under EMA 25 and RSI hovers near 40, hinting at weakening momentum. Yet the volume‑profile point‑of‑control still clings to the 0.050 area, a lingering pocket of buying that could stall a clean drop.
On the 4‑hour chart the key support sits around the ~0.032 zone; a close below the ~0.0369 invalidation would erase the bearish bias. If sellers stay in charge, the next target lies near the ~0.029‑0.030 area. Tap $PNT to pull up the chart and see these levels yourself.
I see the 4‑hour picture screaming lower, with the real risk being a break below the ~0.032 support.
If $PNT holds above that band I’ll break down why the next swing could rebound – follow me for that update.
What do you think the price will do around the ~0.032 level, $PNT? 👇
⚠️ Not financial advice. DYOR.
#PNT #Crypto #TopGainer #BinanceSquare
Read on before the next swing wipes out the gains 👇
Price is flashing bearish – EMA 7 is under EMA 25 and RSI hovers near 40, hinting at weakening momentum. Yet the volume‑profile point‑of‑control still clings to the 0.050 area, a lingering pocket of buying that could stall a clean drop.
On the 4‑hour chart the key support sits around the ~0.032 zone; a close below the ~0.0369 invalidation would erase the bearish bias. If sellers stay in charge, the next target lies near the ~0.029‑0.030 area. Tap $PNT to pull up the chart and see these levels yourself.
I see the 4‑hour picture screaming lower, with the real risk being a break below the ~0.032 support.
If $PNT holds above that band I’ll break down why the next swing could rebound – follow me for that update.
What do you think the price will do around the ~0.032 level, $PNT? 👇
⚠️ Not financial advice. DYOR.
#PNT #Crypto #TopGainer #BinanceSquare
27
+45% in 24 hours. And the daily RSI is sitting at 27.65 — deeply oversold, yet price keeps making lower highs. That’s not recovery. That’s a falling knife catching a bounce.
$PNT ripped to 0.0657 on a single candle, gave back 24% the next, and has been bleeding through every minor support since. Volume is thin — barely 262K USDT in a day — so these moves are liquidity-driven, not conviction-driven. EMA7 is below EMA25 on every meaningful timeframe, and the 4H RSI at 40 still has room to fall.
Price is hovering around 0.0357, which has become a pivot. A 4H close back above the 0.0385 zone would tell me the bounce has legs. Until then, the path of least resistance points toward 0.0300 — a psychological level that lines up with the lower end of this week’s range.
Zero funding, zero open interest. No leveraged crowd to squeeze — pure spot speculation, and that tends to fade fast once momentum dies.
My read: the pump looks like an outlier, not a regime change. The real risk is chasing green candles in a structure still printing lower highs. Tap $PNT on the chart and watch how price behaves around that 0.0385 zone — that’s where this bounce gets validated or rejected.
I’ll revisit this if the structure shifts — follow for the update. What’s your read on $PNT’s next move? 👇
⚠️ Not financial advice. DYOR.
#PNT #Crypto #BinanceSquare
+45% in 24 hours. And the daily RSI is sitting at 27.65 — deeply oversold, yet price keeps making lower highs. That’s not recovery. That’s a falling knife catching a bounce.
$PNT ripped to 0.0657 on a single candle, gave back 24% the next, and has been bleeding through every minor support since. Volume is thin — barely 262K USDT in a day — so these moves are liquidity-driven, not conviction-driven. EMA7 is below EMA25 on every meaningful timeframe, and the 4H RSI at 40 still has room to fall.
Price is hovering around 0.0357, which has become a pivot. A 4H close back above the 0.0385 zone would tell me the bounce has legs. Until then, the path of least resistance points toward 0.0300 — a psychological level that lines up with the lower end of this week’s range.
Zero funding, zero open interest. No leveraged crowd to squeeze — pure spot speculation, and that tends to fade fast once momentum dies.
My read: the pump looks like an outlier, not a regime change. The real risk is chasing green candles in a structure still printing lower highs. Tap $PNT on the chart and watch how price behaves around that 0.0385 zone — that’s where this bounce gets validated or rejected.
I’ll revisit this if the structure shifts — follow for the update. What’s your read on $PNT’s next move? 👇
⚠️ Not financial advice. DYOR.
#PNT #Crypto #BinanceSquare
$PNT ripped to 0.0657 on a single candle, gave back 24% the next, and has been bleeding through every minor support since. Volume is thin — barely 262K USDT in a day — so these moves are liquidity-driven, not conviction-driven. EMA7 is below EMA25 on every meaningful timeframe, and the 4H RSI at 40 still has room to fall.
Price is hovering around 0.0357, which has become a pivot. A 4H close back above the 0.0385 zone would tell me the bounce has legs. Until then, the path of least resistance points toward 0.0300 — a psychological level that lines up with the lower end of this week’s range.
Zero funding, zero open interest. No leveraged crowd to squeeze — pure spot speculation, and that tends to fade fast once momentum dies.
My read: the pump looks like an outlier, not a regime change. The real risk is chasing green candles in a structure still printing lower highs. Tap $PNT on the chart and watch how price behaves around that 0.0385 zone — that’s where this bounce gets validated or rejected.
I’ll revisit this if the structure shifts — follow for the update. What’s your read on $PNT’s next move? 👇
⚠️ Not financial advice. DYOR.
#PNT #Crypto #BinanceSquare
10
Can a coin be up 45% in a day and still be telling you the trend is down?
That’s the riddle $PNT just handed us — and the chart actually answers it.
The 4-hour picture is where the story lives. Price spiked hard from the low 0.04s to 0.065, then gave almost all of it back within two candles. That’s not momentum — that’s a blow-off. The short moving average is still below the longer one, and RSI is stuck in the low 40s. No real buying pressure behind this bounce. It’s a tired pump, not a fresh start.
Volume profile matters too. The heaviest traded zone sits around 0.05, and price is now trading far below that shelf. That shelf acts like an overhang — a lot of underwater holders watching for a chance to get out.
The 4-hour bias is bearish. The pivot to watch is around 0.035. If $PNT can’t reclaim and hold above roughly 0.037, the path of least resistance points back down toward 0.032. Lose that, and the daily chart suggests room toward 0.030.
The invalidation is clean: a 4-hour close back above the 0.037 zone would mean this bounce has more behind it than the chart currently shows.
My read: this looks like a relief bounce inside a larger downtrend, and the safest take is to respect the overhead supply near 0.05 until proven otherwise.
I’ll keep an eye on whether $PNT can hold the 0.035 pivot — follow along for the update if that shelf starts to bend.
What level are you watching on PNT right now? 👇
⚠️ Not financial advice. DYOR.
#PNT #Crypto #Altcoins #BinanceSquare
Can a coin be up 45% in a day and still be telling you the trend is down?
That’s the riddle $PNT just handed us — and the chart actually answers it.
The 4-hour picture is where the story lives. Price spiked hard from the low 0.04s to 0.065, then gave almost all of it back within two candles. That’s not momentum — that’s a blow-off. The short moving average is still below the longer one, and RSI is stuck in the low 40s. No real buying pressure behind this bounce. It’s a tired pump, not a fresh start.
Volume profile matters too. The heaviest traded zone sits around 0.05, and price is now trading far below that shelf. That shelf acts like an overhang — a lot of underwater holders watching for a chance to get out.
The 4-hour bias is bearish. The pivot to watch is around 0.035. If $PNT can’t reclaim and hold above roughly 0.037, the path of least resistance points back down toward 0.032. Lose that, and the daily chart suggests room toward 0.030.
The invalidation is clean: a 4-hour close back above the 0.037 zone would mean this bounce has more behind it than the chart currently shows.
My read: this looks like a relief bounce inside a larger downtrend, and the safest take is to respect the overhead supply near 0.05 until proven otherwise.
I’ll keep an eye on whether $PNT can hold the 0.035 pivot — follow along for the update if that shelf starts to bend.
What level are you watching on PNT right now? 👇
⚠️ Not financial advice. DYOR.
#PNT #Crypto #Altcoins #BinanceSquare
That’s the riddle $PNT just handed us — and the chart actually answers it.
The 4-hour picture is where the story lives. Price spiked hard from the low 0.04s to 0.065, then gave almost all of it back within two candles. That’s not momentum — that’s a blow-off. The short moving average is still below the longer one, and RSI is stuck in the low 40s. No real buying pressure behind this bounce. It’s a tired pump, not a fresh start.
Volume profile matters too. The heaviest traded zone sits around 0.05, and price is now trading far below that shelf. That shelf acts like an overhang — a lot of underwater holders watching for a chance to get out.
The 4-hour bias is bearish. The pivot to watch is around 0.035. If $PNT can’t reclaim and hold above roughly 0.037, the path of least resistance points back down toward 0.032. Lose that, and the daily chart suggests room toward 0.030.
The invalidation is clean: a 4-hour close back above the 0.037 zone would mean this bounce has more behind it than the chart currently shows.
My read: this looks like a relief bounce inside a larger downtrend, and the safest take is to respect the overhead supply near 0.05 until proven otherwise.
I’ll keep an eye on whether $PNT can hold the 0.035 pivot — follow along for the update if that shelf starts to bend.
What level are you watching on PNT right now? 👇
⚠️ Not financial advice. DYOR.
#PNT #Crypto #Altcoins #BinanceSquare
18

·
--
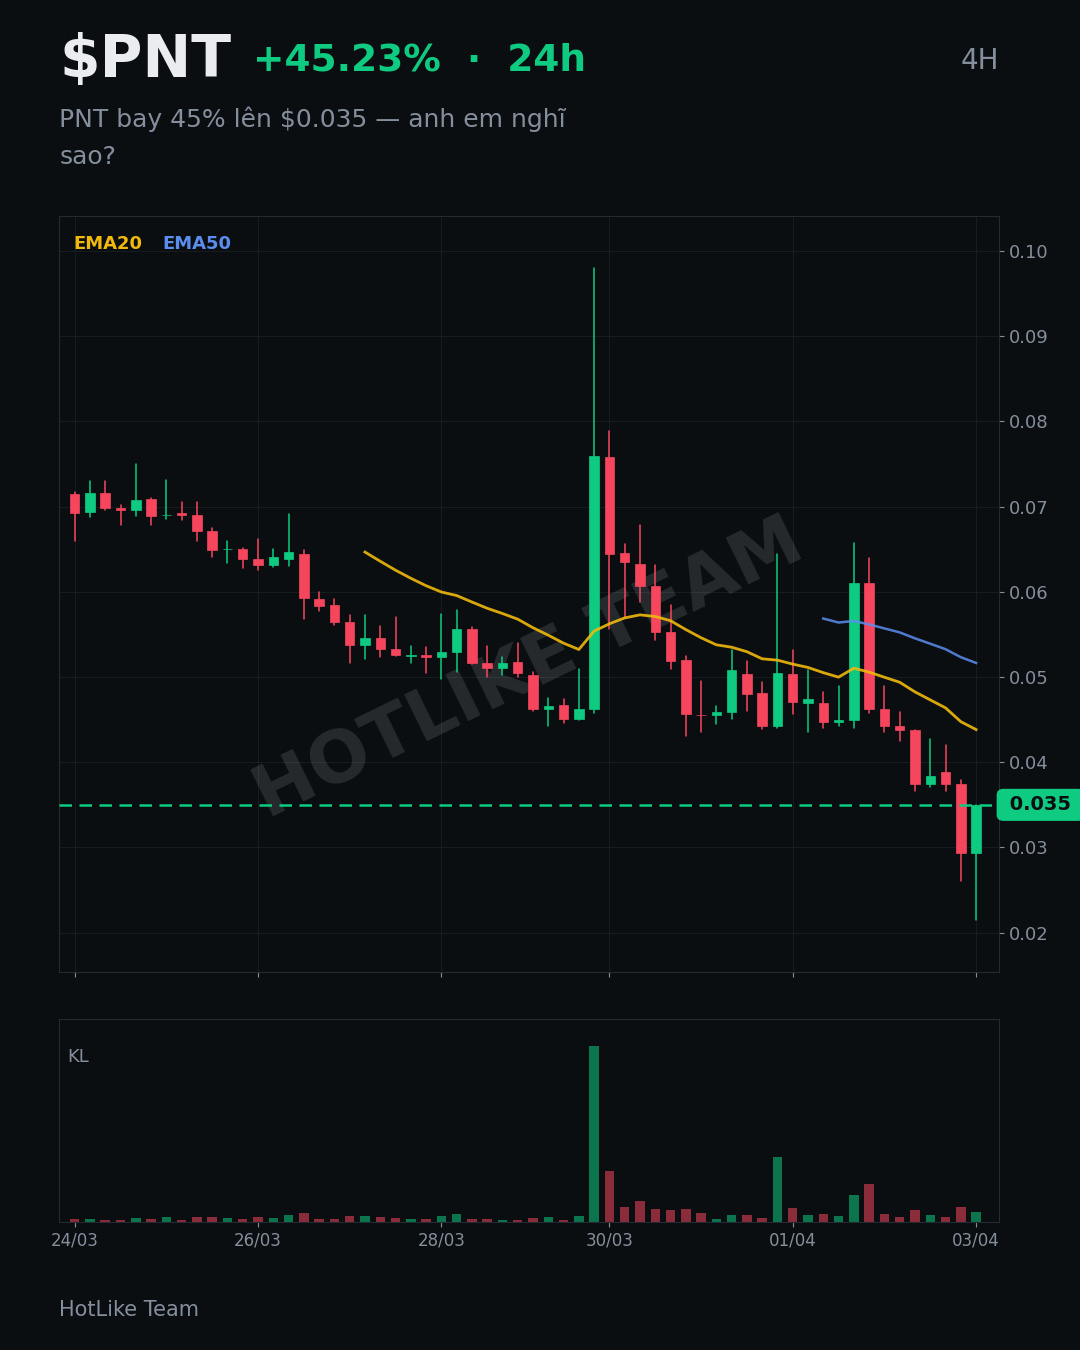
PNT soars 45% to $0.035 — what do you guys think?
I checked the price board this morning and was stunned: $PNT is skyrocketing, currently at $0.035 (+45.23% in 24h) 🔥. Seeing $BMT and $HOT also firmly in the green makes it feel like money is really flowing back into the market. Things sure look completely different when the market sentiment shifts.
This is just my personal opinion, not investment advice. Do you think PNT is about to climb even higher, or will it turn around and correct? Share your thoughts!
#PNT
PNT soars 45% to $0.035 — what do you guys think?
I checked the price board this morning and was stunned: $PNT is skyrocketing, currently at $0.035 (+45.23% in 24h) 🔥. Seeing $BMT and $HOT also firmly in the green makes it feel like money is really flowing back into the market. Things sure look completely different when the market sentiment shifts.
This is just my personal opinion, not investment advice. Do you think PNT is about to climb even higher, or will it turn around and correct? Share your thoughts!
#PNT
I checked the price board this morning and was stunned: $PNT is skyrocketing, currently at $0.035 (+45.23% in 24h) 🔥. Seeing $BMT and $HOT also firmly in the green makes it feel like money is really flowing back into the market. Things sure look completely different when the market sentiment shifts.
This is just my personal opinion, not investment advice. Do you think PNT is about to climb even higher, or will it turn around and correct? Share your thoughts!
#PNT
82
·
--
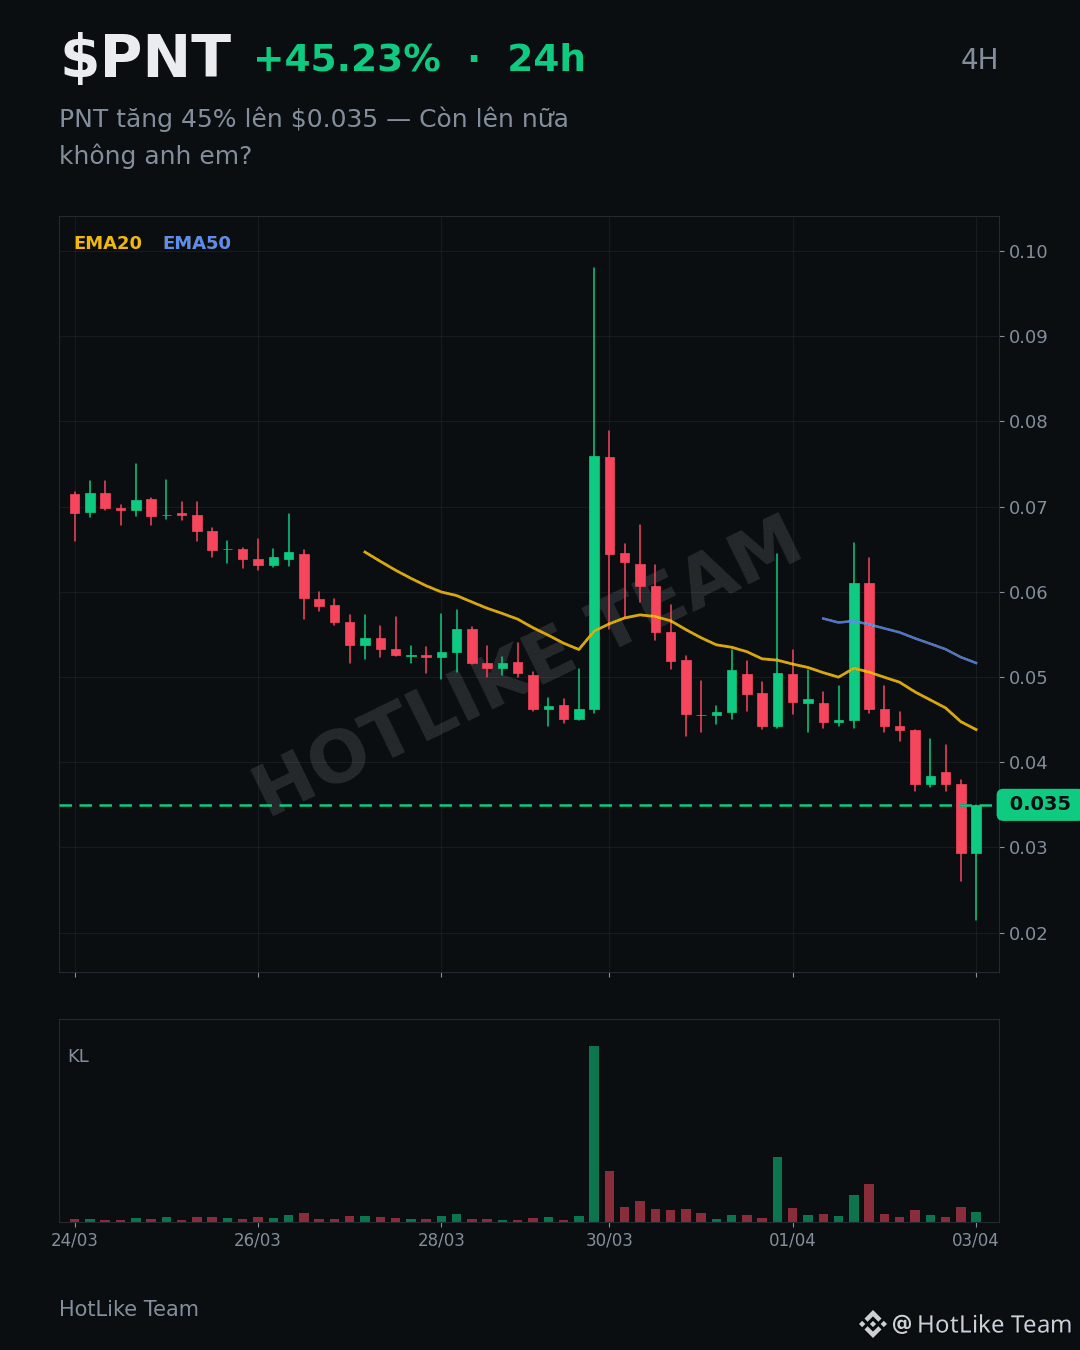
PNT is up 45% to $0.035 — Is it going even higher?
Woke up this morning to see $PNT soaring—it’s now hit $0.035, up more than 45.23% in 24 hours. 🔥
$HAEDAL and $SHELL are also looking bright green, and the market seems to be showing signs of a real recovery. It really feels like crypto spring is on the way!
Just my personal opinion, not investment advice. Do you think PNT is about to fly even higher, or will we see a correction?
#PNT
PNT is up 45% to $0.035 — Is it going even higher?
Woke up this morning to see $PNT soaring—it’s now hit $0.035, up more than 45.23% in 24 hours. 🔥
$HAEDAL and $SHELL are also looking bright green, and the market seems to be showing signs of a real recovery. It really feels like crypto spring is on the way!
Just my personal opinion, not investment advice. Do you think PNT is about to fly even higher, or will we see a correction?
#PNT
Woke up this morning to see $PNT soaring—it’s now hit $0.035, up more than 45.23% in 24 hours. 🔥
$HAEDAL and $SHELL are also looking bright green, and the market seems to be showing signs of a real recovery. It really feels like crypto spring is on the way!
Just my personal opinion, not investment advice. Do you think PNT is about to fly even higher, or will we see a correction?
#PNT
19

·
--
# #PNT
A 45.23% positive move and a sudden spike in volume present a major opportunity for PNT. However, after an extreme move accompanied by normal volume activity, investors should exercise caution.
# #CREAM
A 65.35% negative change and a spike in volume indicate that CREAM has reached a critical turning point. Technically, this situation may offer high-risk, high-reward potential, but investors should exercise caution and set stop-loss orders.
# #PNT
A 45.23% positive move and a sudden spike in volume present a major opportunity for PNT. However, after an extreme move accompanied by normal volume activity, investors should exercise caution.
# #CREAM
A 65.35% negative change and a spike in volume indicate that CREAM has reached a critical turning point. Technically, this situation may offer high-risk, high-reward potential, but investors should exercise caution and set stop-loss orders.
A 45.23% positive move and a sudden spike in volume present a major opportunity for PNT. However, after an extreme move accompanied by normal volume activity, investors should exercise caution.
# #CREAM
A 65.35% negative change and a spike in volume indicate that CREAM has reached a critical turning point. Technically, this situation may offer high-risk, high-reward potential, but investors should exercise caution and set stop-loss orders.
24
·
--
# #PNT
PNT's extreme positive move of 45.23% and sudden volume spike point to a rapid short-term correlation correction and a potential fishing opportunity. Technical analysts say PNT has the potential for a rapid and extreme rebound, while the high-volume spike could also be a sign that current developments indicate a genuine change in trend.
# #CREAM
CREAM's extreme positive move of 65.35% and high-volume spike point to a rapid correlation correction and a potential buying opportunity. Technical analysis shows that CREAM is entering a strong rebound phase, giving investors a chance to act quickly and capture potential gains.
# #PNT
PNT's extreme positive move of 45.23% and sudden volume spike point to a rapid short-term correlation correction and a potential fishing opportunity. Technical analysts say PNT has the potential for a rapid and extreme rebound, while the high-volume spike could also be a sign that current developments indicate a genuine change in trend.
# #CREAM
CREAM's extreme positive move of 65.35% and high-volume spike point to a rapid correlation correction and a potential buying opportunity. Technical analysis shows that CREAM is entering a strong rebound phase, giving investors a chance to act quickly and capture potential gains.
PNT's extreme positive move of 45.23% and sudden volume spike point to a rapid short-term correlation correction and a potential fishing opportunity. Technical analysts say PNT has the potential for a rapid and extreme rebound, while the high-volume spike could also be a sign that current developments indicate a genuine change in trend.
# #CREAM
CREAM's extreme positive move of 65.35% and high-volume spike point to a rapid correlation correction and a potential buying opportunity. Technical analysis shows that CREAM is entering a strong rebound phase, giving investors a chance to act quickly and capture potential gains.
23
·
--
# #CREAM
CREAM is up 65.35%, with a significant spike in trading volume, presenting a major technical opportunity. This extreme move offers investors an attractive entry point.
# #PNT
PNT is up 45.23% and has seen a significant spike in trading volume despite normal trading activity. If technical indicators turn positive, this could benefit investors.
# #CREAM
CREAM is up 65.35%, with a significant spike in trading volume, presenting a major technical opportunity. This extreme move offers investors an attractive entry point.
# #PNT
PNT is up 45.23% and has seen a significant spike in trading volume despite normal trading activity. If technical indicators turn positive, this could benefit investors.
CREAM is up 65.35%, with a significant spike in trading volume, presenting a major technical opportunity. This extreme move offers investors an attractive entry point.
# #PNT
PNT is up 45.23% and has seen a significant spike in trading volume despite normal trading activity. If technical indicators turn positive, this could benefit investors.
31
·
--
# #CREAM
CREAM, which has seen an extreme increase of 65.35% in the last 24 hours, may be the strongest driver of exchange movements. Technical analysts may expect a rapid shift from short-term to long-term potential following a breakout at this level.
# #PNT
PNT’s extreme 24-hour rise of over 45.23% may indicate a recurring cup pattern. However, its volume remaining at normal levels, without major volume spikes like those seen in #USDC, makes this a signal to approach a risky entry with caution.
# #CREAM
CREAM, which has seen an extreme increase of 65.35% in the last 24 hours, may be the strongest driver of exchange movements. Technical analysts may expect a rapid shift from short-term to long-term potential following a breakout at this level.
# #PNT
PNT’s extreme 24-hour rise of over 45.23% may indicate a recurring cup pattern. However, its volume remaining at normal levels, without major volume spikes like those seen in #USDC, makes this a signal to approach a risky entry with caution.
CREAM, which has seen an extreme increase of 65.35% in the last 24 hours, may be the strongest driver of exchange movements. Technical analysts may expect a rapid shift from short-term to long-term potential following a breakout at this level.
# #PNT
PNT’s extreme 24-hour rise of over 45.23% may indicate a recurring cup pattern. However, its volume remaining at normal levels, without major volume spikes like those seen in #USDC, makes this a signal to approach a risky entry with caution.
51
·
--
# #PNT
With a 45.23% extreme positive change and normal volume activity, ##PNT's surge may present a potential investment opportunity. Technical analysts may view PNT's high-volume spike as a sign of confidence that it could lead to price breakouts and a potential turning point.
# #CREAM
With a 65.35% extreme positive change and normal volume activity, ##CREAM is showing significant movement from a technical analysis perspective. This could signal breakout potential and a higher-volume trading environment for investors.
# #PNT
With a 45.23% extreme positive change and normal volume activity, ##PNT's surge may present a potential investment opportunity. Technical analysts may view PNT's high-volume spike as a sign of confidence that it could lead to price breakouts and a potential turning point.
# #CREAM
With a 65.35% extreme positive change and normal volume activity, ##CREAM is showing significant movement from a technical analysis perspective. This could signal breakout potential and a higher-volume trading environment for investors.
With a 45.23% extreme positive change and normal volume activity, ##PNT's surge may present a potential investment opportunity. Technical analysts may view PNT's high-volume spike as a sign of confidence that it could lead to price breakouts and a potential turning point.
# #CREAM
With a 65.35% extreme positive change and normal volume activity, ##CREAM is showing significant movement from a technical analysis perspective. This could signal breakout potential and a higher-volume trading environment for investors.
13
·
--
# #PNT
PNT's 24-hour change, reaching 45.23%, indicates an extreme price movement. However, normal trading volume may mean a high risk of a correction. Investors may face the risk of the price falling again.
# #CREAM
CREAM's 24-hour change, reaching 65.35%, highlights rapid price movement. However, remaining at normal volume levels reduces the risk of a correction. It is important to remember that this investment carries high risk alongside its potential returns.
# #PNT
PNT's 24-hour change, reaching 45.23%, indicates an extreme price movement. However, normal trading volume may mean a high risk of a correction. Investors may face the risk of the price falling again.
# #CREAM
CREAM's 24-hour change, reaching 65.35%, highlights rapid price movement. However, remaining at normal volume levels reduces the risk of a correction. It is important to remember that this investment carries high risk alongside its potential returns.
PNT's 24-hour change, reaching 45.23%, indicates an extreme price movement. However, normal trading volume may mean a high risk of a correction. Investors may face the risk of the price falling again.
# #CREAM
CREAM's 24-hour change, reaching 65.35%, highlights rapid price movement. However, remaining at normal volume levels reduces the risk of a correction. It is important to remember that this investment carries high risk alongside its potential returns.
13
·
--
# #PNT
It is showing a recent price surge and a 24-hour change of 45.23%. Technical analysts say PNT's trend has reached a turning point and suggest expecting potential price volatility. However, the combination of an extreme change and normal volume suggests investors should exercise caution and use risk management strategies.
# #CREAM
With a 24-hour change of 65.35%, CREAM may be the most technically extreme asset. Technical analysis indicates that the price is testing a support level and suggests waiting to see whether it enters a potentially larger trend. However, given that the price is falling rapidly, investors should assess the risks and follow the necessary protocols.
# #PNT
It is showing a recent price surge and a 24-hour change of 45.23%. Technical analysts say PNT's trend has reached a turning point and suggest expecting potential price volatility. However, the combination of an extreme change and normal volume suggests investors should exercise caution and use risk management strategies.
# #CREAM
With a 24-hour change of 65.35%, CREAM may be the most technically extreme asset. Technical analysis indicates that the price is testing a support level and suggests waiting to see whether it enters a potentially larger trend. However, given that the price is falling rapidly, investors should assess the risks and follow the necessary protocols.
It is showing a recent price surge and a 24-hour change of 45.23%. Technical analysts say PNT's trend has reached a turning point and suggest expecting potential price volatility. However, the combination of an extreme change and normal volume suggests investors should exercise caution and use risk management strategies.
# #CREAM
With a 24-hour change of 65.35%, CREAM may be the most technically extreme asset. Technical analysis indicates that the price is testing a support level and suggests waiting to see whether it enters a potentially larger trend. However, given that the price is falling rapidly, investors should assess the risks and follow the necessary protocols.
20
·
--
# #PNT
A sudden spike in volume accompanying a 45.23% rise is drawing considerable interest from investors analyzing PNT from a technical perspective. This high volume and price movement indicate growing short-term potential for the asset.
# #CREAM
A 65.35% rise and a sharp spike in 24-hour volume are catching the attention of those analyzing CREAM. From a technical analysis perspective, these factors point to a short-term trend and an investment opportunity.
# #PNT
A sudden spike in volume accompanying a 45.23% rise is drawing considerable interest from investors analyzing PNT from a technical perspective. This high volume and price movement indicate growing short-term potential for the asset.
# #CREAM
A 65.35% rise and a sharp spike in 24-hour volume are catching the attention of those analyzing CREAM. From a technical analysis perspective, these factors point to a short-term trend and an investment opportunity.
A sudden spike in volume accompanying a 45.23% rise is drawing considerable interest from investors analyzing PNT from a technical perspective. This high volume and price movement indicate growing short-term potential for the asset.
# #CREAM
A 65.35% rise and a sharp spike in 24-hour volume are catching the attention of those analyzing CREAM. From a technical analysis perspective, these factors point to a short-term trend and an investment opportunity.
13
·
--
# #CREAM
Due to its 65.35% extreme positive movement and a surge in trading volume to 276.098.07 USDT, #CREAM is likely to re-enter an uptrend. Technical analysis indicators RSI and MACD are giving positive signals. This presents investors with an opportunity to benefit from potential investments.
# #PNT
The 45.23% extreme positive movement and a surge in trading volume to 261.845.06 USDT indicate that #PNT has the potential to move upward. Technical analysis shows that PNT has seen a high-volume increase, which may lead to expectations of further gains in the coming days. However, the possibility of a reversal following a rapid increase should also be taken into account.
# #CREAM
Due to its 65.35% extreme positive movement and a surge in trading volume to 276.098.07 USDT, #CREAM is likely to re-enter an uptrend. Technical analysis indicators RSI and MACD are giving positive signals. This presents investors with an opportunity to benefit from potential investments.
# #PNT
The 45.23% extreme positive movement and a surge in trading volume to 261.845.06 USDT indicate that #PNT has the potential to move upward. Technical analysis shows that PNT has seen a high-volume increase, which may lead to expectations of further gains in the coming days. However, the possibility of a reversal following a rapid increase should also be taken into account.
Due to its 65.35% extreme positive movement and a surge in trading volume to 276.098.07 USDT, #CREAM is likely to re-enter an uptrend. Technical analysis indicators RSI and MACD are giving positive signals. This presents investors with an opportunity to benefit from potential investments.
# #PNT
The 45.23% extreme positive movement and a surge in trading volume to 261.845.06 USDT indicate that #PNT has the potential to move upward. Technical analysis shows that PNT has seen a high-volume increase, which may lead to expectations of further gains in the coming days. However, the possibility of a reversal following a rapid increase should also be taken into account.
10
·
--
# #PNT
PNT posted an unprecedented 45.23% increase, making it the coin with the most extreme technical movement. A sudden spike in volume was also observed. This presents PNT as a potential investment opportunity, but it also carries significant risk.
# #CREAM
CREAM’s 65.35% rise, accompanied by a sudden spike in volume, marked the most critical technical movement. However, more data is needed to determine the direction of the price movement with certainty. Investors should examine CREAM carefully and adopt risk management strategies.
# #PNT
PNT posted an unprecedented 45.23% increase, making it the coin with the most extreme technical movement. A sudden spike in volume was also observed. This presents PNT as a potential investment opportunity, but it also carries significant risk.
# #CREAM
CREAM’s 65.35% rise, accompanied by a sudden spike in volume, marked the most critical technical movement. However, more data is needed to determine the direction of the price movement with certainty. Investors should examine CREAM carefully and adopt risk management strategies.
PNT posted an unprecedented 45.23% increase, making it the coin with the most extreme technical movement. A sudden spike in volume was also observed. This presents PNT as a potential investment opportunity, but it also carries significant risk.
# #CREAM
CREAM’s 65.35% rise, accompanied by a sudden spike in volume, marked the most critical technical movement. However, more data is needed to determine the direction of the price movement with certainty. Investors should examine CREAM carefully and adopt risk management strategies.
7
+45% in 24 hours.
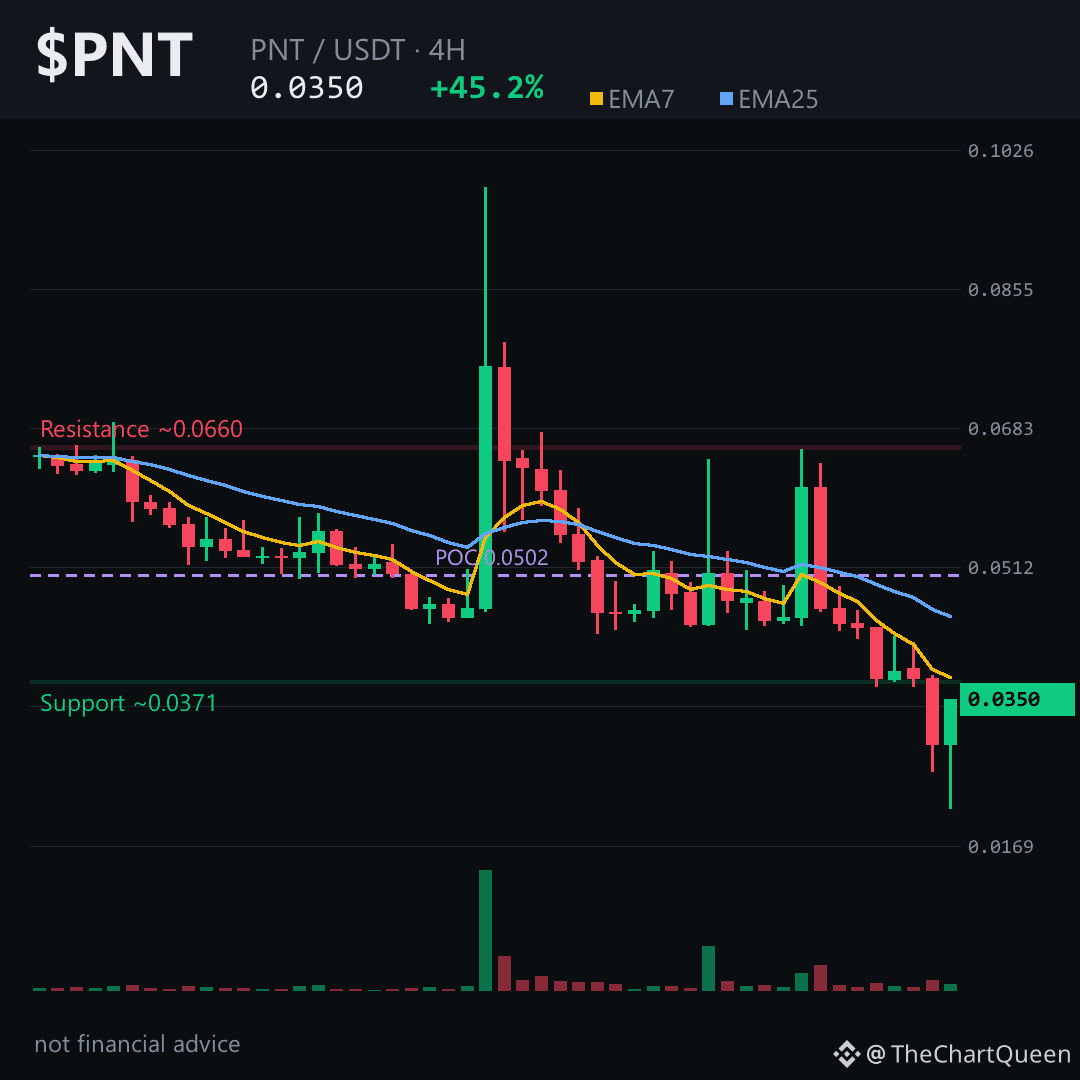
But the 4-hour chart tells a different story — a 62% range where the only thing consistent is lower highs.
$PNT is currently sitting near the 0.035 area, right where the last green candle closed. The structure on the 4H remains bearish. Price is below both short-term EMAs, RSI is hovering near 40 — not oversold, just weak. The volume spike came early, then faded. That’s distribution, not accumulation.
The cleanest read is the 4H picture. The pivot sits around the 0.035 zone. If that holds as resistance, the path of least resistance points toward the low 0.032 area. Invalidation is simple: a 4H close back above roughly 0.037 and the bearish structure starts to break down.
The daily is even heavier — RSI at 27, price trading miles below the 0.096 area. Bounces here are sharp but short-lived. The broader trend hasn’t turned.
My read: this is a momentum fade, not a trend reversal. The real risk is assuming the green 24-hour number means strength. It’s a bounce inside a downtrend.
Tap $PNT to pull up the chart and check the 0.035 pivot yourself. I’ll keep tracking whether that level rejects or flips — follow for the updated read.
Which level are you watching on $PNT — the 0.035 pivot or the 0.032 extension? 👇
⚠️ Not financial advice. DYOR.
#PNT #Crypto #BinanceSquare
+45% in 24 hours.
But the 4-hour chart tells a different story — a 62% range where the only thing consistent is lower highs.
$PNT is currently sitting near the 0.035 area, right where the last green candle closed. The structure on the 4H remains bearish. Price is below both short-term EMAs, RSI is hovering near 40 — not oversold, just weak. The volume spike came early, then faded. That’s distribution, not accumulation.
The cleanest read is the 4H picture. The pivot sits around the 0.035 zone. If that holds as resistance, the path of least resistance points toward the low 0.032 area. Invalidation is simple: a 4H close back above roughly 0.037 and the bearish structure starts to break down.
The daily is even heavier — RSI at 27, price trading miles below the 0.096 area. Bounces here are sharp but short-lived. The broader trend hasn’t turned.
My read: this is a momentum fade, not a trend reversal. The real risk is assuming the green 24-hour number means strength. It’s a bounce inside a downtrend.
Tap $PNT to pull up the chart and check the 0.035 pivot yourself. I’ll keep tracking whether that level rejects or flips — follow for the updated read.
Which level are you watching on $PNT — the 0.035 pivot or the 0.032 extension? 👇
⚠️ Not financial advice. DYOR.
#PNT #Crypto #BinanceSquare
But the 4-hour chart tells a different story — a 62% range where the only thing consistent is lower highs.
$PNT is currently sitting near the 0.035 area, right where the last green candle closed. The structure on the 4H remains bearish. Price is below both short-term EMAs, RSI is hovering near 40 — not oversold, just weak. The volume spike came early, then faded. That’s distribution, not accumulation.
The cleanest read is the 4H picture. The pivot sits around the 0.035 zone. If that holds as resistance, the path of least resistance points toward the low 0.032 area. Invalidation is simple: a 4H close back above roughly 0.037 and the bearish structure starts to break down.
The daily is even heavier — RSI at 27, price trading miles below the 0.096 area. Bounces here are sharp but short-lived. The broader trend hasn’t turned.
My read: this is a momentum fade, not a trend reversal. The real risk is assuming the green 24-hour number means strength. It’s a bounce inside a downtrend.
Tap $PNT to pull up the chart and check the 0.035 pivot yourself. I’ll keep tracking whether that level rejects or flips — follow for the updated read.
Which level are you watching on $PNT — the 0.035 pivot or the 0.032 extension? 👇
⚠️ Not financial advice. DYOR.
#PNT #Crypto #BinanceSquare
6
·
--
# #PNT
PNT has shown an extreme 45.23% surge, bringing high volatility and potential profit opportunities. However, with normal trading volume, the risk remains high. Investors should take advantage of the opportunity to act quickly while waiting for the trend to realign.
# #CREAM
With a 65.35% surge and a volume spike of 276.098.07 USDT, CREAM has become a major point of interest for technical analysts. However, given the normal trading volume, they should bear in mind that rapid price movements in this situation may carry greater risk.
# #PNT
PNT has shown an extreme 45.23% surge, bringing high volatility and potential profit opportunities. However, with normal trading volume, the risk remains high. Investors should take advantage of the opportunity to act quickly while waiting for the trend to realign.
# #CREAM
With a 65.35% surge and a volume spike of 276.098.07 USDT, CREAM has become a major point of interest for technical analysts. However, given the normal trading volume, they should bear in mind that rapid price movements in this situation may carry greater risk.
PNT has shown an extreme 45.23% surge, bringing high volatility and potential profit opportunities. However, with normal trading volume, the risk remains high. Investors should take advantage of the opportunity to act quickly while waiting for the trend to realign.
# #CREAM
With a 65.35% surge and a volume spike of 276.098.07 USDT, CREAM has become a major point of interest for technical analysts. However, given the normal trading volume, they should bear in mind that rapid price movements in this situation may carry greater risk.
10
Log in to explore more content
Join global crypto users on Binance Square
⚡️ Get latest and useful information about crypto.
💬 Trusted by the world’s largest crypto exchange.
👍 Discover real insights from verified creators.
Email / Phone number
Trending Topics
1
#HuangExitNvidiaStrategyInFocus
71,420 views
863 Discussing
2
#AnthropicRejectsIPODelayValuationinQuestion
664,283 views
5,149 Discussing
3
#BitMineReports$6.3BNetLossForFiscal2026
8,654 views
105 Discussing
4
#ChipStocksExtendLossesAfterNvidiaCEOChange
26,222 views
368 Discussing
5
#ThailandProposes$148KDailyStablecoinDepositWithdrawalCaps
2,336 views
38 Discussing
6
#CoreWeaveJumps10%On168%RevenueGrowth
174,350 views
1,611 Discussing
7
#ZcashFallsBelow$1000ForFirstTimeSinceSeptember
83,467 views
258 Discussing
8
#MSCIRemovalMayCurbStrategy’sBitcoinBuying
47,657 views
557 Discussing
9
#TradFiForBeginners
525,788 views
3,666 Discussing
10
#USJoblessClaimsRise
19.1M views
7,780 Discussing