🚨
$BTC JUST EXPLODED! 🚀 BREAKOUT OR BULL TRAP? 🐂🐻
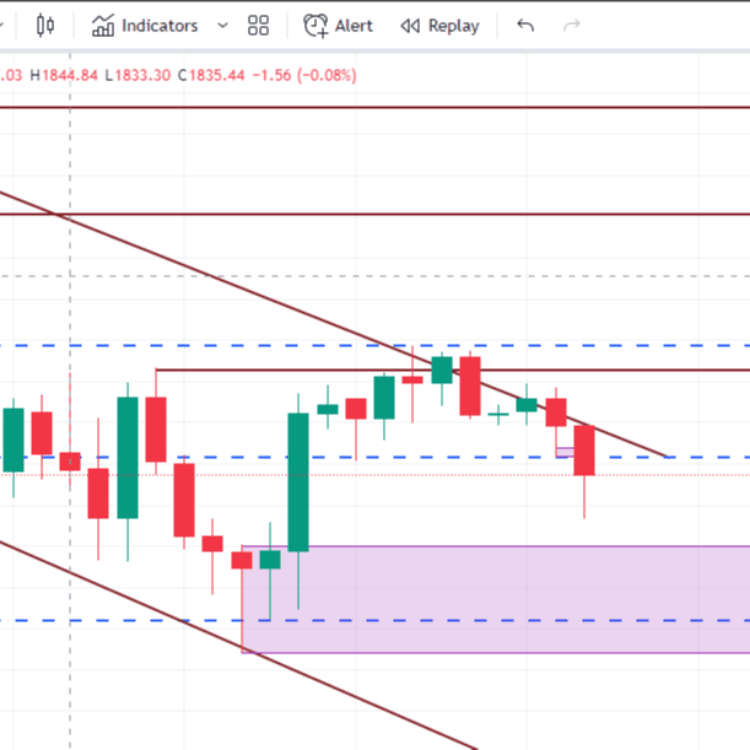
Bitcoin has delivered a powerful upside impulse, breaking above the recent consolidation and pushing toward the $84,000 liquidity zone! 🔥
🧠 BTCUSDT | TECHNICAL BREAKDOWN
💰 Current price shown: ~$83,814
📈 BULLISH SCENARIO — CONTINUATION
✅ Hold above $83,350–$83,460
🎯 Target 1: $84,000
🎯 Target 2: $84,140–$84,200
🚀 A clean breakout above resistance could open the door to further upside.
⚠️ BEARISH SCENARIO — REJECTION
❌ Rejection near $84,100–$84,200
📉 Lose $83,350 → watch $83,176
📉 Further weakness could bring $82,600 support into focus.
🔑 KEY LEVELS TO WATCH
🟥 Resistance: $84,100–$84,200
🟠 Breakout retest: $83,350–$83,460
🟢 Support: $83,176
🟢 Major demand zones: $82,550–$82,620 and $82,200
🎯 THE GAME PLAN
Don't chase the breakout candle. Watch for a confirmed close, volume confirmation and a successful retest. If price rejects resistance, reassess before entering.
The next move depends on whether buyers can defend the breakout. Momentum is bullish, but confirmation matters! ⚡
🦅 Follow Crypto Sniper Falcon for live chart breakdowns, liquidity levels and disciplined trading scenarios.
💬 YOUR CALL: BTC to $84,200 🚀 or a rejection back toward $83,176? 👇
#bitcoin #BTCUSDT #BinanceSquare #CryptoAnalysis #liquidity