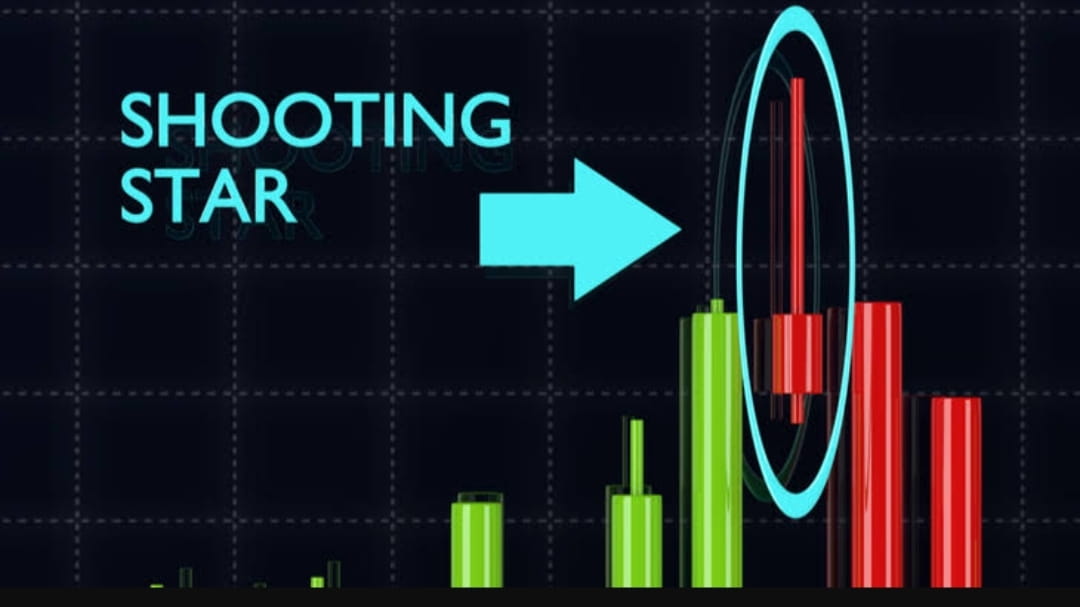

A shooting star candlestick is a type of candlestick pattern commonly found in financial charts. It is a bearish reversal pattern that occurs when the price of an asset opens higher than the previous day's close, but then falls significantly during the day, closing near or below the opening price
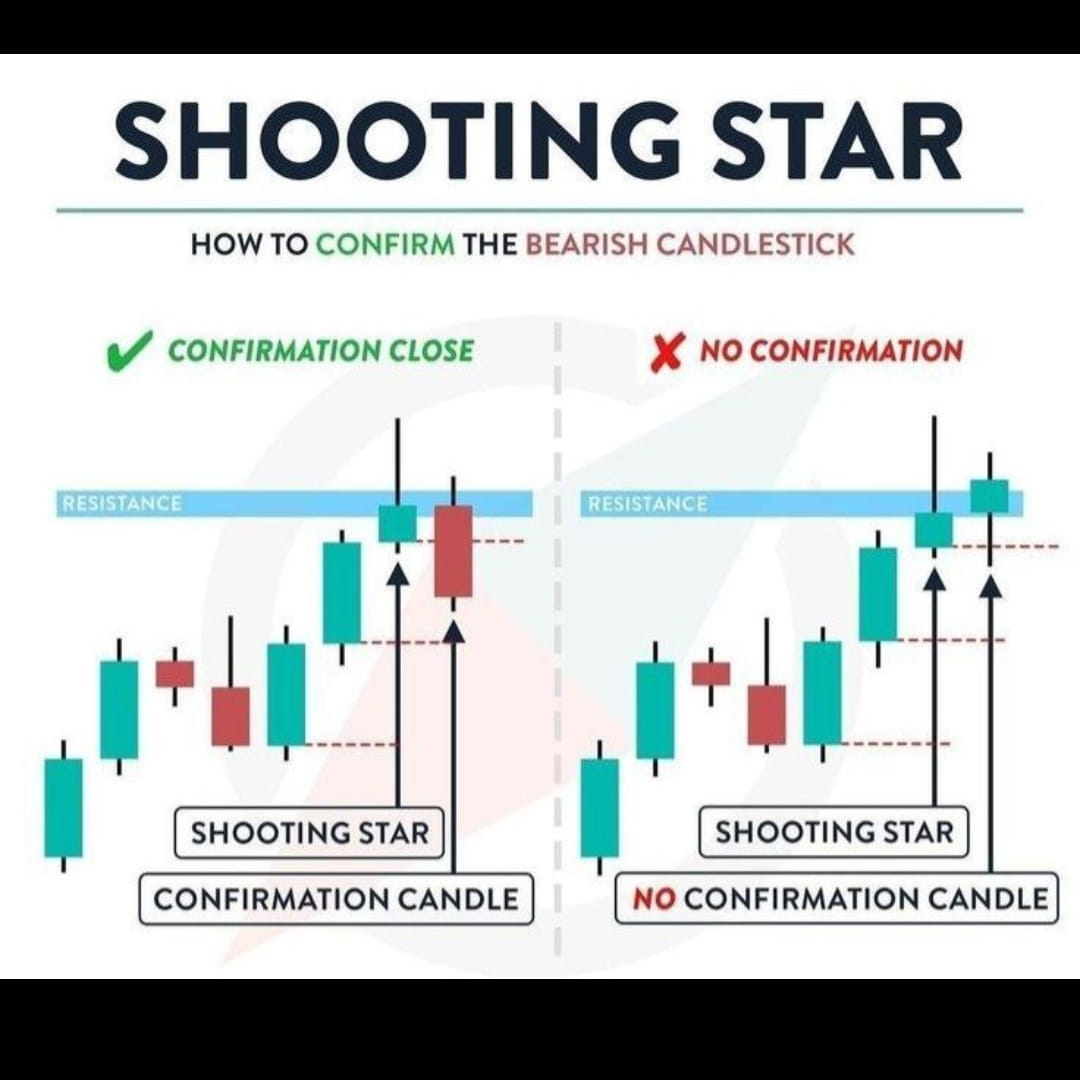
Traders and analysts often use shooting star candlesticks as a signal to sell or take profits, as they suggest a potential trend reversal from bullish to bearish. However, it is important to consider other technical indicators and market conditions before making any trading decisions based solely on this pattern.