
Something subtle is happening in $BTC Bitcoin's macro chart that most traders overlook.
Look at how $BTC behaves during major corrections relative to its previous peak-to-trough structure. Each cycle doesn't just repeat — it compresses. The violence of each drawdown has been shrinking in percentage terms, even as dollar-denominated moves get larger.
This isn't random. It reflects a maturing participant base.
In the earliest cycles, panic selling drove price 80-90% below highs. Liquidity was thin, conviction was fragile, and there was no institutional floor. Fast forward to recent cycles, and drawdowns have tightened considerably. The market remembers where value exists.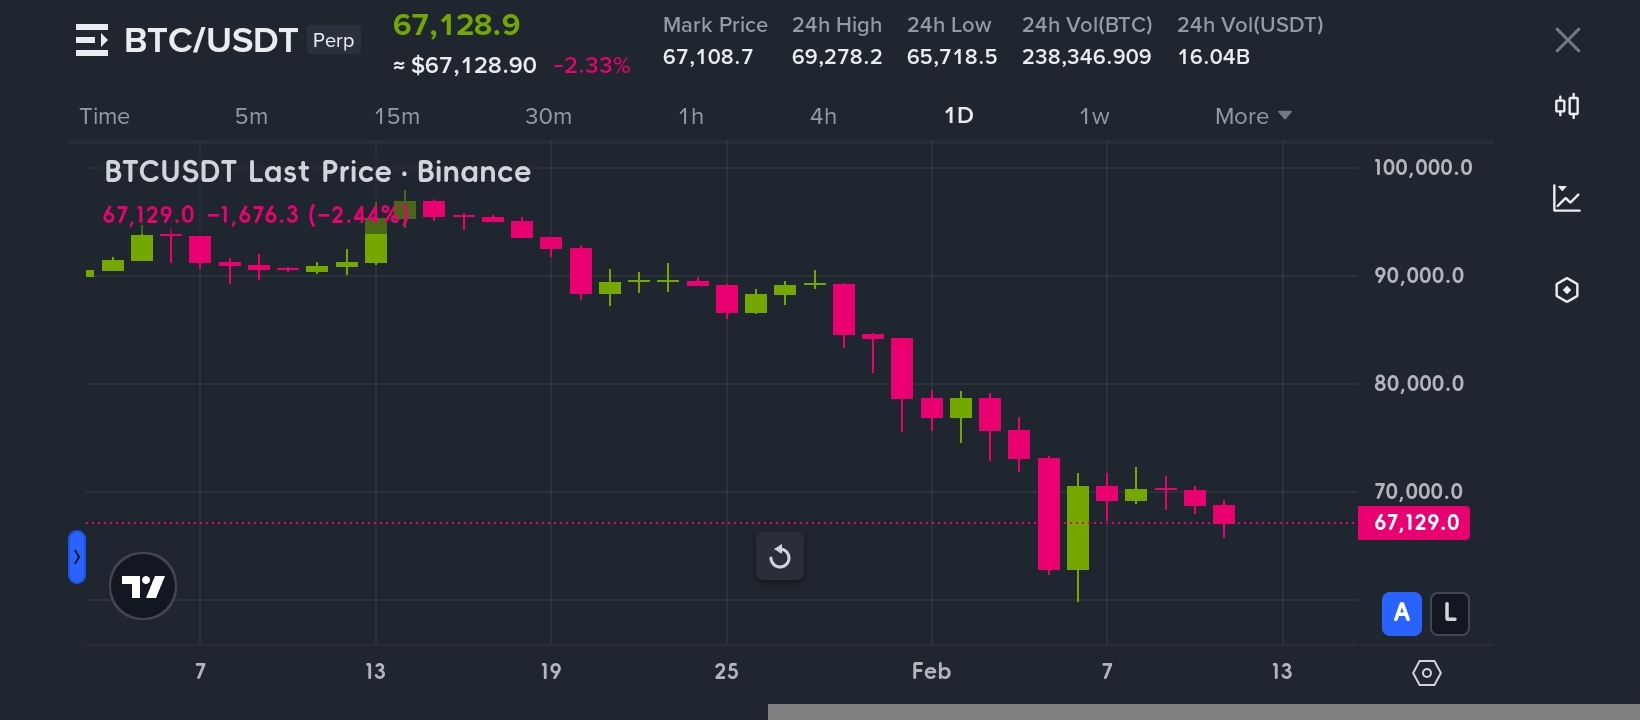
Now consider the current technical landscape. The 0.618 Fibonacci retracement from the last major impulse wave lands near $57K. That level isn't important because of math alone — it matters because enough participants treat it as meaningful. Self-fulfilling or not, these zones consistently attract aggressive spot buying.
What's worth watching is the behavioral shift around these levels. Earlier cycles saw deep, violent wicks below key retracements before any recovery materialized. Recent history shows price consolidating near these zones rather than slicing through them.
Two scenarios sit on the table. Either macro headwinds — persistent inflation, liquidity tightening, geopolitical friction — push price into a traditional deep retest. Or the structural maturity thesis holds, and this cycle produces the shallowest relative drawdown yet.
The answer probably depends less on charts and more on whether global liquidity conditions cooperate. Bitcoin has never existed through a prolonged period of genuine monetary tightening with this level of institutional integration.
That's the real experiment happening right now. Not whether Fibonacci works — but whether Bitcoin's risk profile has permanently shifted from speculative asset to macro instrument.
The chart gives clues. The macro gives context. Neither gives certainty.
