
林奇交易员
2.1k Posts

林奇交易员
Report
Block User
立志成为靠交易而生的交易员,100%按照自己的系统,机械执行任何每一笔单子!
Open Trade
Frequent Trader
7.2 Years
118 Following
1.8K+ Followers
4.8K+ Liked
Posts
Portfolio
All
Quotes
Videos
Live
PINNED
·
--
Fight for survival! $BTC $XAU
{future}(XAUUSDT)
{future}(BTCUSDT)
Fight for survival! $BTC $XAU

1
117

·
--
Bullish
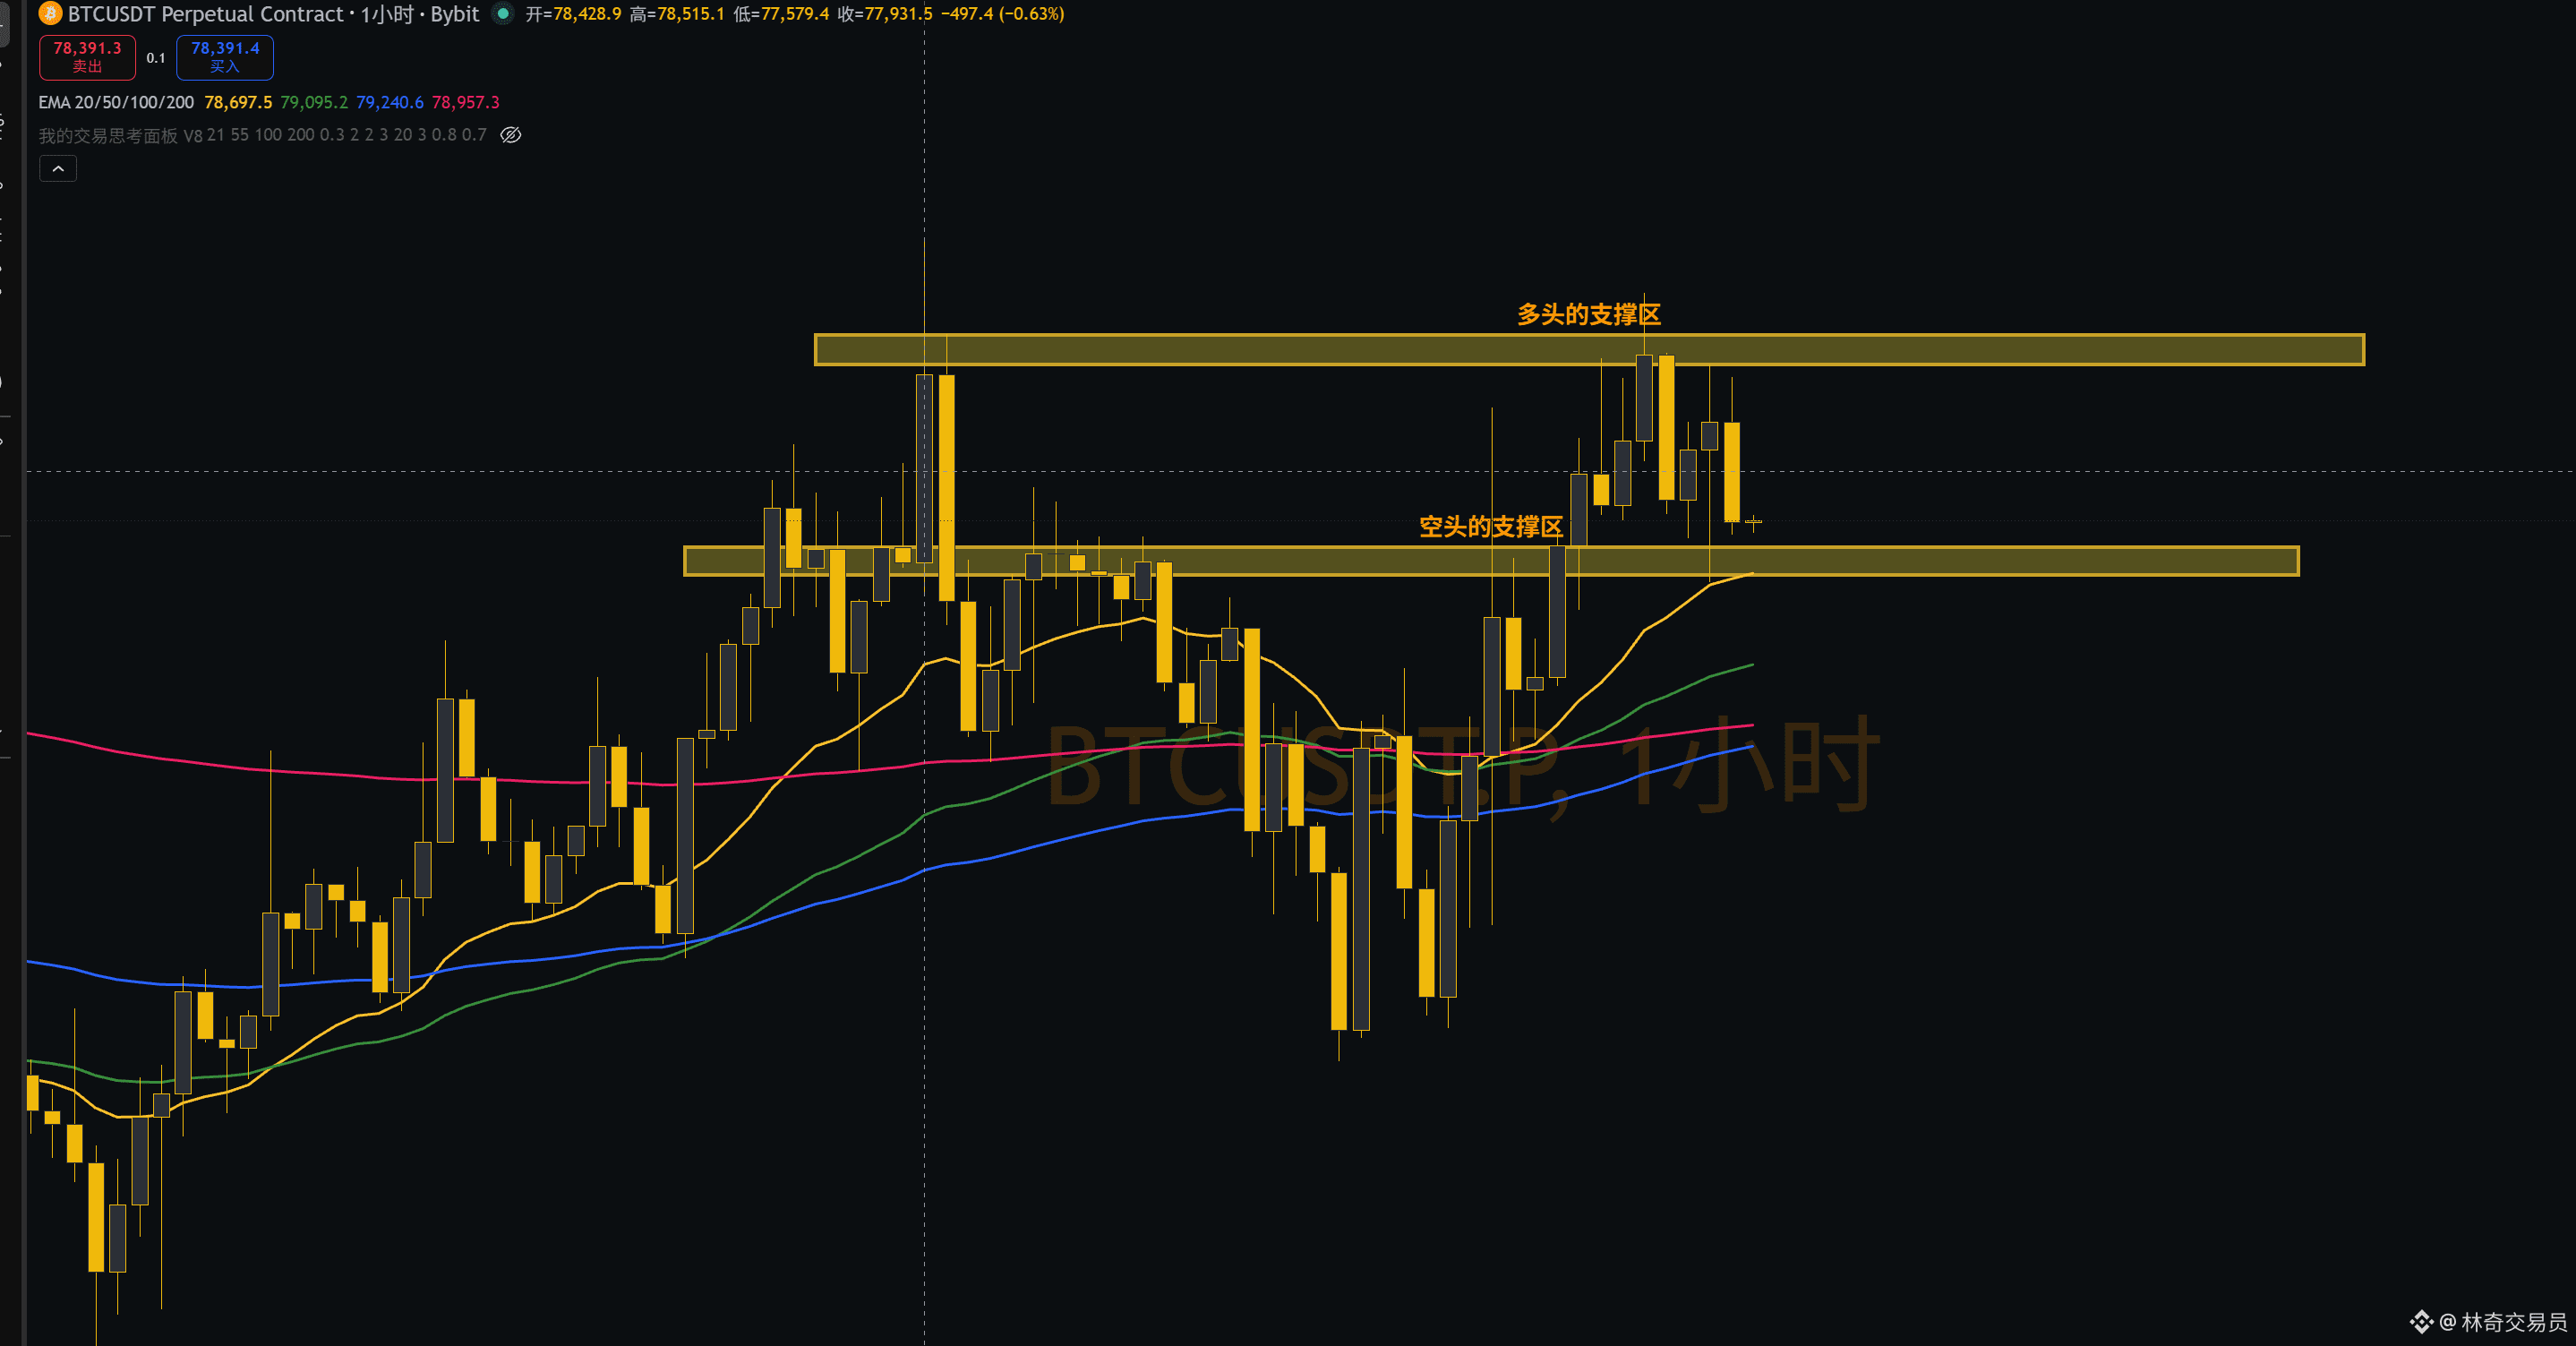
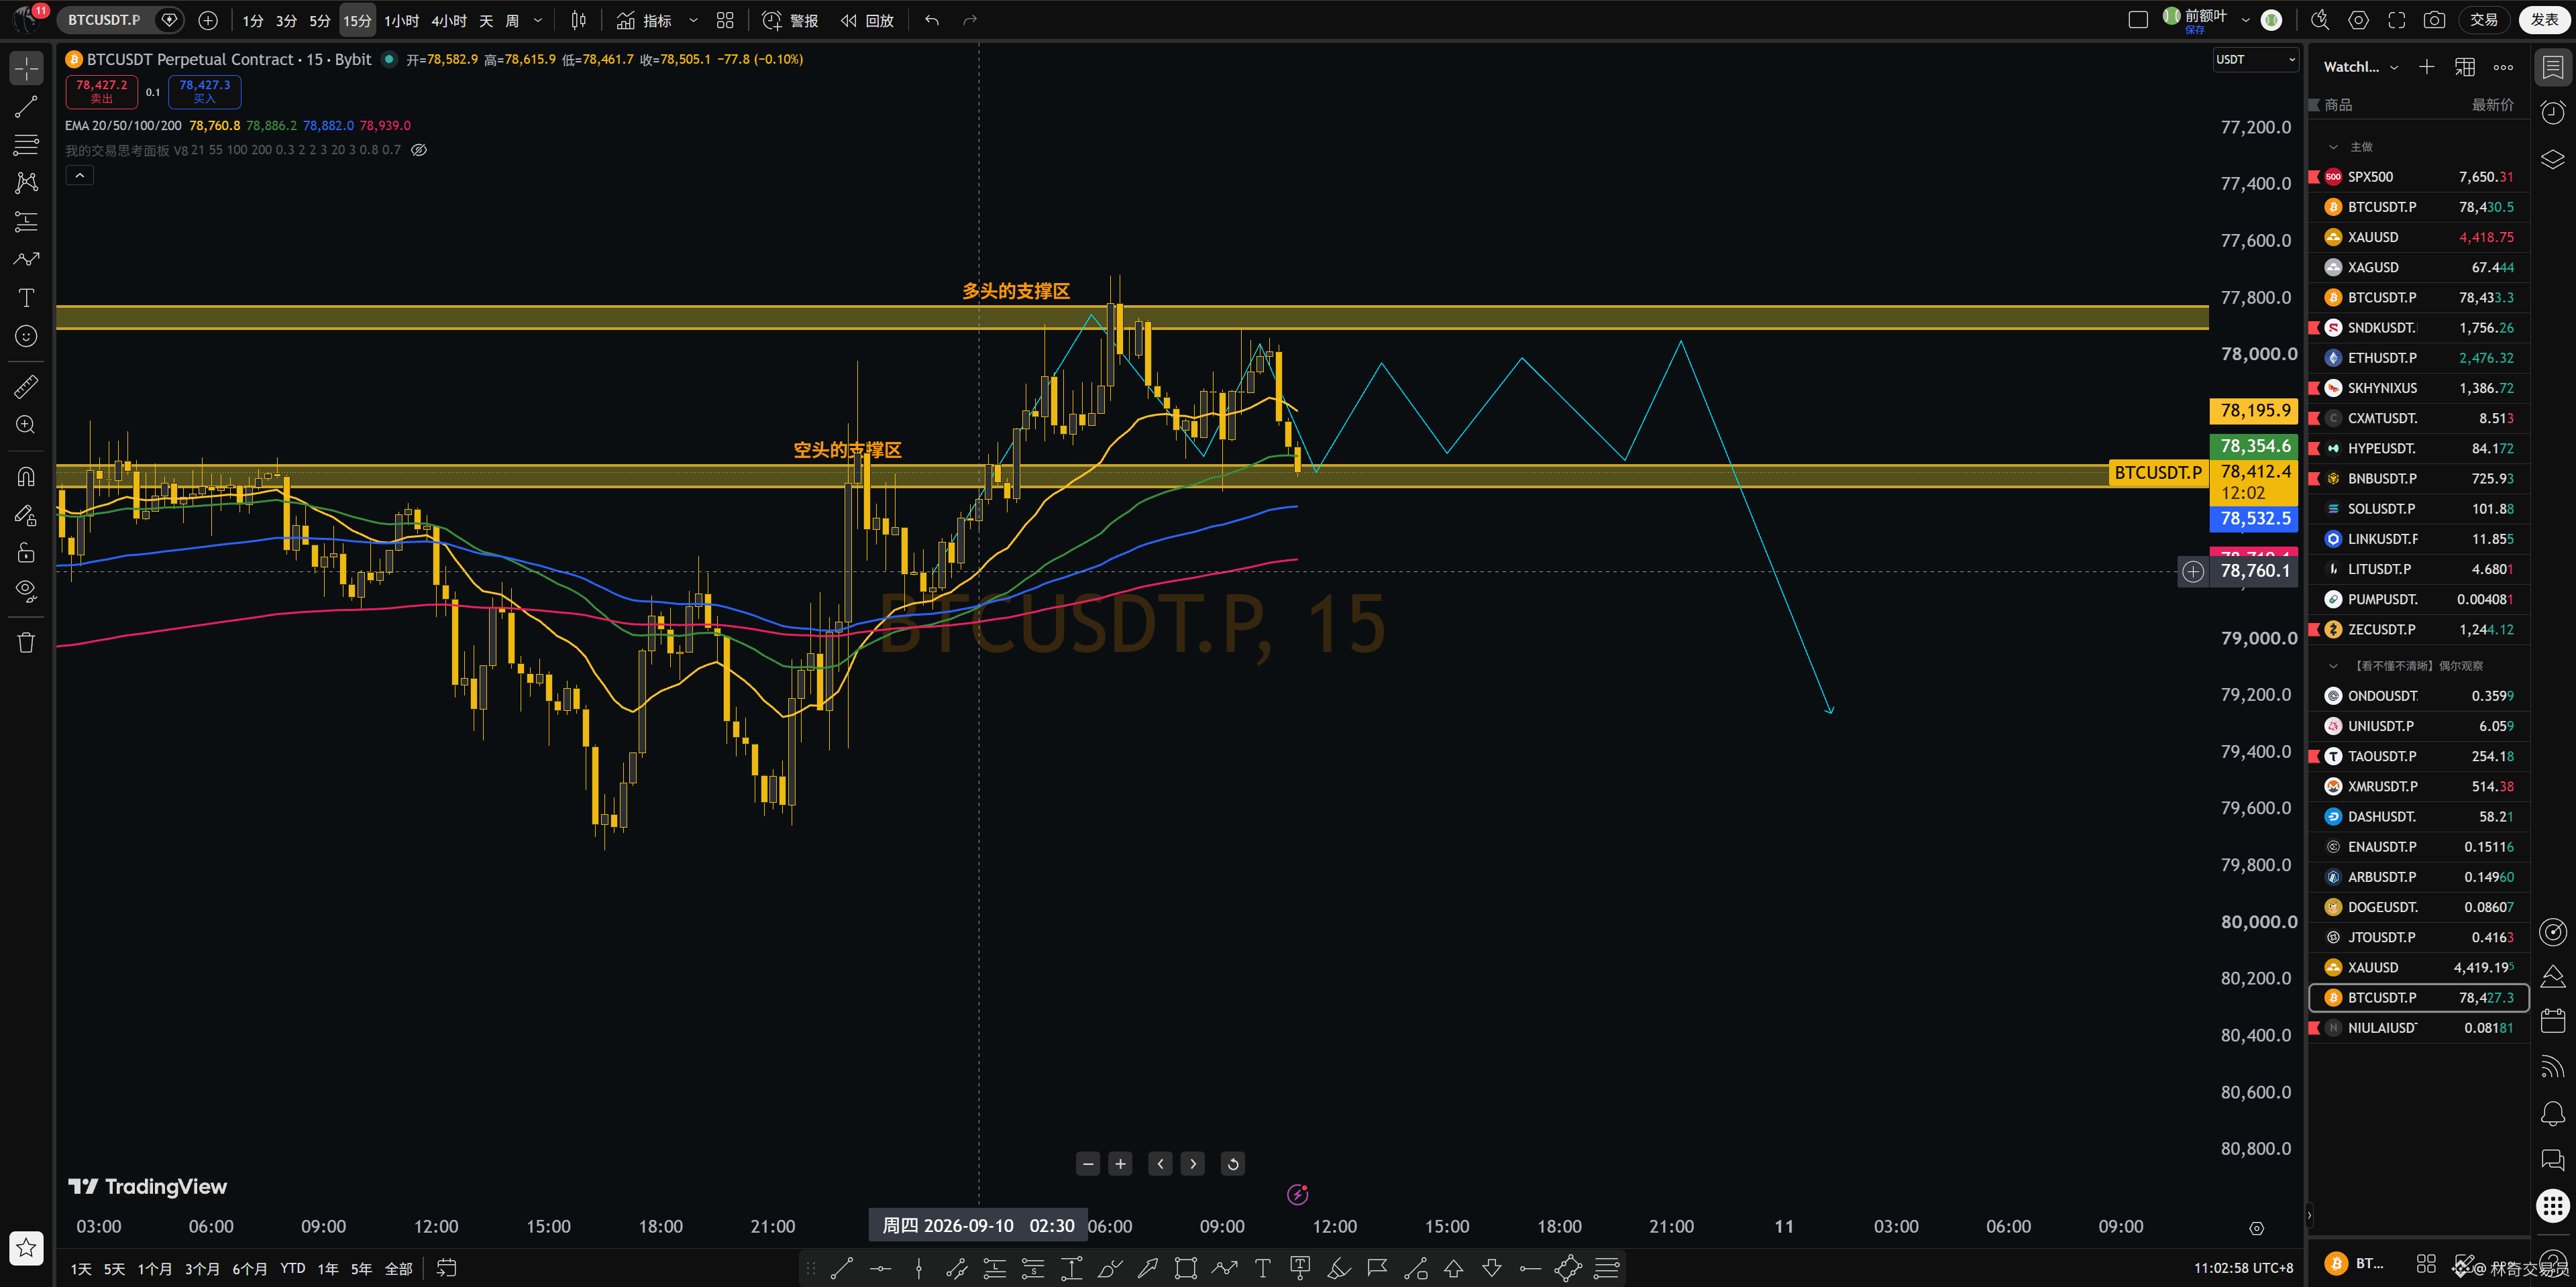
$BTC There is a bullish logic for Bitcoin. In my system, I wouldn’t enter this kind of order that early. I choose to keep watching for a while. The logic for not entering yet is that the 1-hour timeframe is still showing strength, and the 15-minute timeframe also has a bullish alignment. I believe the bulls here might not be able to continue rising so smoothly.
Although it has already been broken down, I’m more inclined to think it will keep churning and ranging around here.
Of course, it would be better if it spikes higher immediately, because I would then step in on a lower timeframe. But if that doesn’t happen, I will wait for what I prefer—letting it churn around here.
How long will it churn for?
Until the 1-hour hits 21, then the bulls will try to break above it again, and ultimately achieve a valid breakout, or form a good structure.
{future}(BTCUSDT)
$BTC There is a bullish logic for Bitcoin. In my system, I wouldn’t enter this kind of order that early. I choose to keep watching for a while. The logic for not entering yet is that the 1-hour timeframe is still showing strength, and the 15-minute timeframe also has a bullish alignment. I believe the bulls here might not be able to continue rising so smoothly.
Although it has already been broken down, I’m more inclined to think it will keep churning and ranging around here.
Of course, it would be better if it spikes higher immediately, because I would then step in on a lower timeframe. But if that doesn’t happen, I will wait for what I prefer—letting it churn around here.
How long will it churn for?
Until the 1-hour hits 21, then the bulls will try to break above it again, and ultimately achieve a valid breakout, or form a good structure.
Although it has already been broken down, I’m more inclined to think it will keep churning and ranging around here.
Of course, it would be better if it spikes higher immediately, because I would then step in on a lower timeframe. But if that doesn’t happen, I will wait for what I prefer—letting it churn around here.
How long will it churn for?
Until the 1-hour hits 21, then the bulls will try to break above it again, and ultimately achieve a valid breakout, or form a good structure.
244
·
--
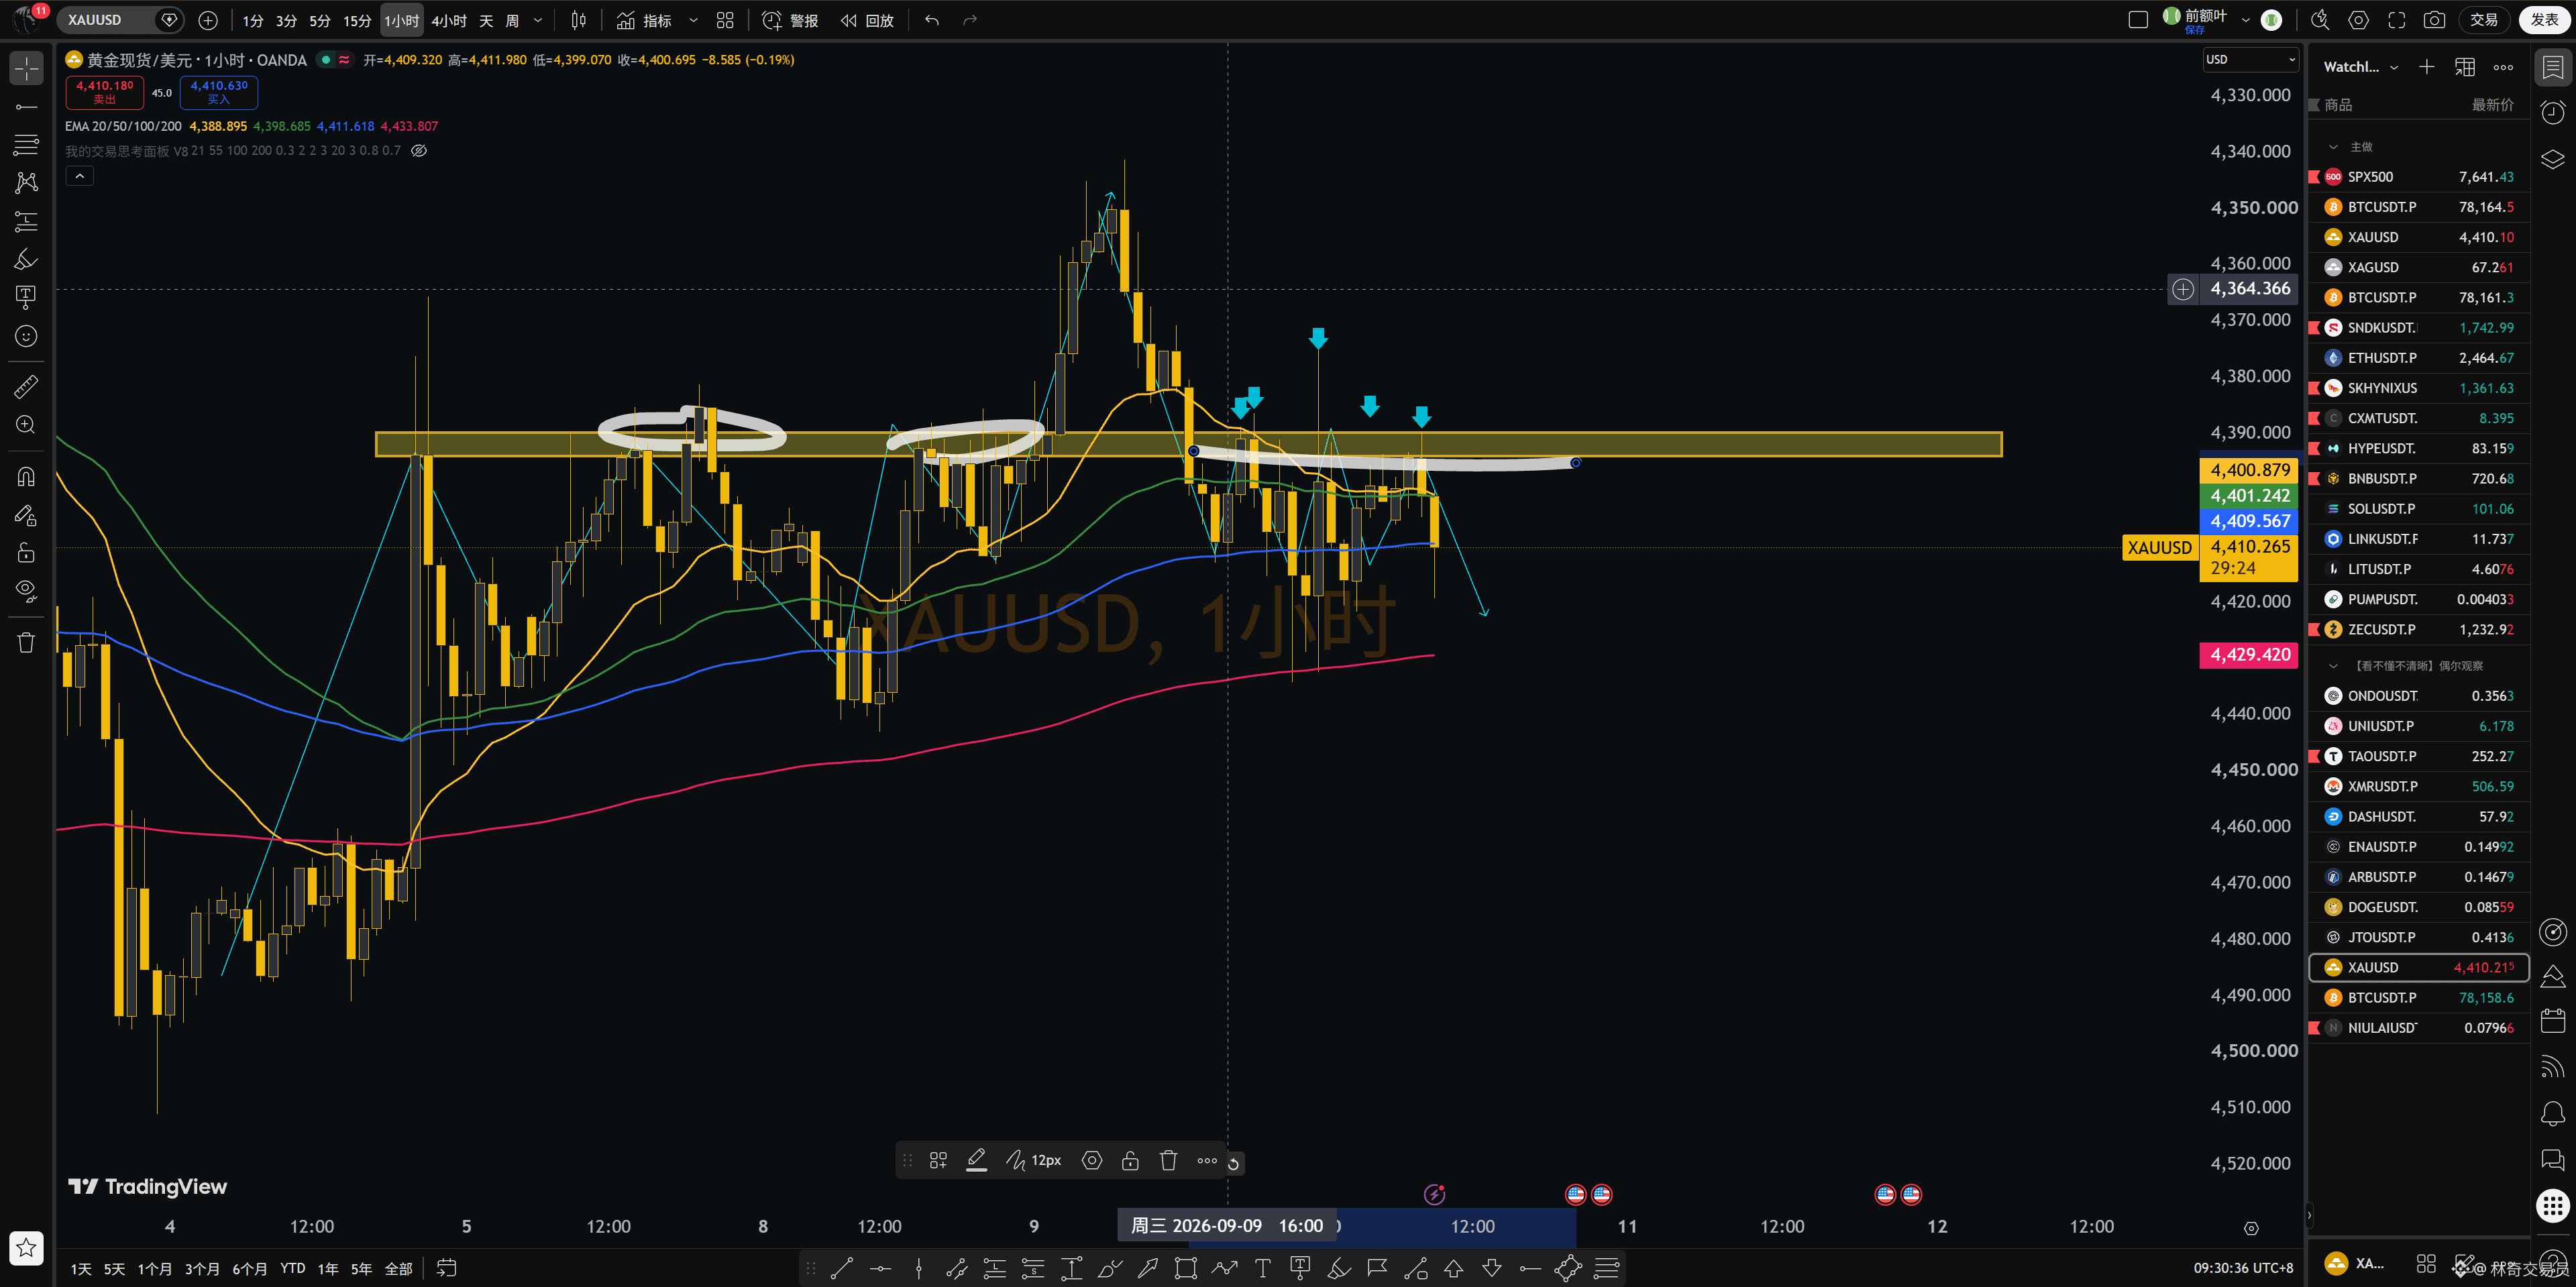
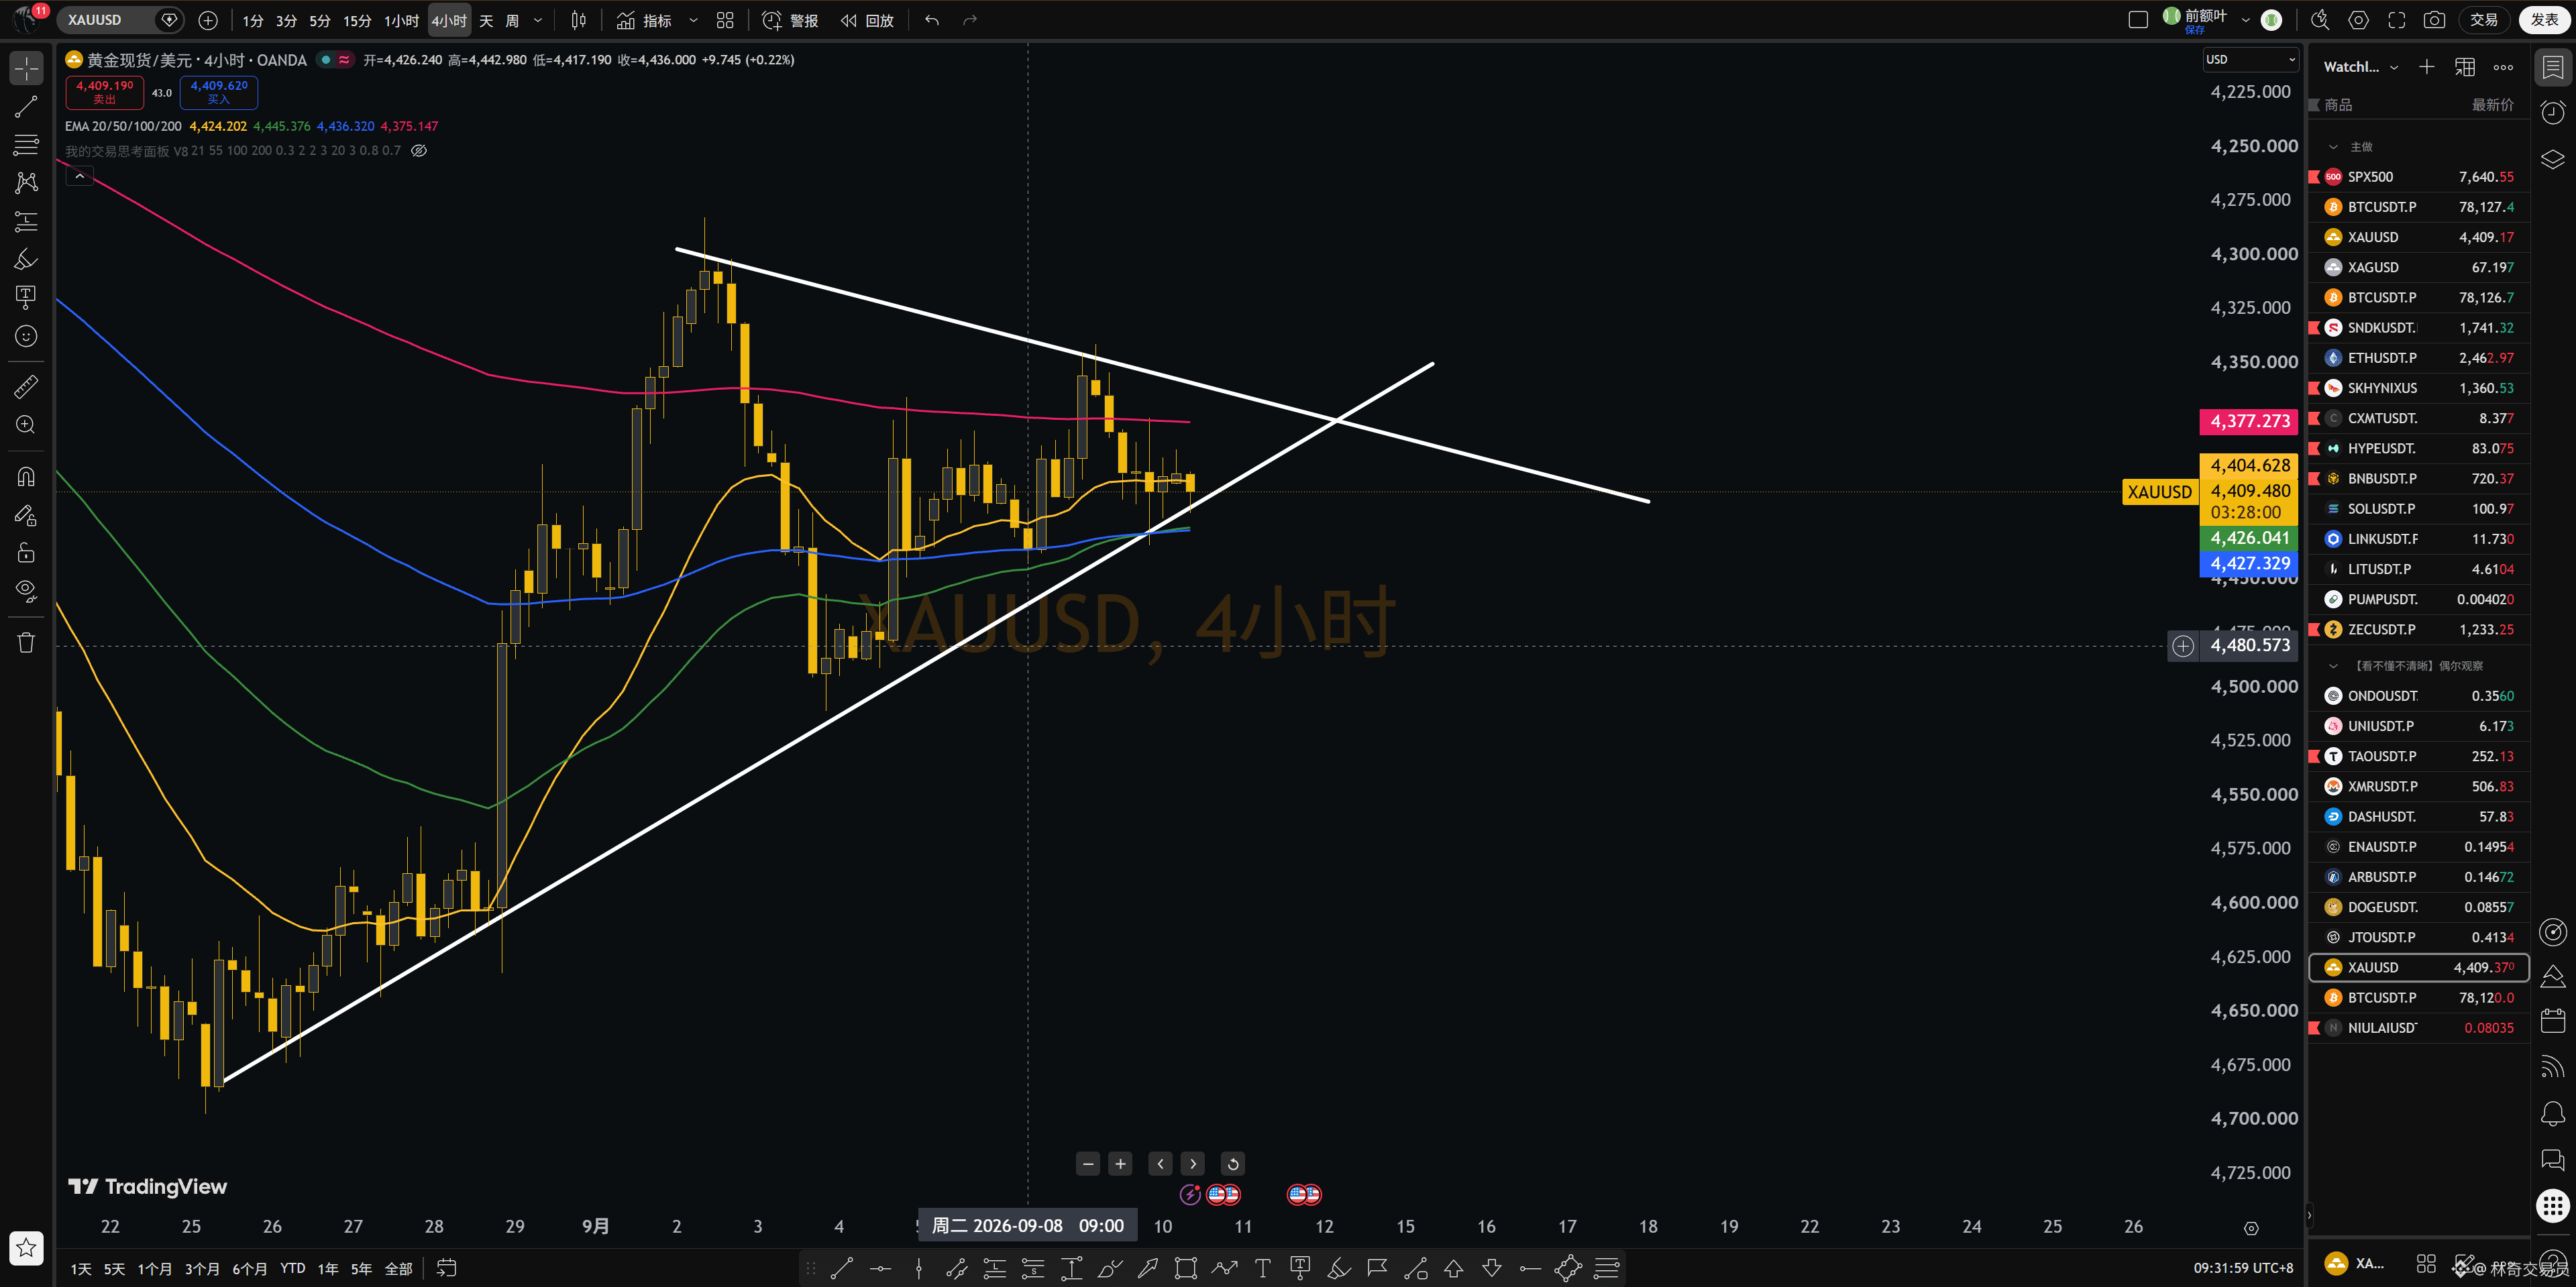
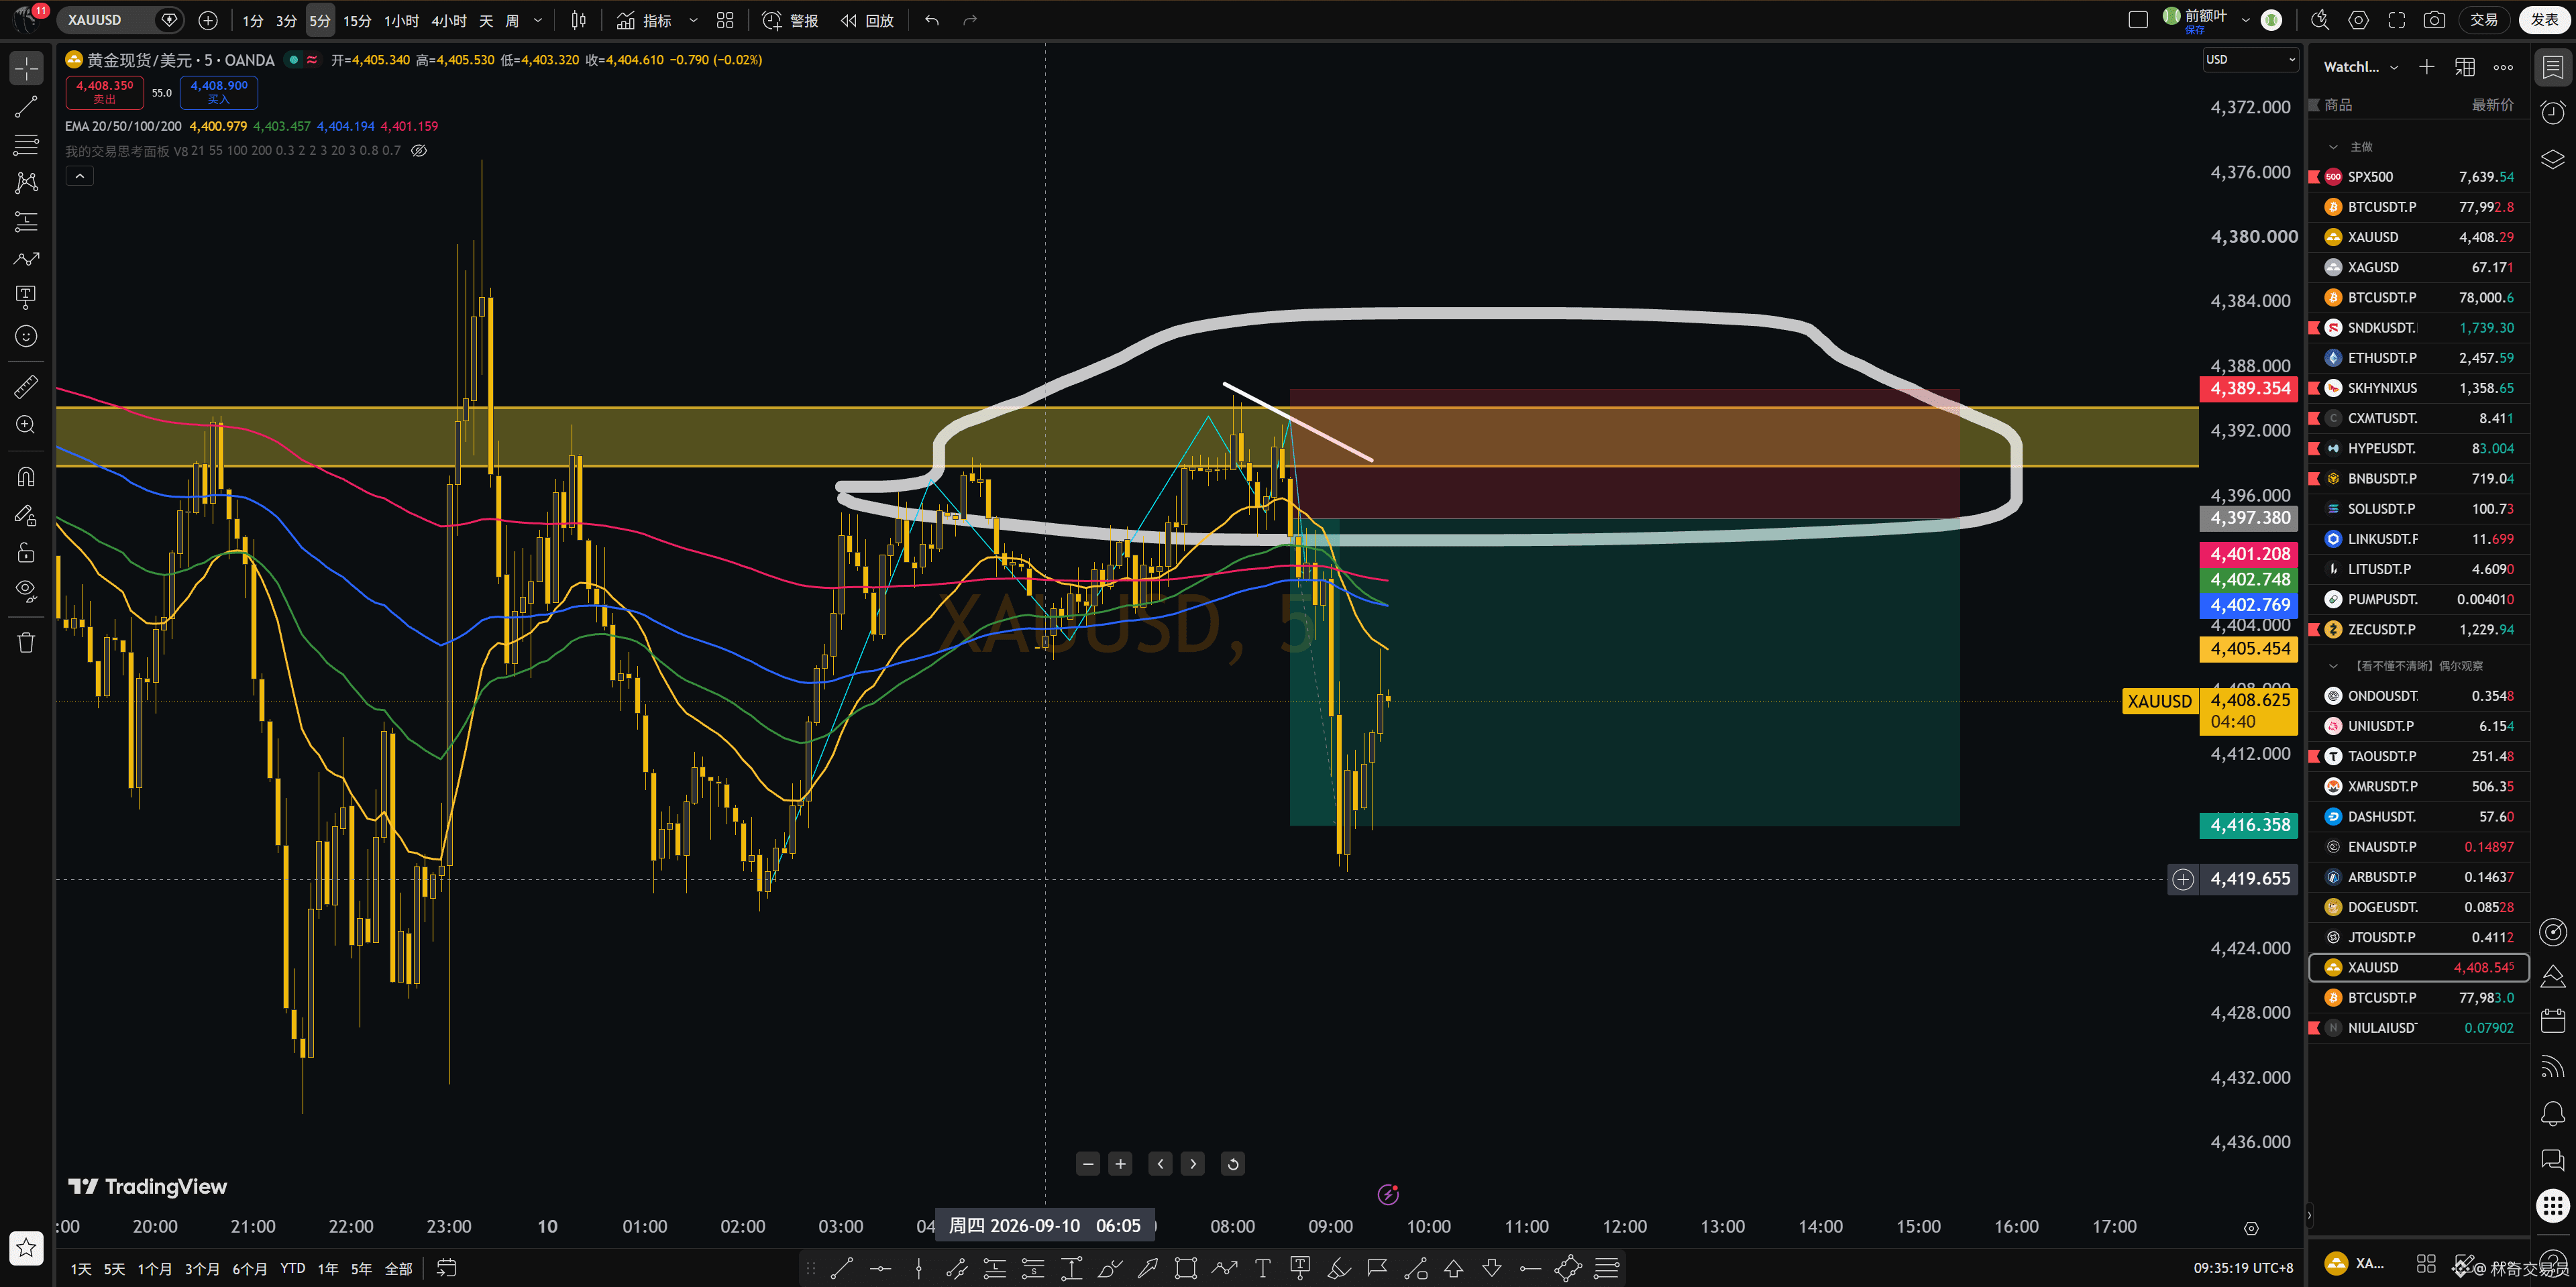
$XAU Haha golden didn’t see such a structure at the time. Now that I look at it, the thinking is very clear.
This is the inverted candlestick pattern. The meaning on the 1-hour timeframe is that, when you look from the left, it’s moving through a trend; then after it made a new high, the bulls launched a strong attack. After that, it returned to a reasonable consolidation range, while also holding the long upper wick. Then the bears repeatedly tried to push, but kept getting blocked. Actually, on the 5-minute timeframe it will be very clear.
Meanwhile, on the 4-hour timeframe, it has a high-low structure—meaning the bears are stronger, and the bulls are at a disadvantage.
On top of that, 1 hour 21 was broken through, and starting from 15 minutes it began to weaken.
This is clearly the probability of a bullish trend.
{future}(XAUUSDT)
$XAU Haha golden didn’t see such a structure at the time. Now that I look at it, the thinking is very clear.
This is the inverted candlestick pattern. The meaning on the 1-hour timeframe is that, when you look from the left, it’s moving through a trend; then after it made a new high, the bulls launched a strong attack. After that, it returned to a reasonable consolidation range, while also holding the long upper wick. Then the bears repeatedly tried to push, but kept getting blocked. Actually, on the 5-minute timeframe it will be very clear.
Meanwhile, on the 4-hour timeframe, it has a high-low structure—meaning the bears are stronger, and the bulls are at a disadvantage.
On top of that, 1 hour 21 was broken through, and starting from 15 minutes it began to weaken.
This is clearly the probability of a bullish trend.
This is the inverted candlestick pattern. The meaning on the 1-hour timeframe is that, when you look from the left, it’s moving through a trend; then after it made a new high, the bulls launched a strong attack. After that, it returned to a reasonable consolidation range, while also holding the long upper wick. Then the bears repeatedly tried to push, but kept getting blocked. Actually, on the 5-minute timeframe it will be very clear.
Meanwhile, on the 4-hour timeframe, it has a high-low structure—meaning the bears are stronger, and the bulls are at a disadvantage.
On top of that, 1 hour 21 was broken through, and starting from 15 minutes it began to weaken.
This is clearly the probability of a bullish trend.
林奇交易员
·
--
#PAXG #XAU #黄金
Gold Market Recap: Has the left-side rally ended? How should we position now?
Gold has delivered a typical right-side reversal signal:
① Structure: Lower highs (LH). The 1H moving average is bearish and dispersing, and the market is entering an overall range-to-downward cycle.
② Key levels: The 4H EMA200 has not yet been lost; there is still a need for a bounce near the previous low.
③ Core strategy: Focus mainly on “selling rallies from resistance,” with a better win rate and risk-reward ratio. Low-buy (long) is only for participation in bounces near the previous low, with small position sizing.
Summary: Understand the structure—don’t force it to catch every leg of the move. If you agree with the logic, please follow and I’ll keep sharing real-trade thinking.
$XAUT
Gold Market Recap: Has the left-side rally ended? How should we position now?
Gold has delivered a typical right-side reversal signal:
① Structure: Lower highs (LH). The 1H moving average is bearish and dispersing, and the market is entering an overall range-to-downward cycle.
② Key levels: The 4H EMA200 has not yet been lost; there is still a need for a bounce near the previous low.
③ Core strategy: Focus mainly on “selling rallies from resistance,” with a better win rate and risk-reward ratio. Low-buy (long) is only for participation in bounces near the previous low, with small position sizing.
Summary: Understand the structure—don’t force it to catch every leg of the move. If you agree with the logic, please follow and I’ll keep sharing real-trade thinking.
$XAUT
143
·
--
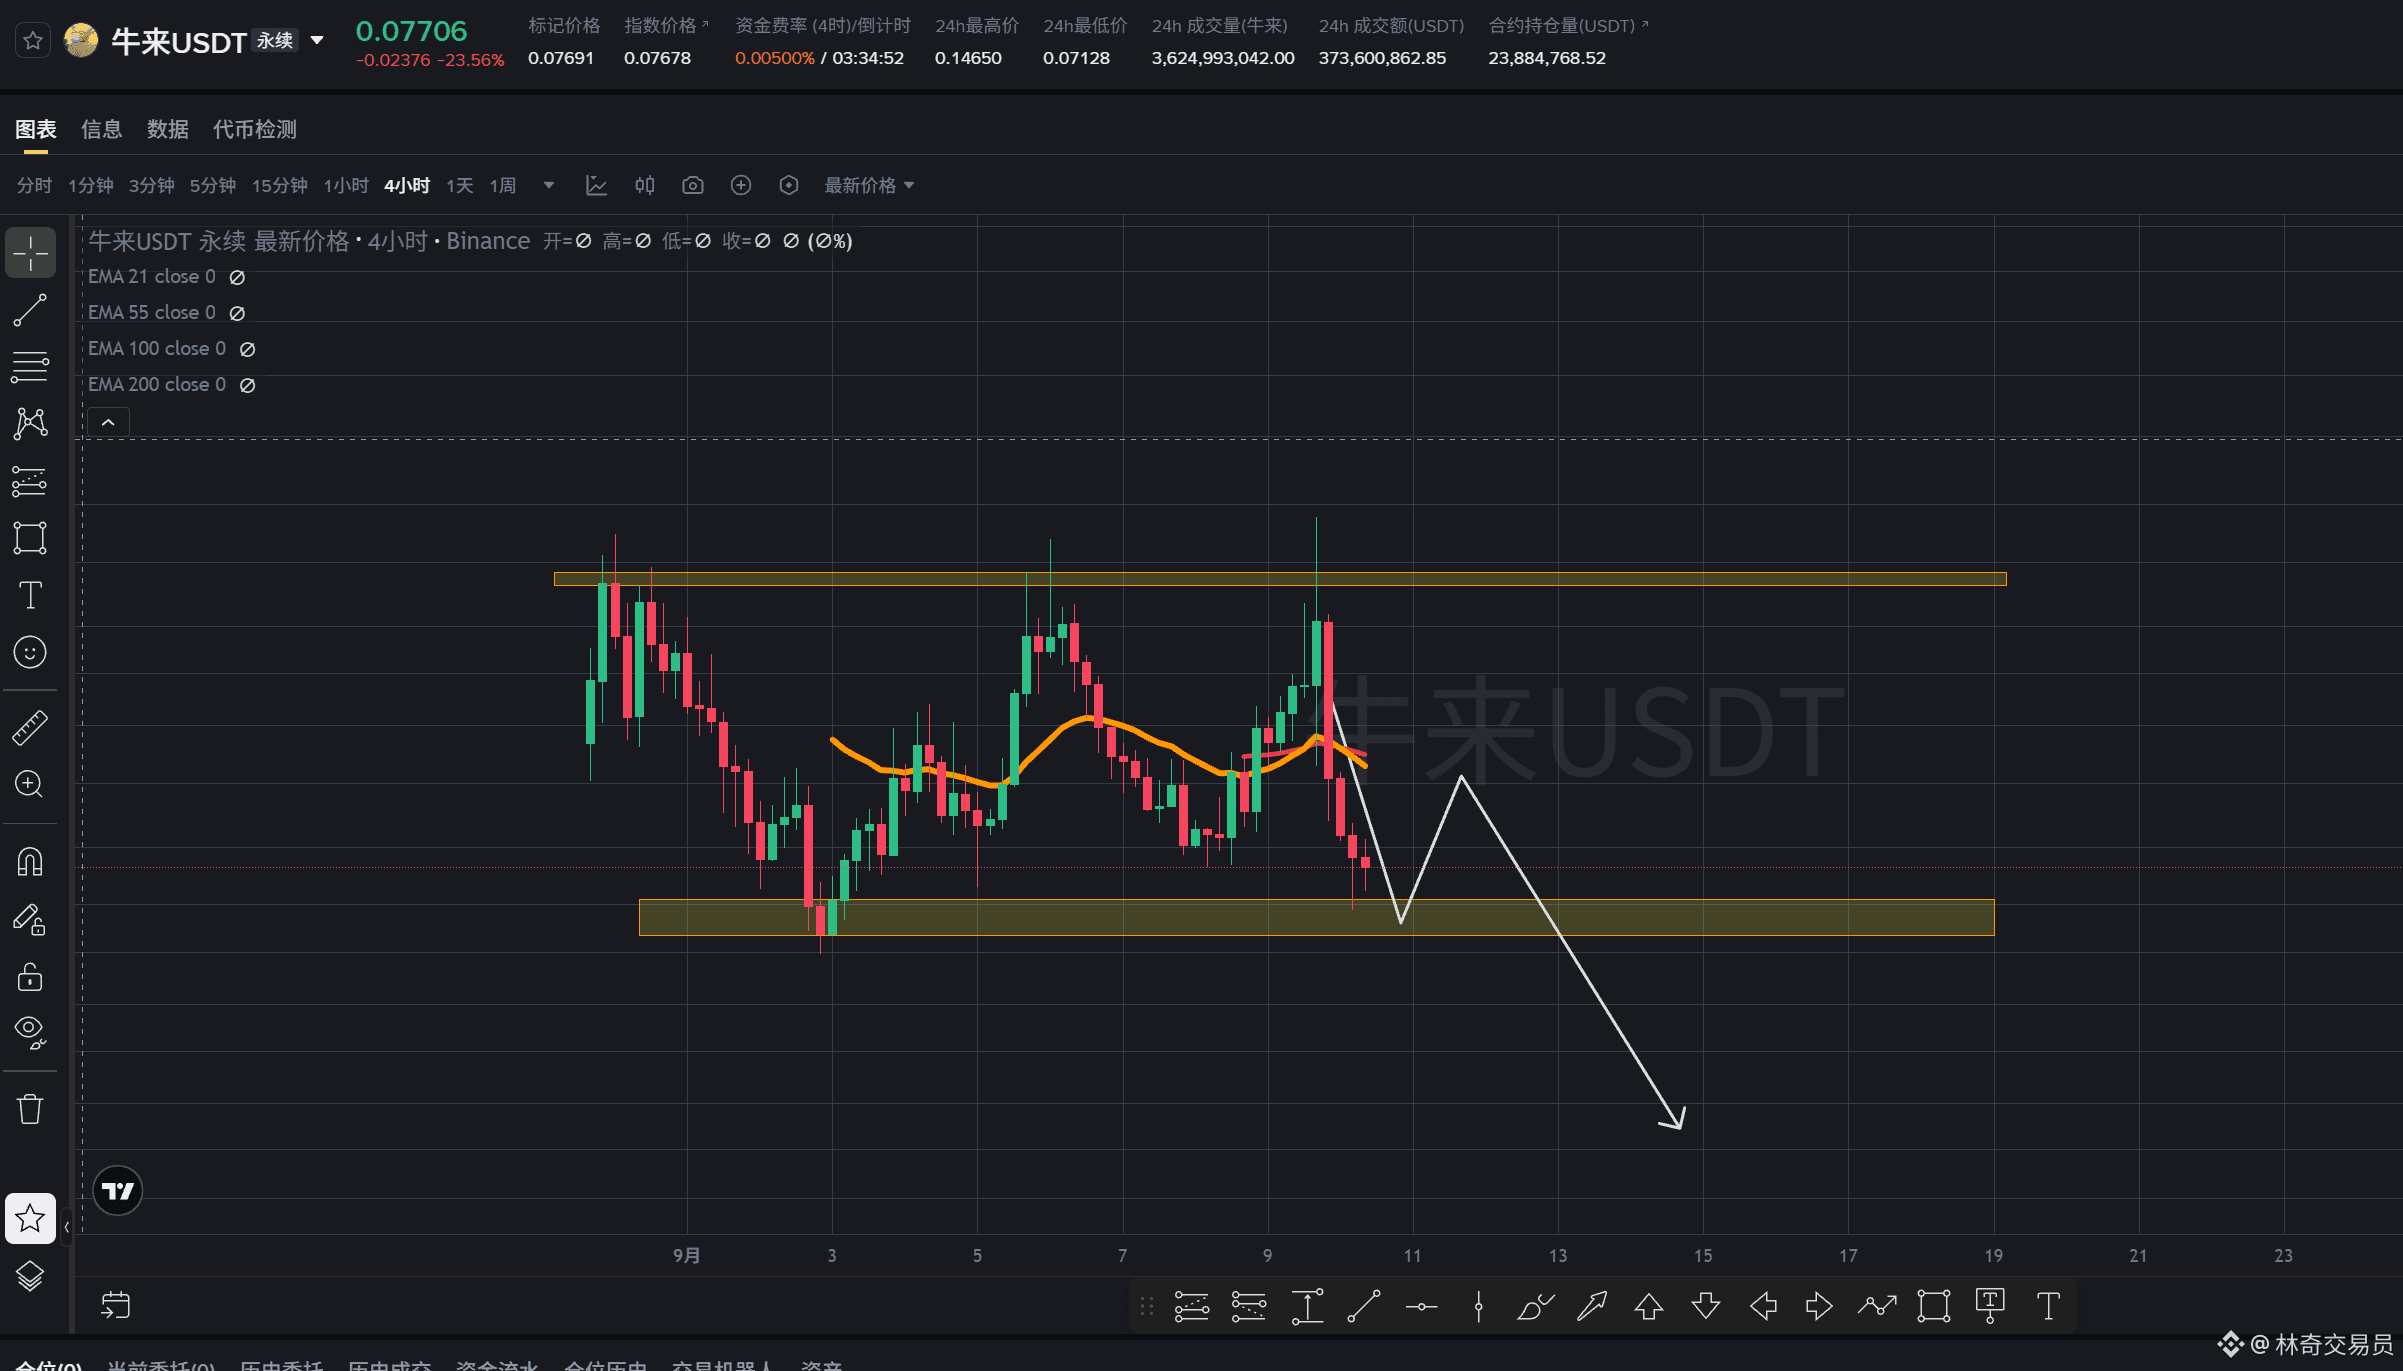
$牛来 Opportunity Assessment: Can the Key 4-Hour Level Hold? A Brief Discussion of the Potential Logic Behind a Bounce
After the token was listed on Binance, its market cap once surged to around $140 million. At present, the 4-hour chart is at an extremely critical level. If this area can be effectively defended, there is a high likelihood of a fairly solid rebound.
From the standpoint of narrative and fundamental logic, this asset has the following potential upside imaginability:
1. Narrative Appeal:
Rare tag: A Chinese-concept token that is the second one to be listed on Binance.
Breakout potential: The first token that ties into the concept of a China’s phenomenon-level film. Compared with ideas limited to the Web3 circle (e.g., “Binance Life”), it has a broader Web2 audience base, and faintly carries the narrative genes of Ordi’s earlier breakout.
2. Trade Risk Control and Positioning:
Core recognition: You must clearly understand that, fundamentally, it still lacks real underlying fundamentals support. It is essentially a Meme coin, with extreme volatility and risk.
Trading plan: Do not buy blindly; keep a close watch. Wait patiently for a 4H confirmation of a bottoming signal (such as a small timeframe basing pattern or a stop-the-fall candle with increased volume). Once a clear signal appears, try to enter to capture a right-side rebound.
The narrative determines the ceiling, and the structure determines the entry point.
If you agree with this logic, please follow—I'll continue to update and track the signals going forward.
{future}(牛来USDT)
$牛来 Opportunity Assessment: Can the Key 4-Hour Level Hold? A Brief Discussion of the Potential Logic Behind a Bounce
After the token was listed on Binance, its market cap once surged to around $140 million. At present, the 4-hour chart is at an extremely critical level. If this area can be effectively defended, there is a high likelihood of a fairly solid rebound.
From the standpoint of narrative and fundamental logic, this asset has the following potential upside imaginability:
1. Narrative Appeal:
Rare tag: A Chinese-concept token that is the second one to be listed on Binance.
Breakout potential: The first token that ties into the concept of a China’s phenomenon-level film. Compared with ideas limited to the Web3 circle (e.g., “Binance Life”), it has a broader Web2 audience base, and faintly carries the narrative genes of Ordi’s earlier breakout.
2. Trade Risk Control and Positioning:
Core recognition: You must clearly understand that, fundamentally, it still lacks real underlying fundamentals support. It is essentially a Meme coin, with extreme volatility and risk.
Trading plan: Do not buy blindly; keep a close watch. Wait patiently for a 4H confirmation of a bottoming signal (such as a small timeframe basing pattern or a stop-the-fall candle with increased volume). Once a clear signal appears, try to enter to capture a right-side rebound.
The narrative determines the ceiling, and the structure determines the entry point.
If you agree with this logic, please follow—I'll continue to update and track the signals going forward.
After the token was listed on Binance, its market cap once surged to around $140 million. At present, the 4-hour chart is at an extremely critical level. If this area can be effectively defended, there is a high likelihood of a fairly solid rebound.
From the standpoint of narrative and fundamental logic, this asset has the following potential upside imaginability:
1. Narrative Appeal:
Rare tag: A Chinese-concept token that is the second one to be listed on Binance.
Breakout potential: The first token that ties into the concept of a China’s phenomenon-level film. Compared with ideas limited to the Web3 circle (e.g., “Binance Life”), it has a broader Web2 audience base, and faintly carries the narrative genes of Ordi’s earlier breakout.
2. Trade Risk Control and Positioning:
Core recognition: You must clearly understand that, fundamentally, it still lacks real underlying fundamentals support. It is essentially a Meme coin, with extreme volatility and risk.
Trading plan: Do not buy blindly; keep a close watch. Wait patiently for a 4H confirmation of a bottoming signal (such as a small timeframe basing pattern or a stop-the-fall candle with increased volume). Once a clear signal appears, try to enter to capture a right-side rebound.
The narrative determines the ceiling, and the structure determines the entry point.
If you agree with this logic, please follow—I'll continue to update and track the signals going forward.
1
614
·
--
Bullish
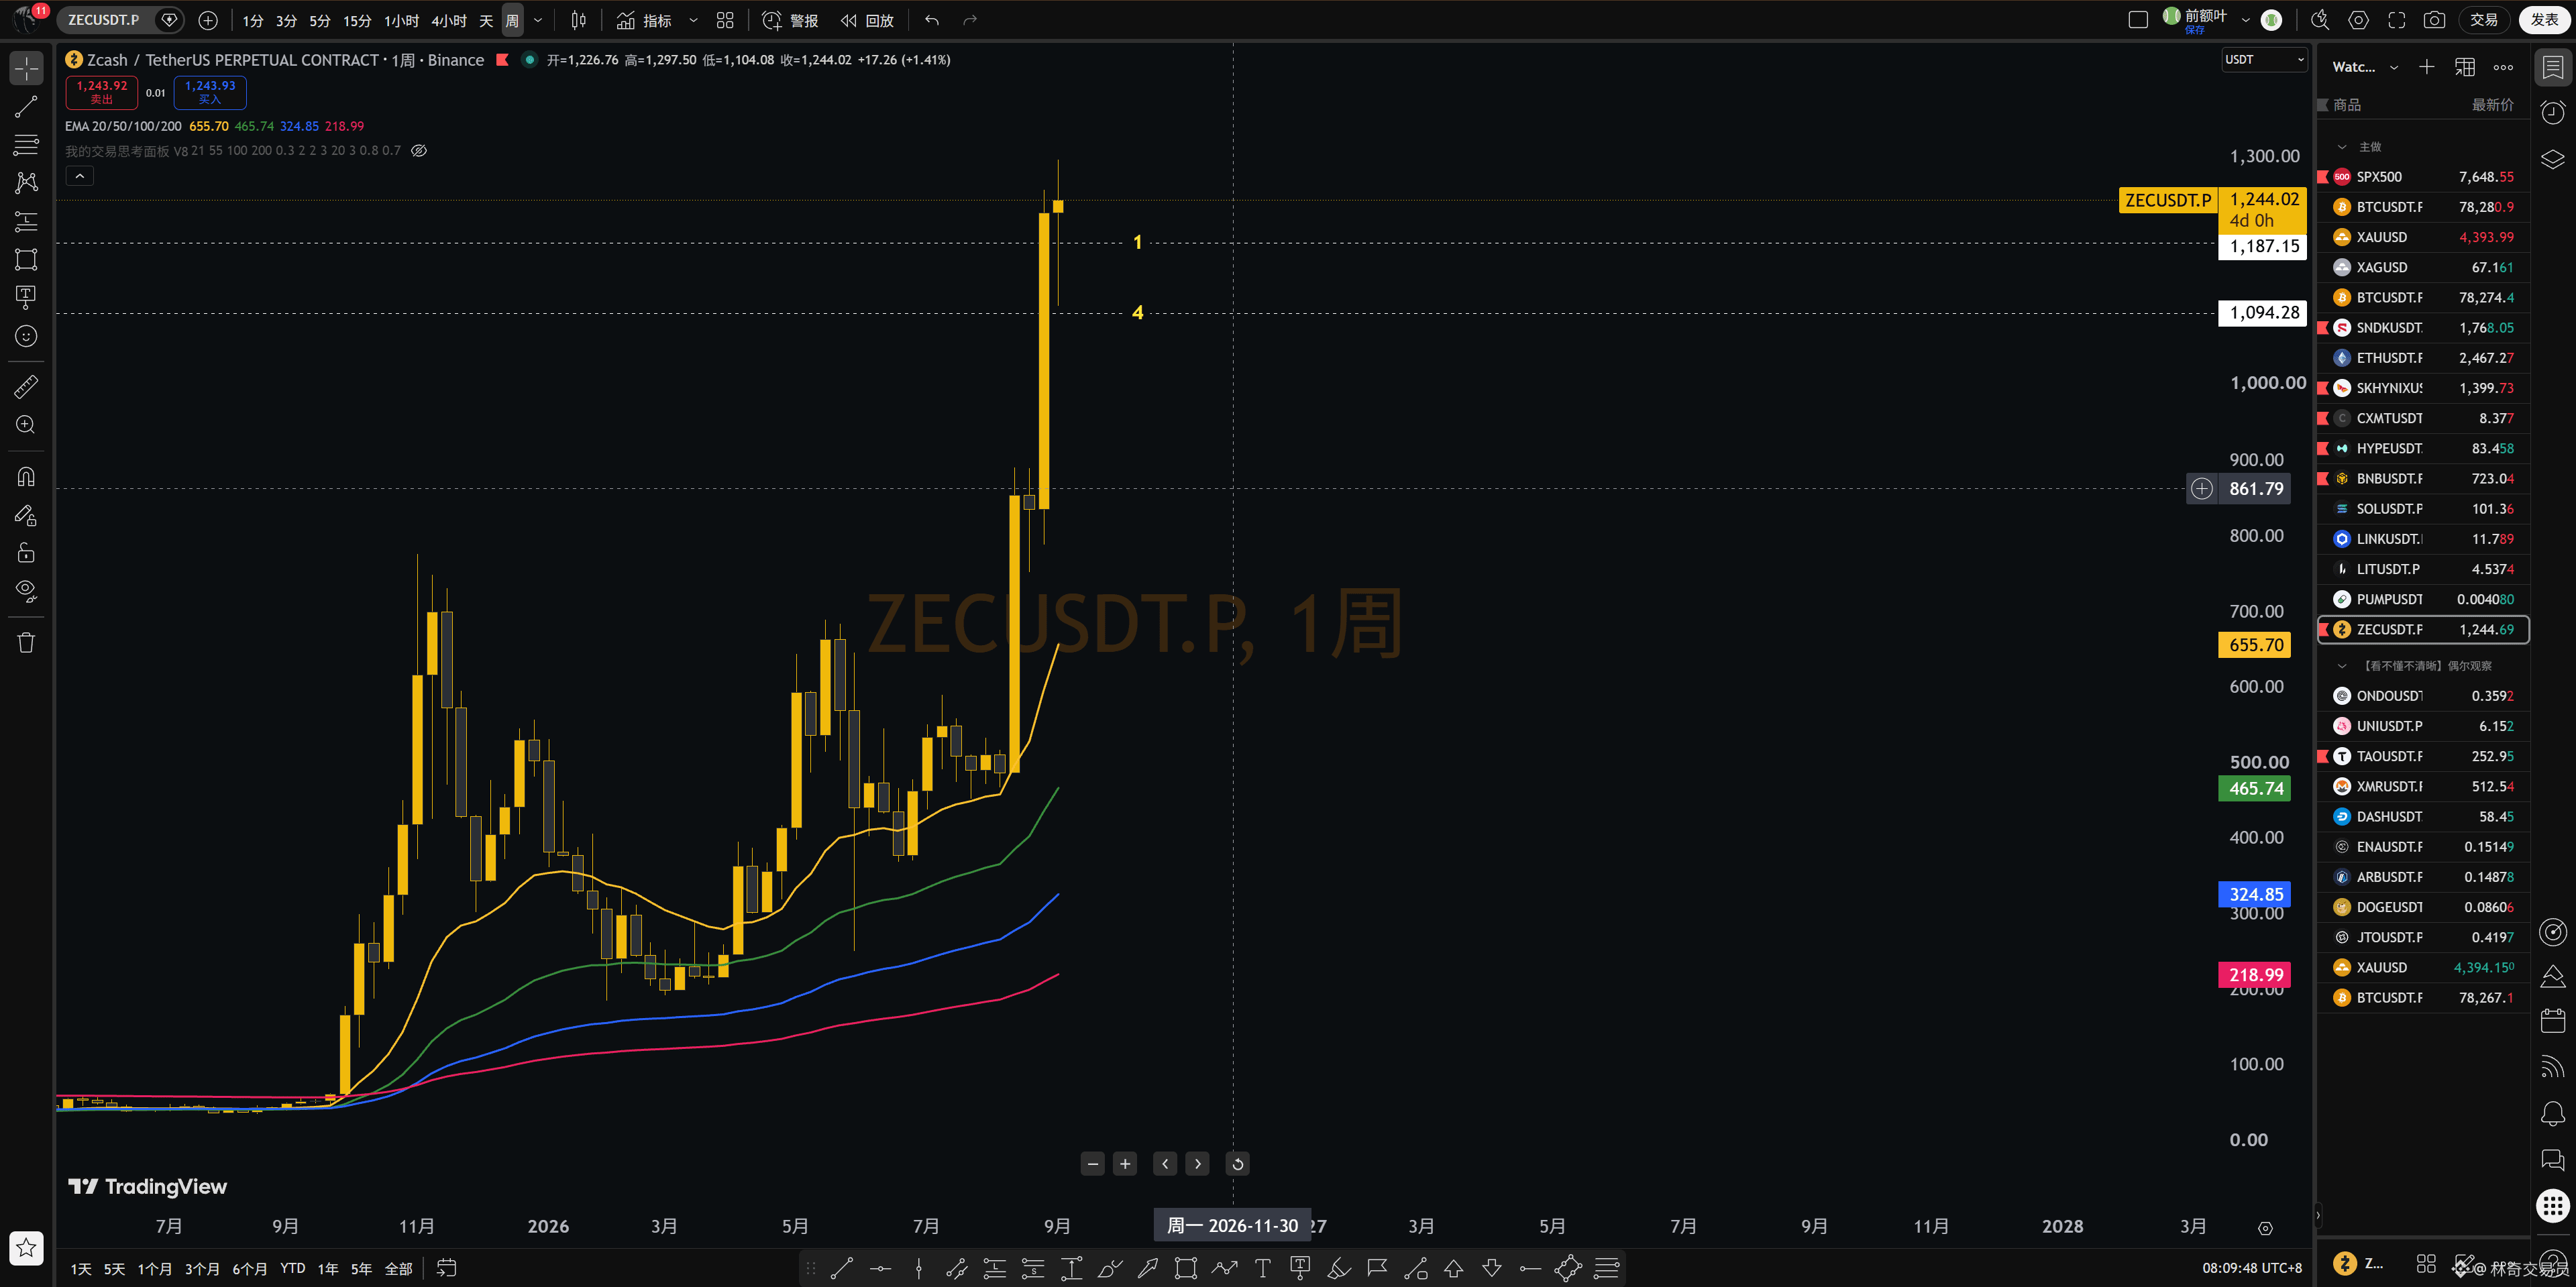
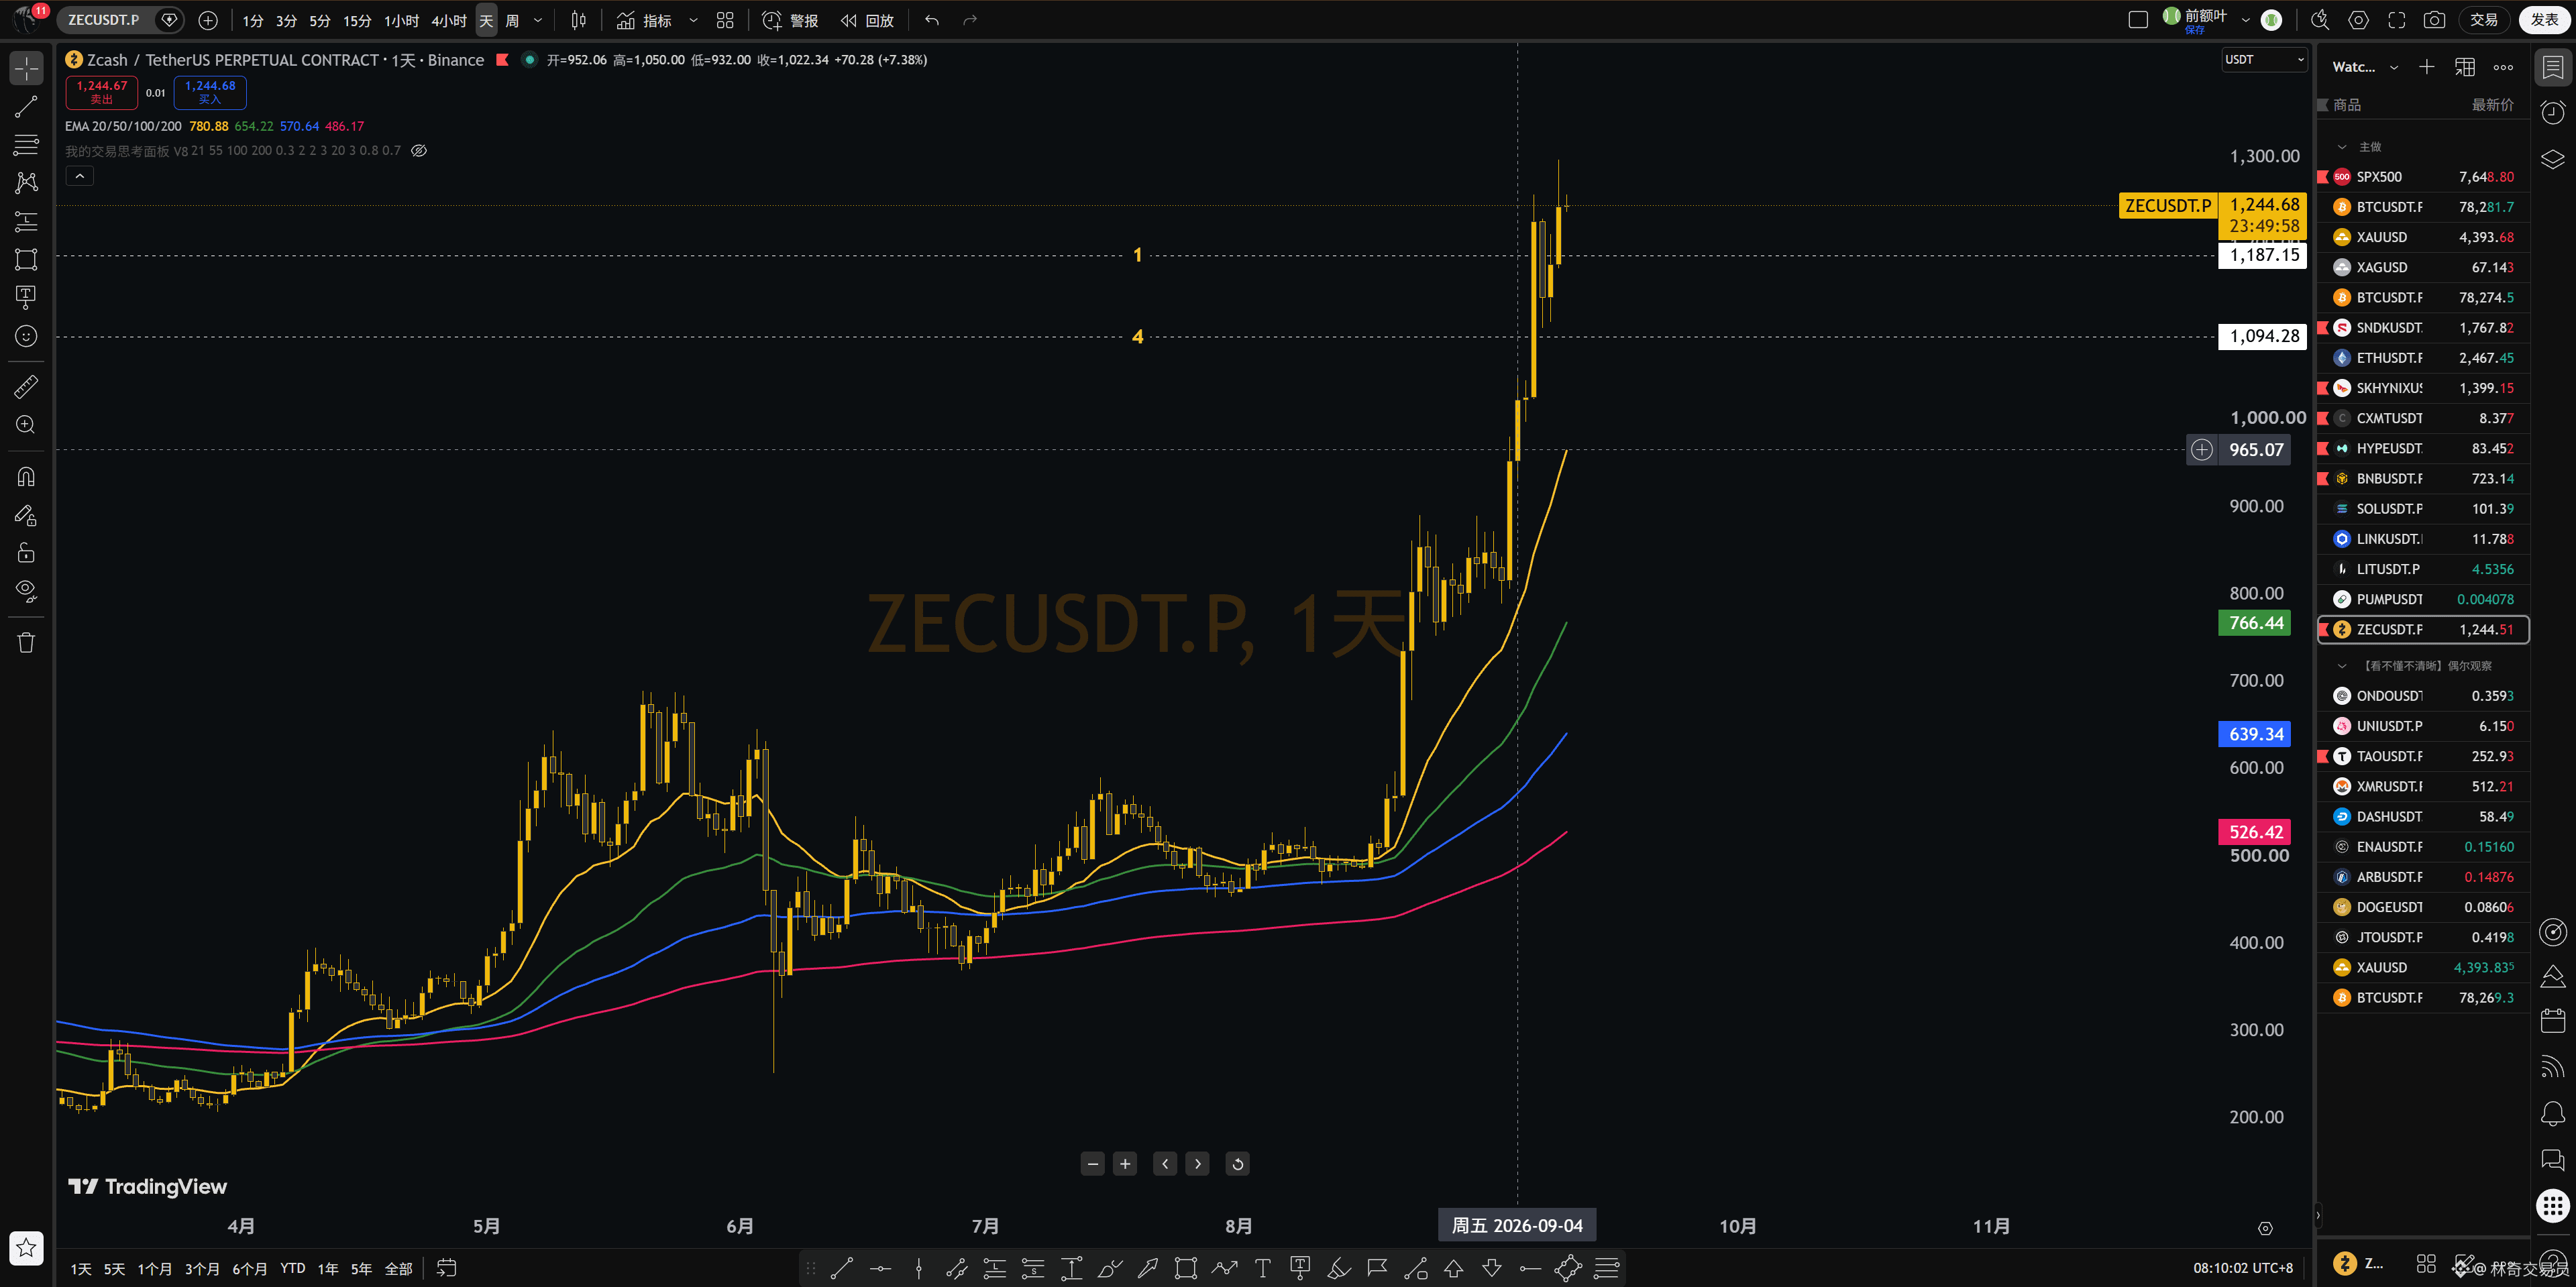
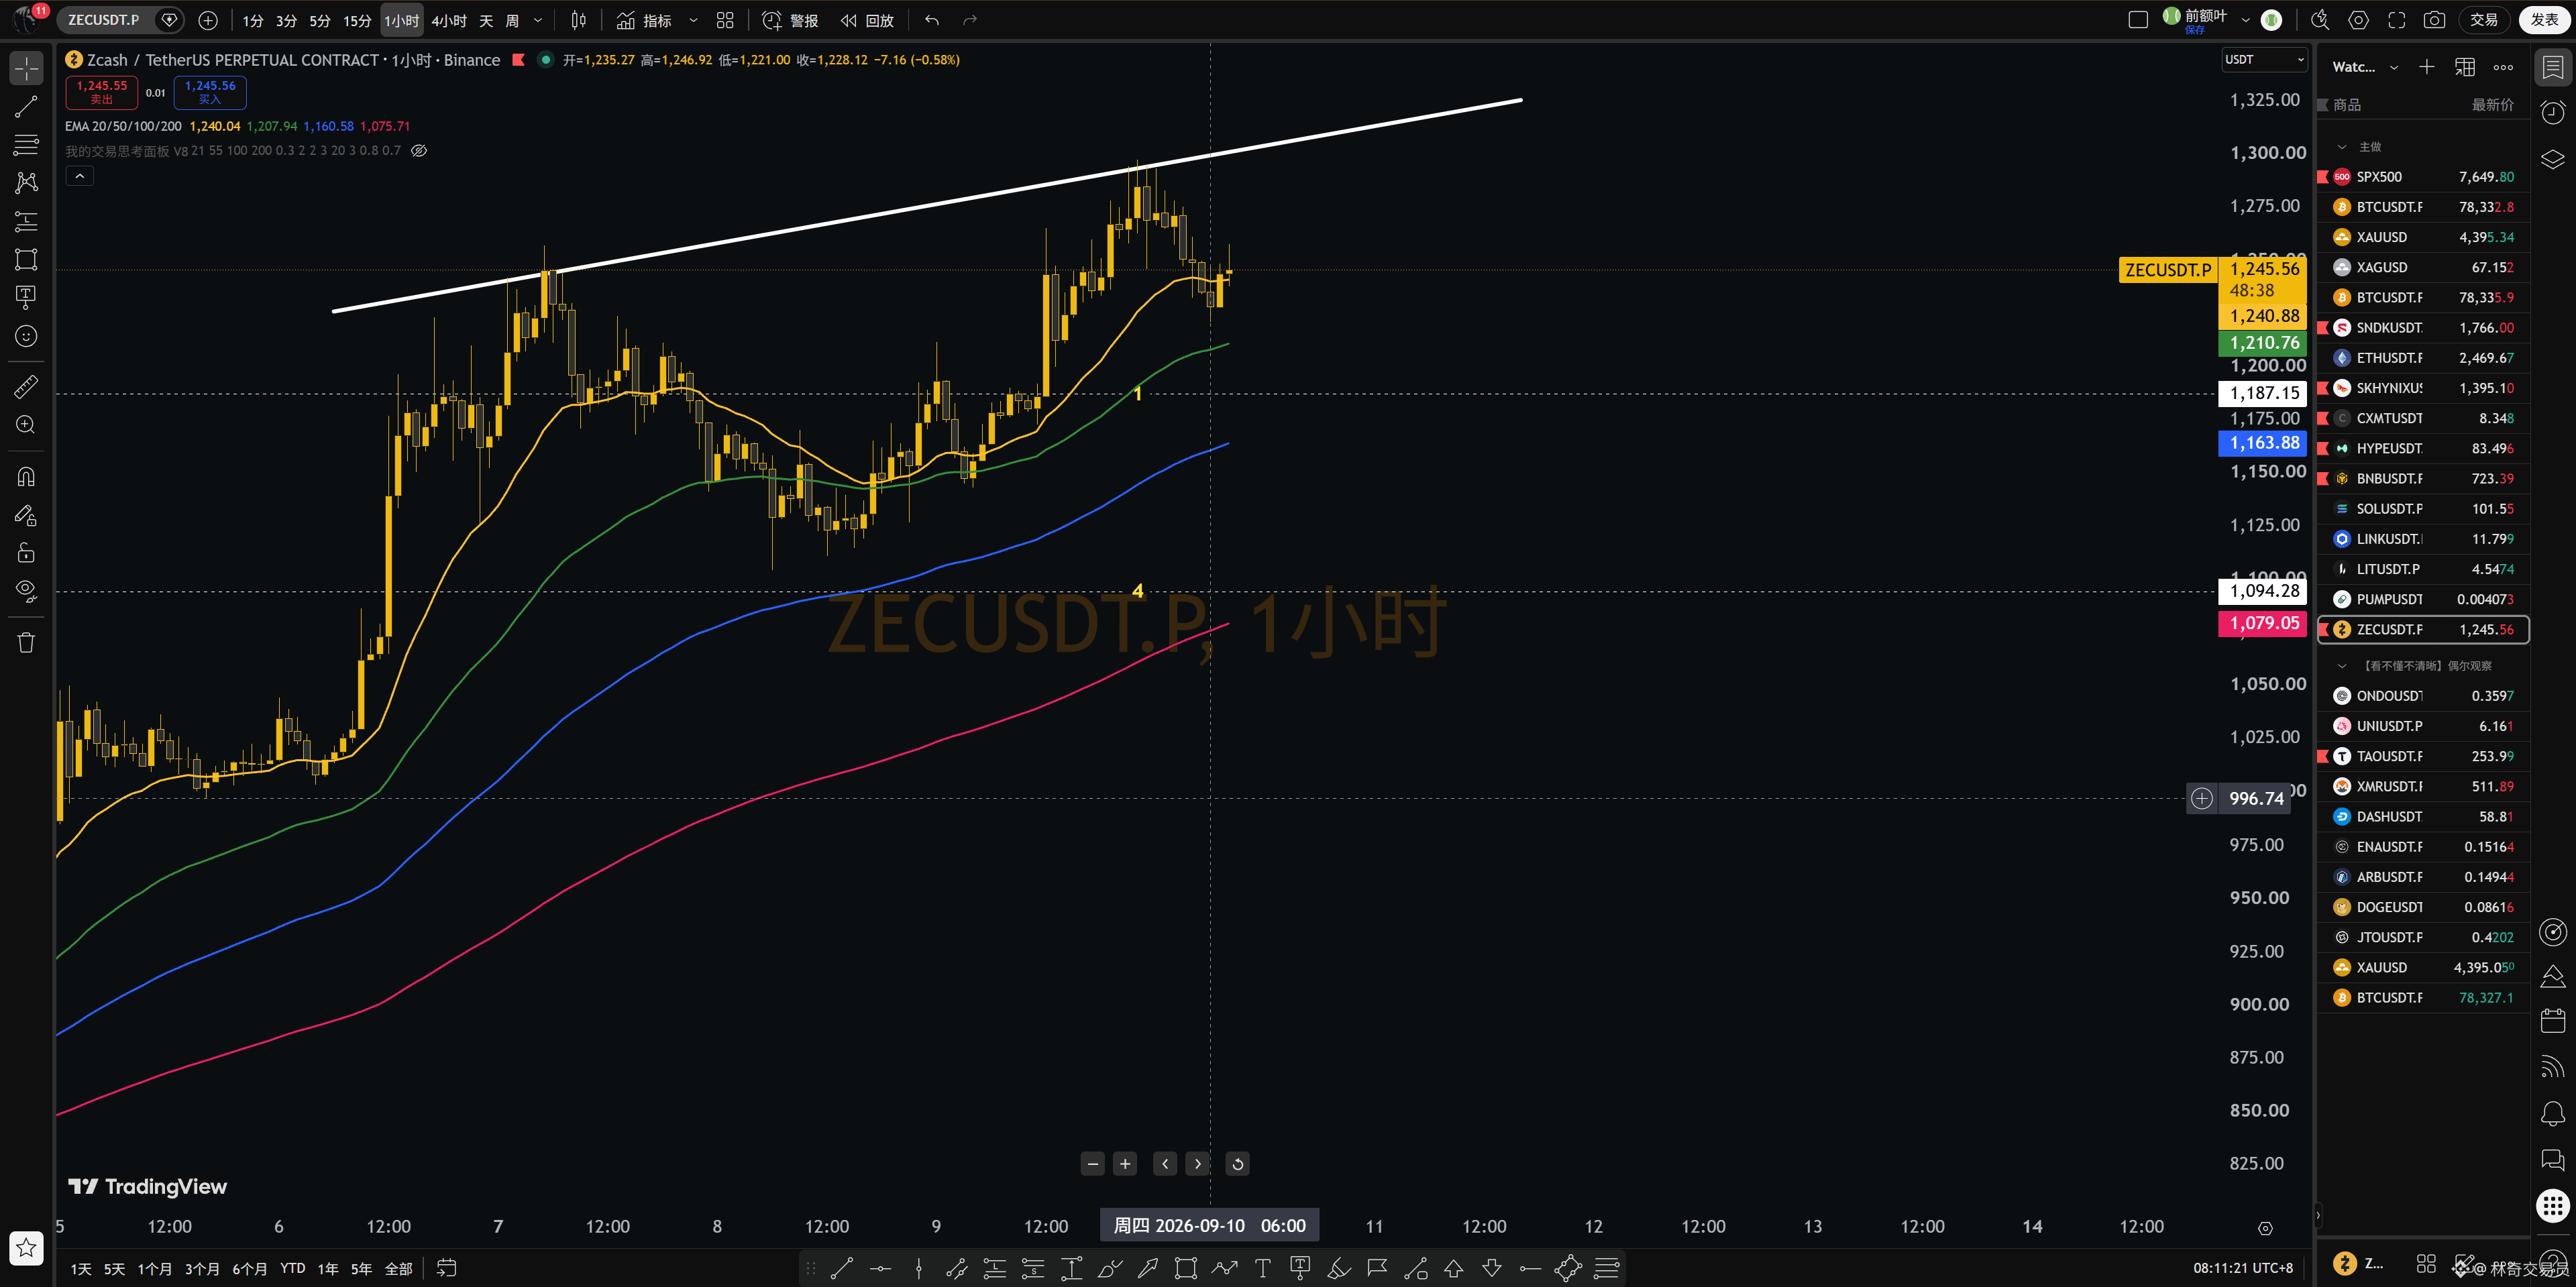
$ZEC The underlying logic and risks of shorting against the trend: Why “high prices” is not a reason to go short?
Recently, I’ve seen too many people in the plaza blindly short $ZEC —getting trapped and even hard-holding margin. From the weekly chart, it is indeed one of the very few coins that remains extremely strong, continually breaking its previous all-time highs.
On the chart, there’s no historical resistance zone overhead; the pump is driven purely by market imagination. In the face of such a violent surge, shorting against the trend is often the most painful and worst value-for-money kind of bet:
1. Why should you avoid blindly following shorts?
Hedging and capital attributes are different: you don’t know whether others are eating funding fees through hedging, and you also can’t tell whether their positions are just pocket money to them or their entire life savings.
Poor risk-reward asymmetry: even if you’re lucky enough to follow and take a bit of profit, once the future brings another violent rally because they’re “standing firm,” you could be facing liquidation immediately.
2. Why is the process of a “counter-trend” trade extremely painful?
Endless torment: you can never predict how much more it will keep pumping. Every day holding the position is spent in psychological torture.
Low-probability dump and defense: the expected “violent dump” is very unlikely. Even if it happens, trend-following longs will likely step in to support the price, making it extremely hard to time your exit.
Long, grinding consolidation: a strong coin doesn’t necessarily go to zero right away—it often goes through a long period of high-level consolidation. This kind of consolidation not only wears down your mindset, but the second rally after the consolidation is often even more ferocious.
Conclusion
A strong trend doesn’t smash down to zero overnight. It requires a long process of exhausting and converting positions. Go with the trend and stay away from painful counter-trend shorts.
If you agree with this logic, give it a follow. Trade rationally, and stay away from liquidation.
{future}(ZECUSDT)
$ZEC The underlying logic and risks of shorting against the trend: Why “high prices” is not a reason to go short?
Recently, I’ve seen too many people in the plaza blindly short $ZEC —getting trapped and even hard-holding margin. From the weekly chart, it is indeed one of the very few coins that remains extremely strong, continually breaking its previous all-time highs.
On the chart, there’s no historical resistance zone overhead; the pump is driven purely by market imagination. In the face of such a violent surge, shorting against the trend is often the most painful and worst value-for-money kind of bet:
1. Why should you avoid blindly following shorts?
Hedging and capital attributes are different: you don’t know whether others are eating funding fees through hedging, and you also can’t tell whether their positions are just pocket money to them or their entire life savings.
Poor risk-reward asymmetry: even if you’re lucky enough to follow and take a bit of profit, once the future brings another violent rally because they’re “standing firm,” you could be facing liquidation immediately.
2. Why is the process of a “counter-trend” trade extremely painful?
Endless torment: you can never predict how much more it will keep pumping. Every day holding the position is spent in psychological torture.
Low-probability dump and defense: the expected “violent dump” is very unlikely. Even if it happens, trend-following longs will likely step in to support the price, making it extremely hard to time your exit.
Long, grinding consolidation: a strong coin doesn’t necessarily go to zero right away—it often goes through a long period of high-level consolidation. This kind of consolidation not only wears down your mindset, but the second rally after the consolidation is often even more ferocious.
Conclusion
A strong trend doesn’t smash down to zero overnight. It requires a long process of exhausting and converting positions. Go with the trend and stay away from painful counter-trend shorts.
If you agree with this logic, give it a follow. Trade rationally, and stay away from liquidation.
Recently, I’ve seen too many people in the plaza blindly short $ZEC —getting trapped and even hard-holding margin. From the weekly chart, it is indeed one of the very few coins that remains extremely strong, continually breaking its previous all-time highs.
On the chart, there’s no historical resistance zone overhead; the pump is driven purely by market imagination. In the face of such a violent surge, shorting against the trend is often the most painful and worst value-for-money kind of bet:
1. Why should you avoid blindly following shorts?
Hedging and capital attributes are different: you don’t know whether others are eating funding fees through hedging, and you also can’t tell whether their positions are just pocket money to them or their entire life savings.
Poor risk-reward asymmetry: even if you’re lucky enough to follow and take a bit of profit, once the future brings another violent rally because they’re “standing firm,” you could be facing liquidation immediately.
2. Why is the process of a “counter-trend” trade extremely painful?
Endless torment: you can never predict how much more it will keep pumping. Every day holding the position is spent in psychological torture.
Low-probability dump and defense: the expected “violent dump” is very unlikely. Even if it happens, trend-following longs will likely step in to support the price, making it extremely hard to time your exit.
Long, grinding consolidation: a strong coin doesn’t necessarily go to zero right away—it often goes through a long period of high-level consolidation. This kind of consolidation not only wears down your mindset, but the second rally after the consolidation is often even more ferocious.
Conclusion
A strong trend doesn’t smash down to zero overnight. It requires a long process of exhausting and converting positions. Go with the trend and stay away from painful counter-trend shorts.
If you agree with this logic, give it a follow. Trade rationally, and stay away from liquidation.
276
·
--
#PAXG #XAU #黄金
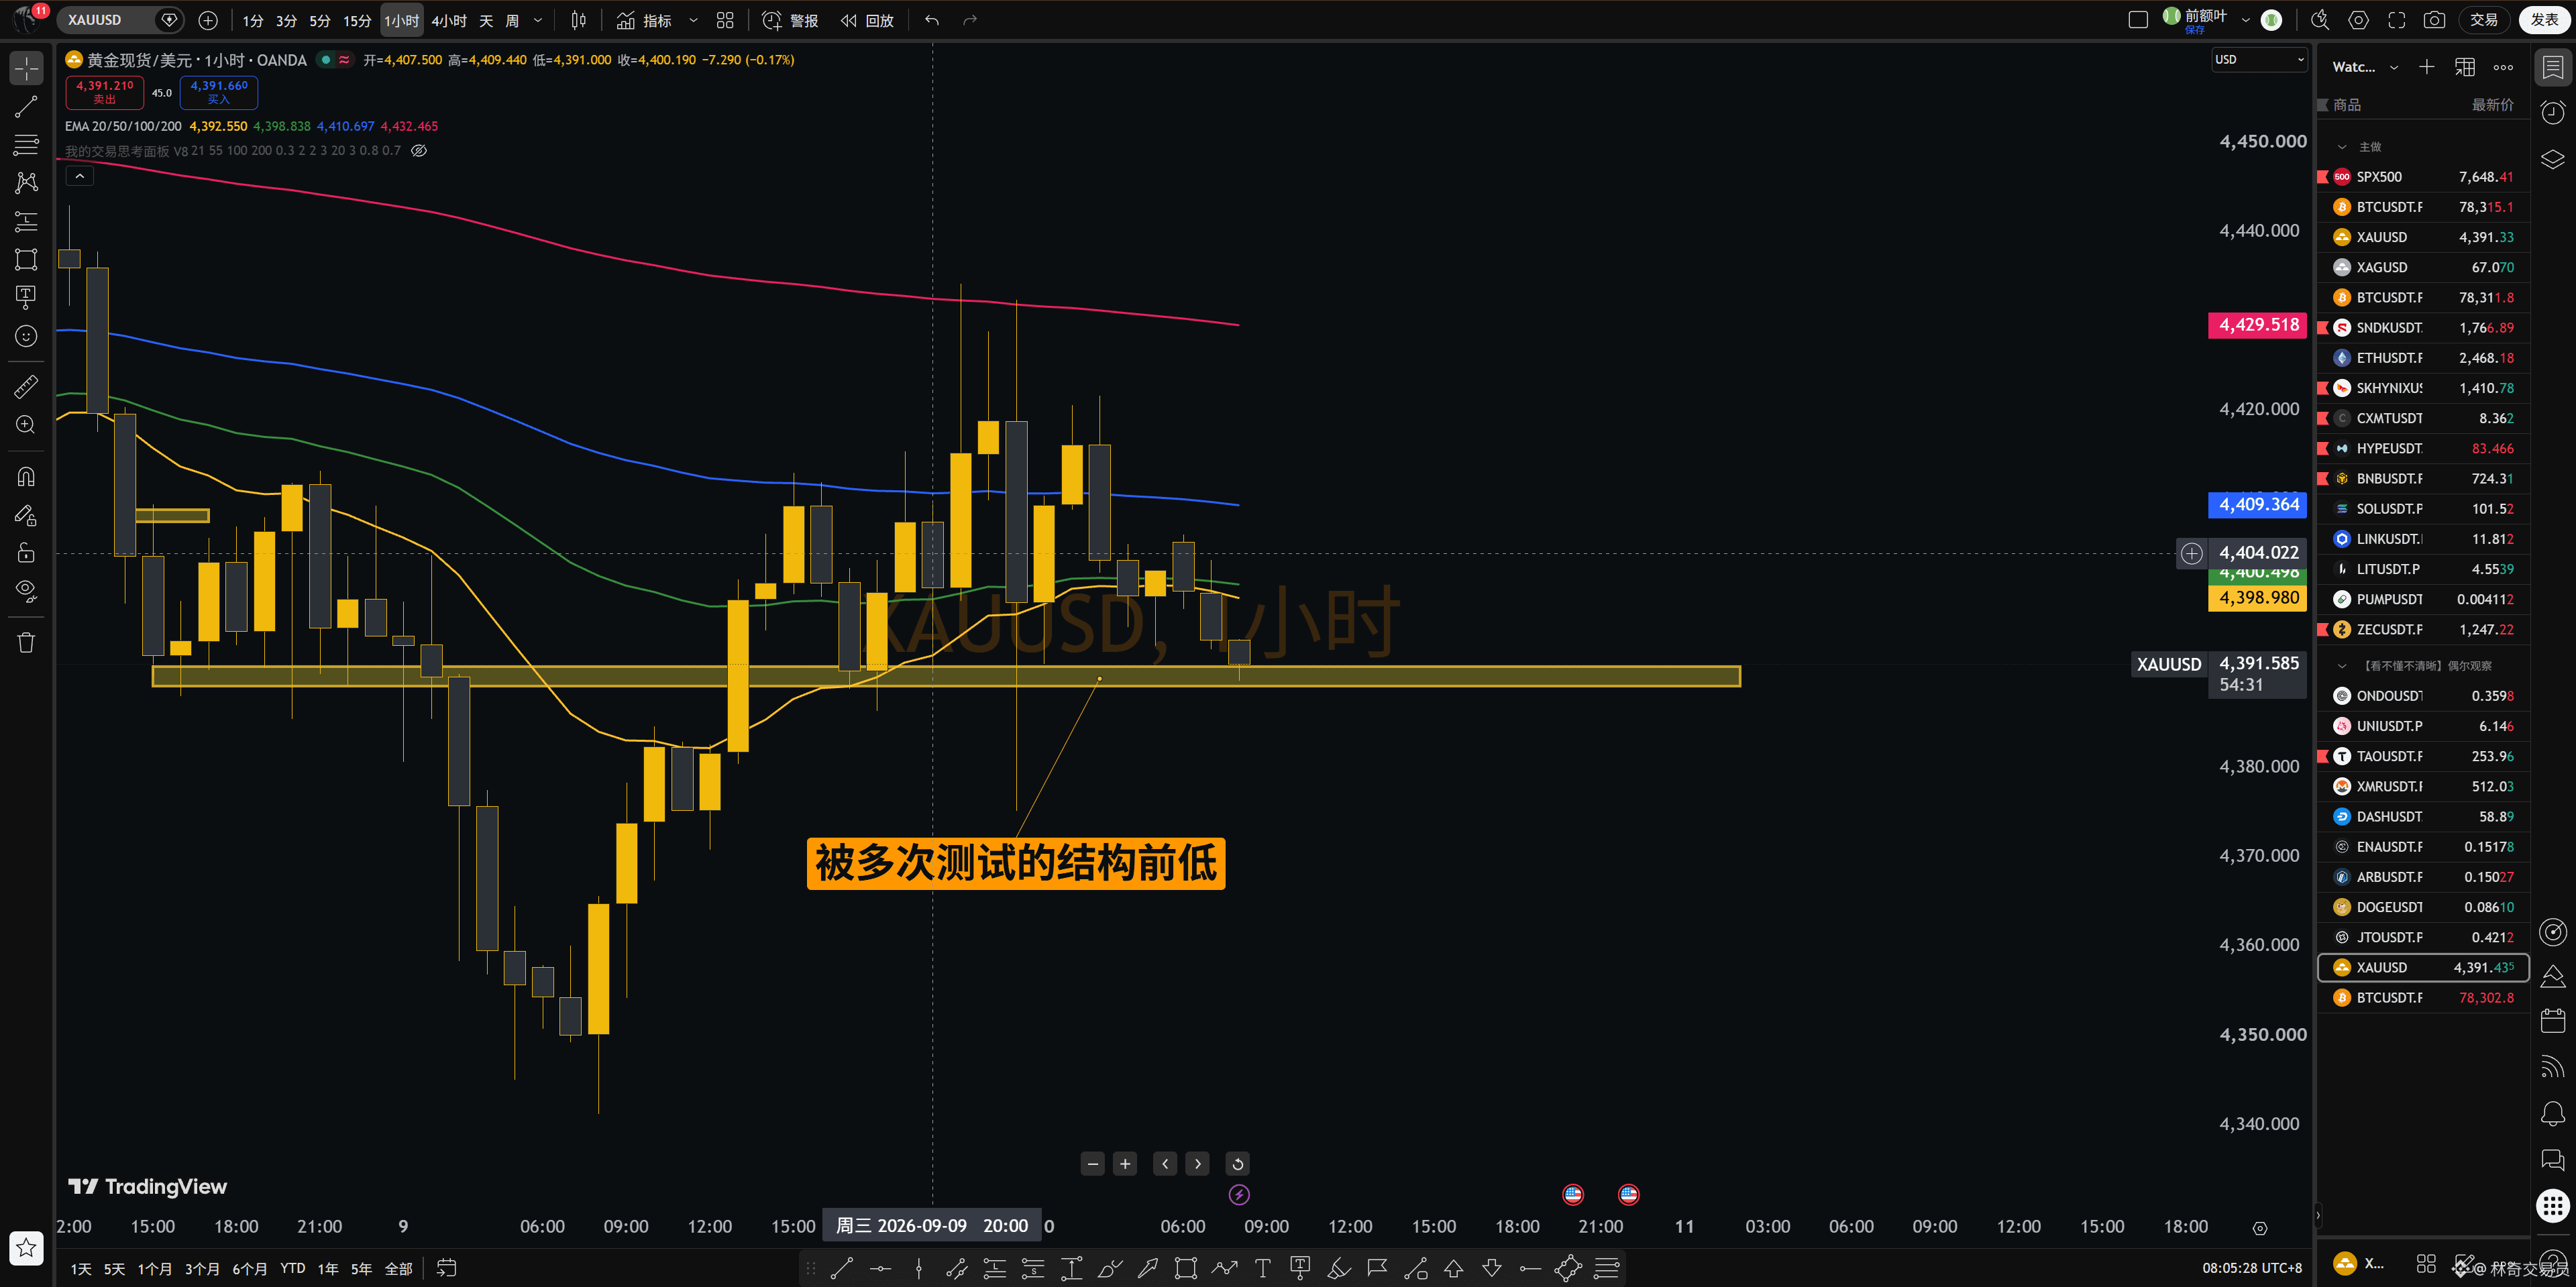
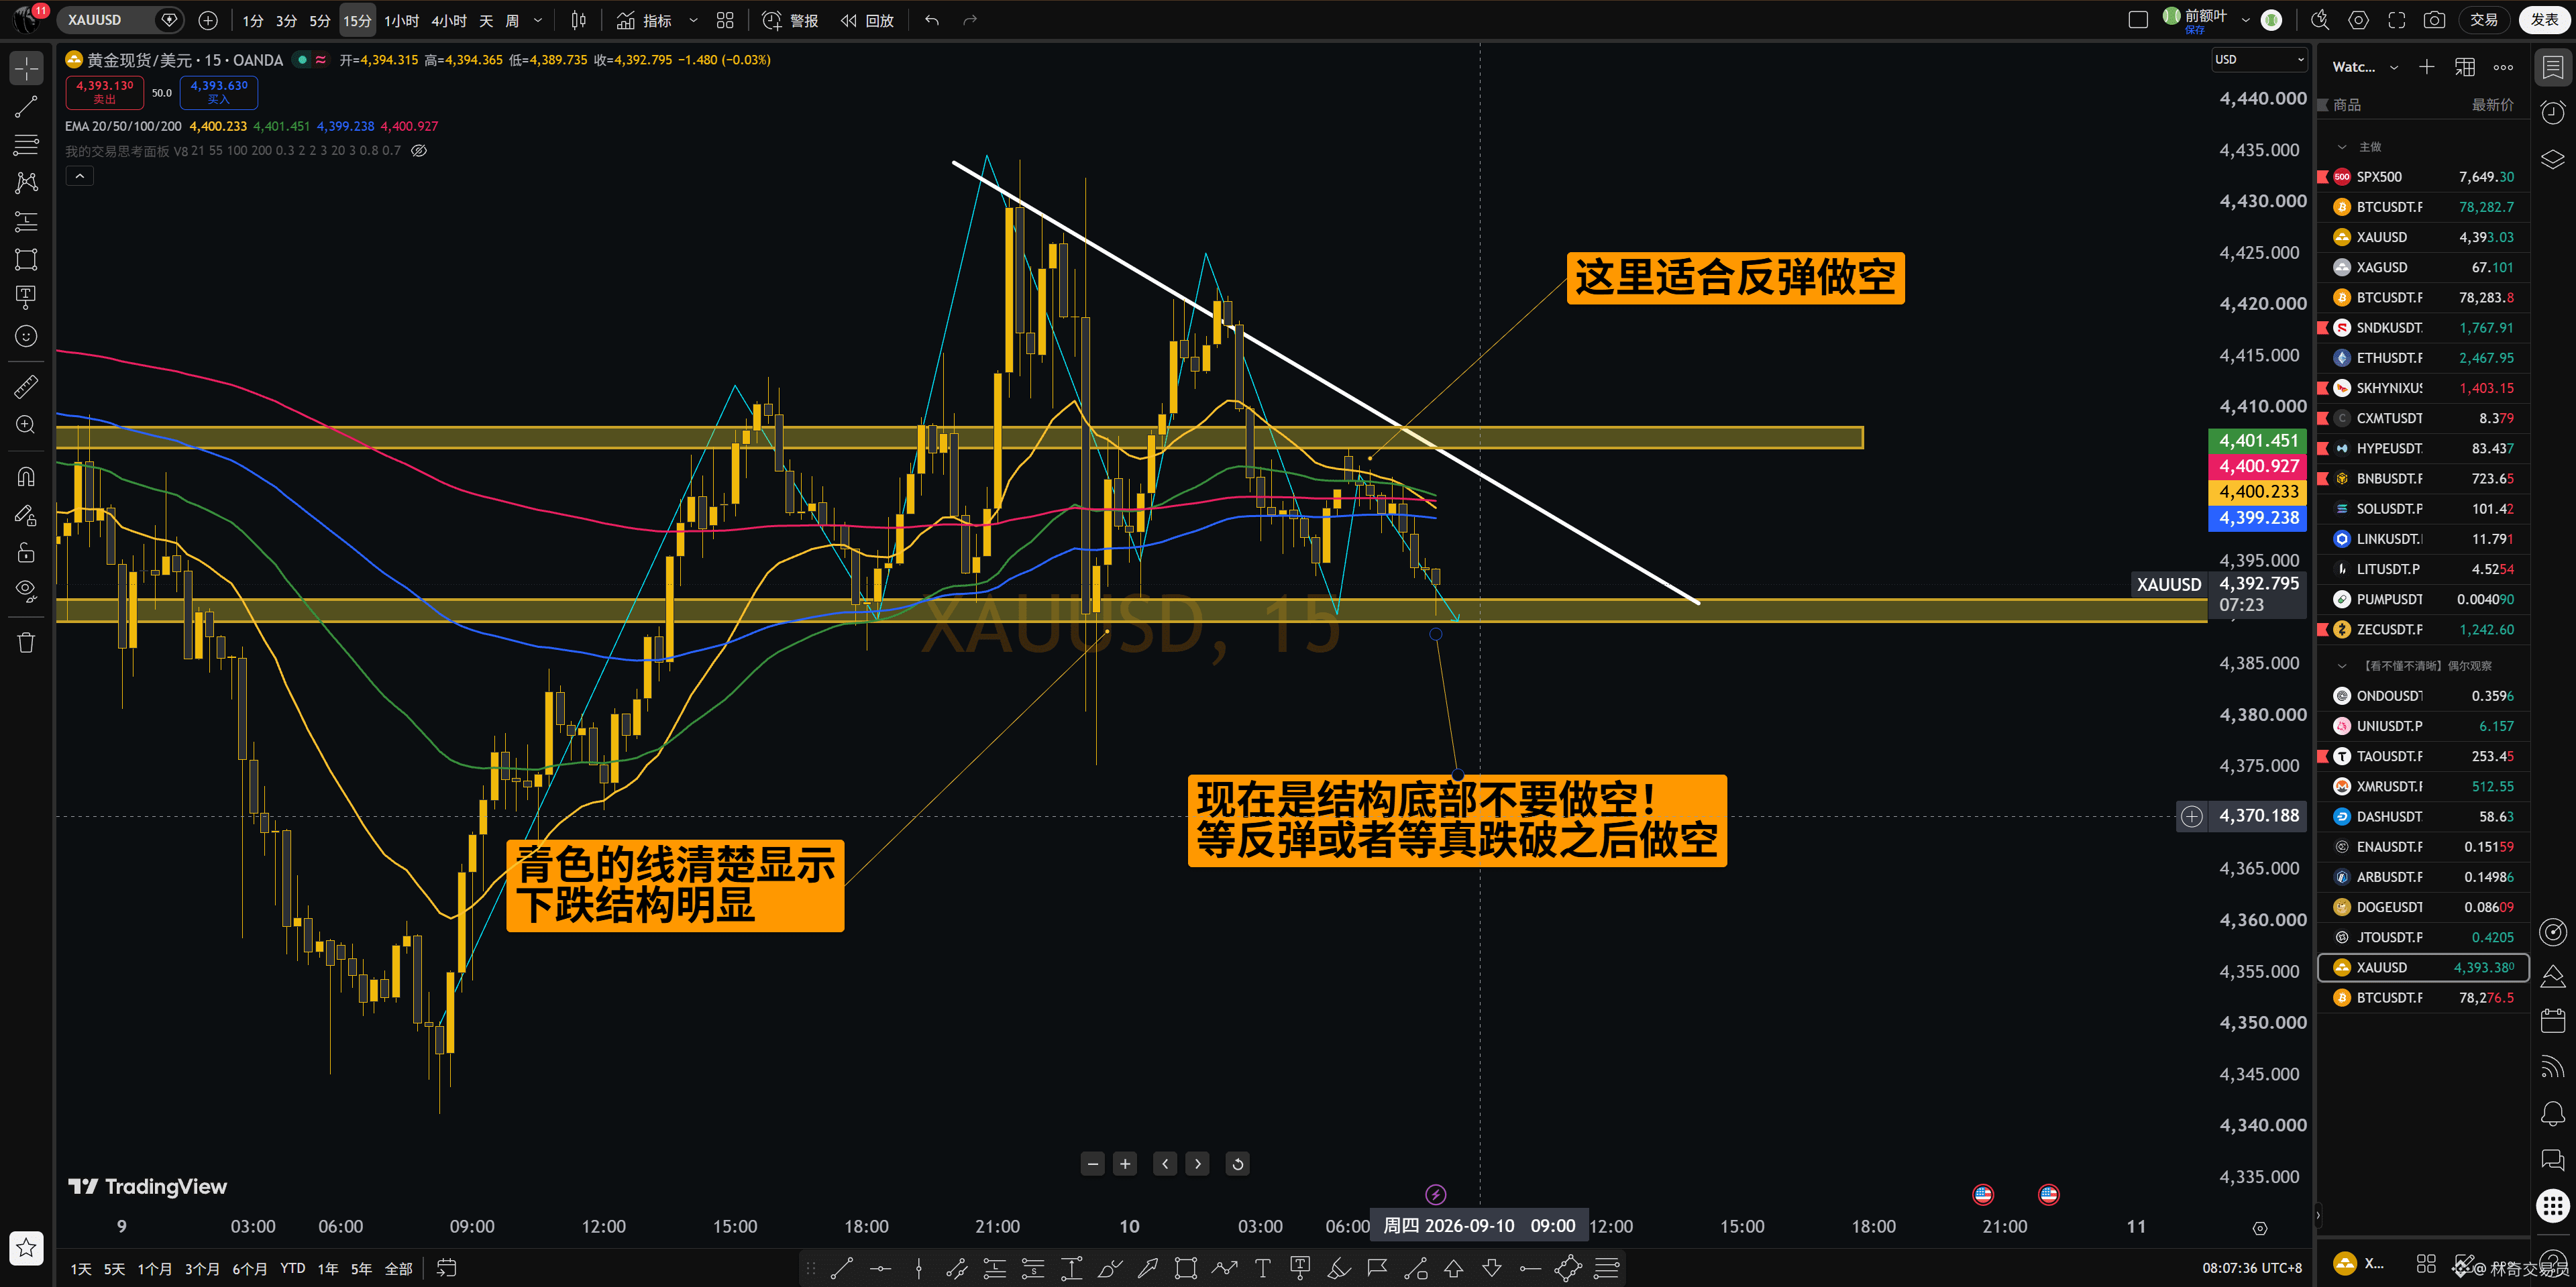
Gold Market Recap: Has the left-side rally ended? How should we position now?
Gold has delivered a typical right-side reversal signal:
① Structure: Lower highs (LH). The 1H moving average is bearish and dispersing, and the market is entering an overall range-to-downward cycle.
② Key levels: The 4H EMA200 has not yet been lost; there is still a need for a bounce near the previous low.
③ Core strategy: Focus mainly on “selling rallies from resistance,” with a better win rate and risk-reward ratio. Low-buy (long) is only for participation in bounces near the previous low, with small position sizing.
Summary: Understand the structure—don’t force it to catch every leg of the move. If you agree with the logic, please follow and I’ll keep sharing real-trade thinking.
$XAUT
{future}(XAUTUSDT)
#PAXG #XAU #黄金
Gold Market Recap: Has the left-side rally ended? How should we position now?
Gold has delivered a typical right-side reversal signal:
① Structure: Lower highs (LH). The 1H moving average is bearish and dispersing, and the market is entering an overall range-to-downward cycle.
② Key levels: The 4H EMA200 has not yet been lost; there is still a need for a bounce near the previous low.
③ Core strategy: Focus mainly on “selling rallies from resistance,” with a better win rate and risk-reward ratio. Low-buy (long) is only for participation in bounces near the previous low, with small position sizing.
Summary: Understand the structure—don’t force it to catch every leg of the move. If you agree with the logic, please follow and I’ll keep sharing real-trade thinking.
$XAUT
Gold Market Recap: Has the left-side rally ended? How should we position now?
Gold has delivered a typical right-side reversal signal:
① Structure: Lower highs (LH). The 1H moving average is bearish and dispersing, and the market is entering an overall range-to-downward cycle.
② Key levels: The 4H EMA200 has not yet been lost; there is still a need for a bounce near the previous low.
③ Core strategy: Focus mainly on “selling rallies from resistance,” with a better win rate and risk-reward ratio. Low-buy (long) is only for participation in bounces near the previous low, with small position sizing.
Summary: Understand the structure—don’t force it to catch every leg of the move. If you agree with the logic, please follow and I’ll keep sharing real-trade thinking.
$XAUT
1
211
·
--
Bearish
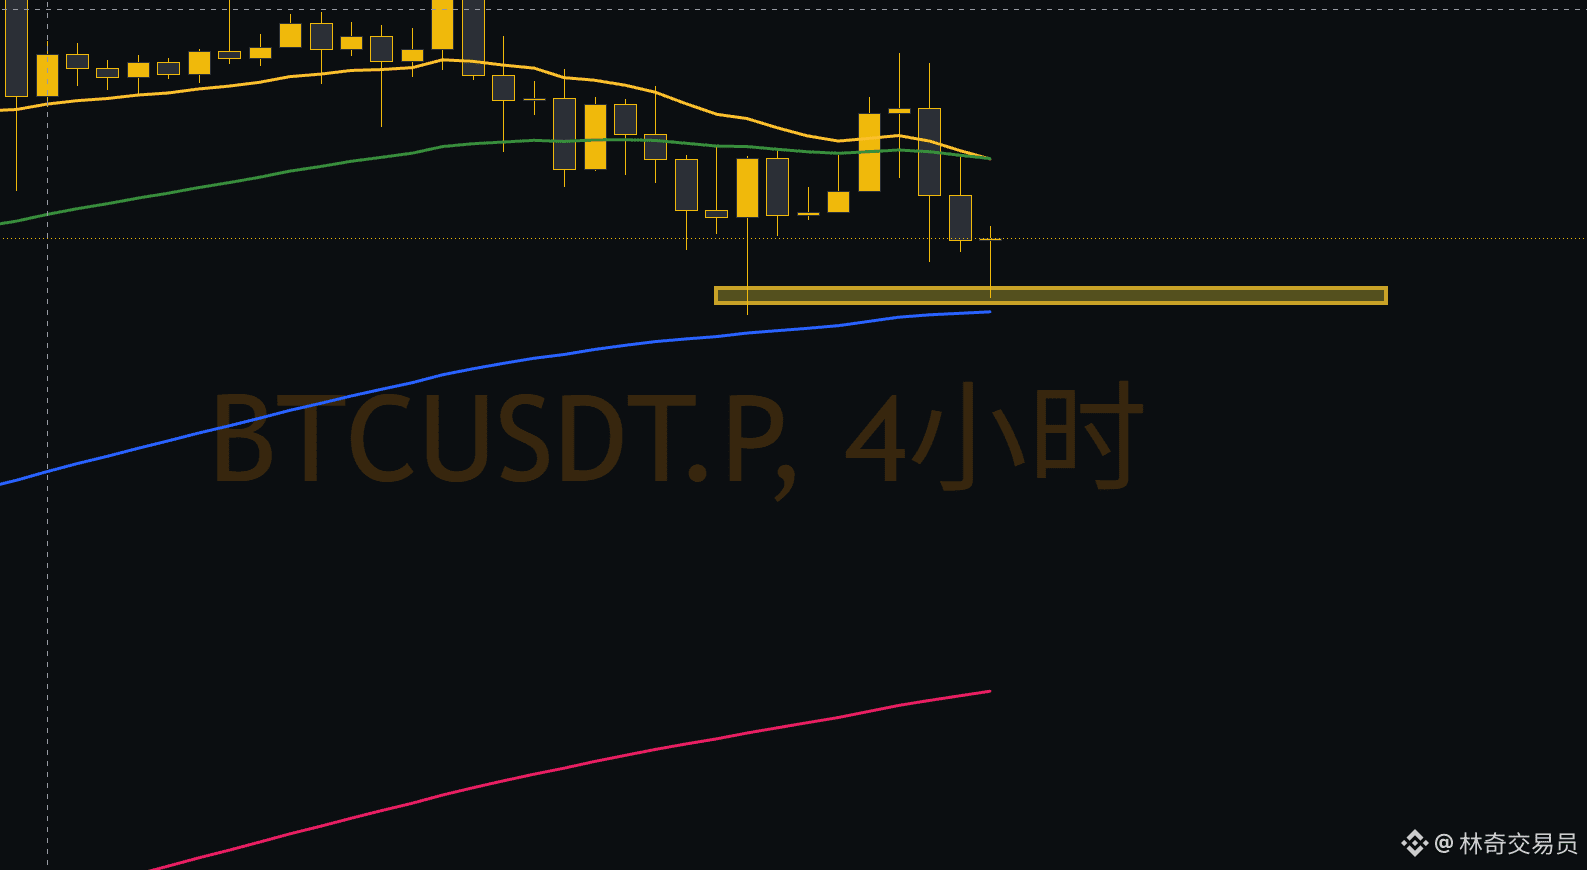
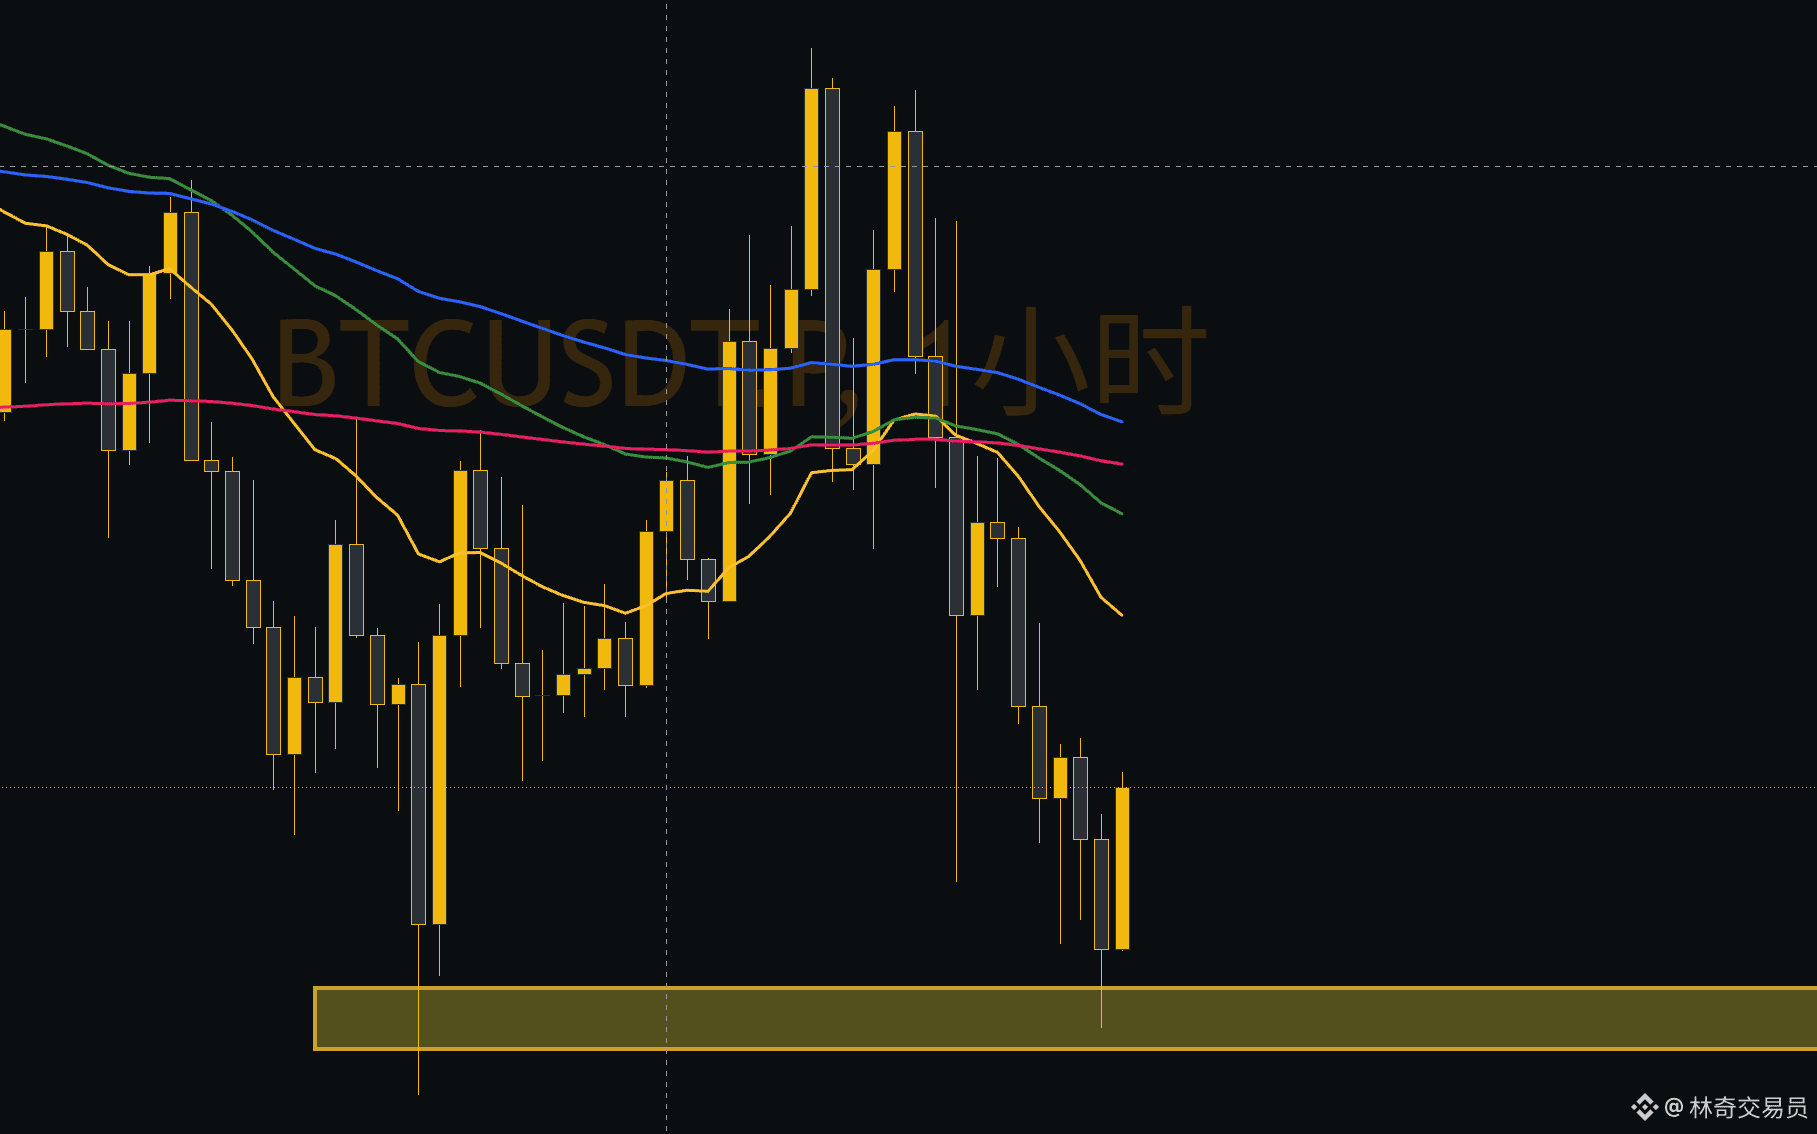
$BTC Market recap: bullish on the daily chart, bearish on the short term—how to set a risk-reward plan?
Currently, BTC is showing a typical multi-timeframe divergence:
① Higher level: the daily chart looks bullish, but the 4H support is weak.
② Lower level: the 1H/15M charts are in a standard bearish alignment, with lower highs and lower lows—an established downtrend.
③ Core strategy: align with the lower-timeframe cycle resonance to go short, but never chase lows.
Trade details: wait for a rebound into the key resistance zone ([Resistance 1: 78343.6] / [Resistance 2: 78828.7]); only enter again when the lower timeframe shows exhaustion or a reversal structure.
No structure, no trading. If you agree with the logic, give it a follow and keep sharing real-time trade ideas.
#BTC走势分析
$BTC Market recap: bullish on the daily chart, bearish on the short term—how to set a risk-reward plan?
Currently, BTC is showing a typical multi-timeframe divergence:
① Higher level: the daily chart looks bullish, but the 4H support is weak.
② Lower level: the 1H/15M charts are in a standard bearish alignment, with lower highs and lower lows—an established downtrend.
③ Core strategy: align with the lower-timeframe cycle resonance to go short, but never chase lows.
Trade details: wait for a rebound into the key resistance zone ([Resistance 1: 78343.6] / [Resistance 2: 78828.7]); only enter again when the lower timeframe shows exhaustion or a reversal structure.
No structure, no trading. If you agree with the logic, give it a follow and keep sharing real-time trade ideas.
#BTC走势分析
Currently, BTC is showing a typical multi-timeframe divergence:
① Higher level: the daily chart looks bullish, but the 4H support is weak.
② Lower level: the 1H/15M charts are in a standard bearish alignment, with lower highs and lower lows—an established downtrend.
③ Core strategy: align with the lower-timeframe cycle resonance to go short, but never chase lows.
Trade details: wait for a rebound into the key resistance zone ([Resistance 1: 78343.6] / [Resistance 2: 78828.7]); only enter again when the lower timeframe shows exhaustion or a reversal structure.
No structure, no trading. If you agree with the logic, give it a follow and keep sharing real-time trade ideas.
#BTC走势分析
108
·
--
$XAU The Golden Bullish Rebound: Review of a Long Trade — Learn to “Take Profits When You’ve Done Well”
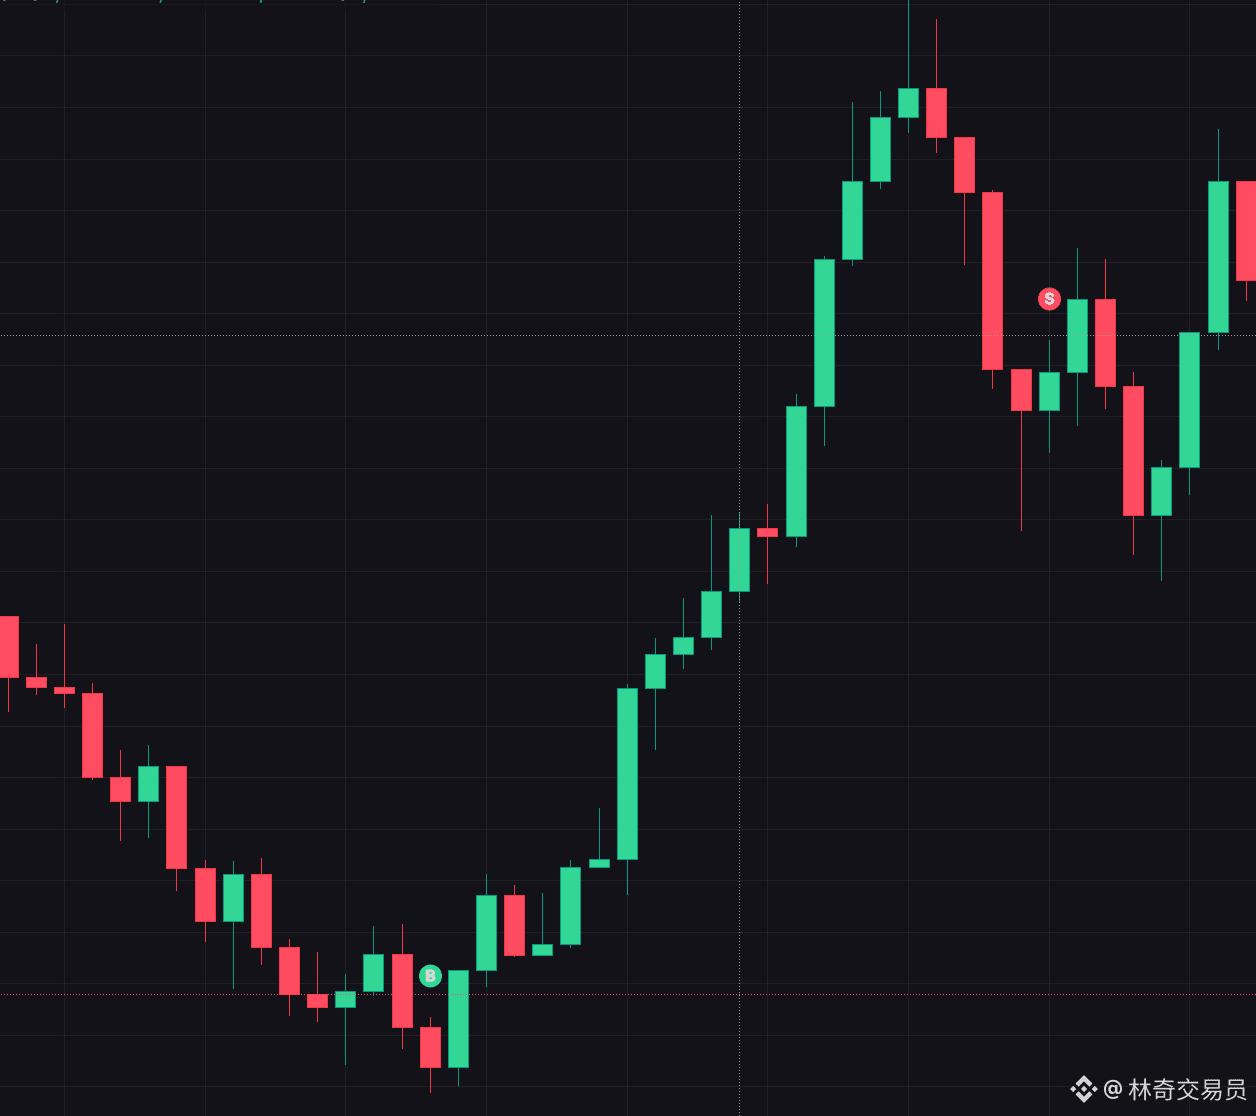
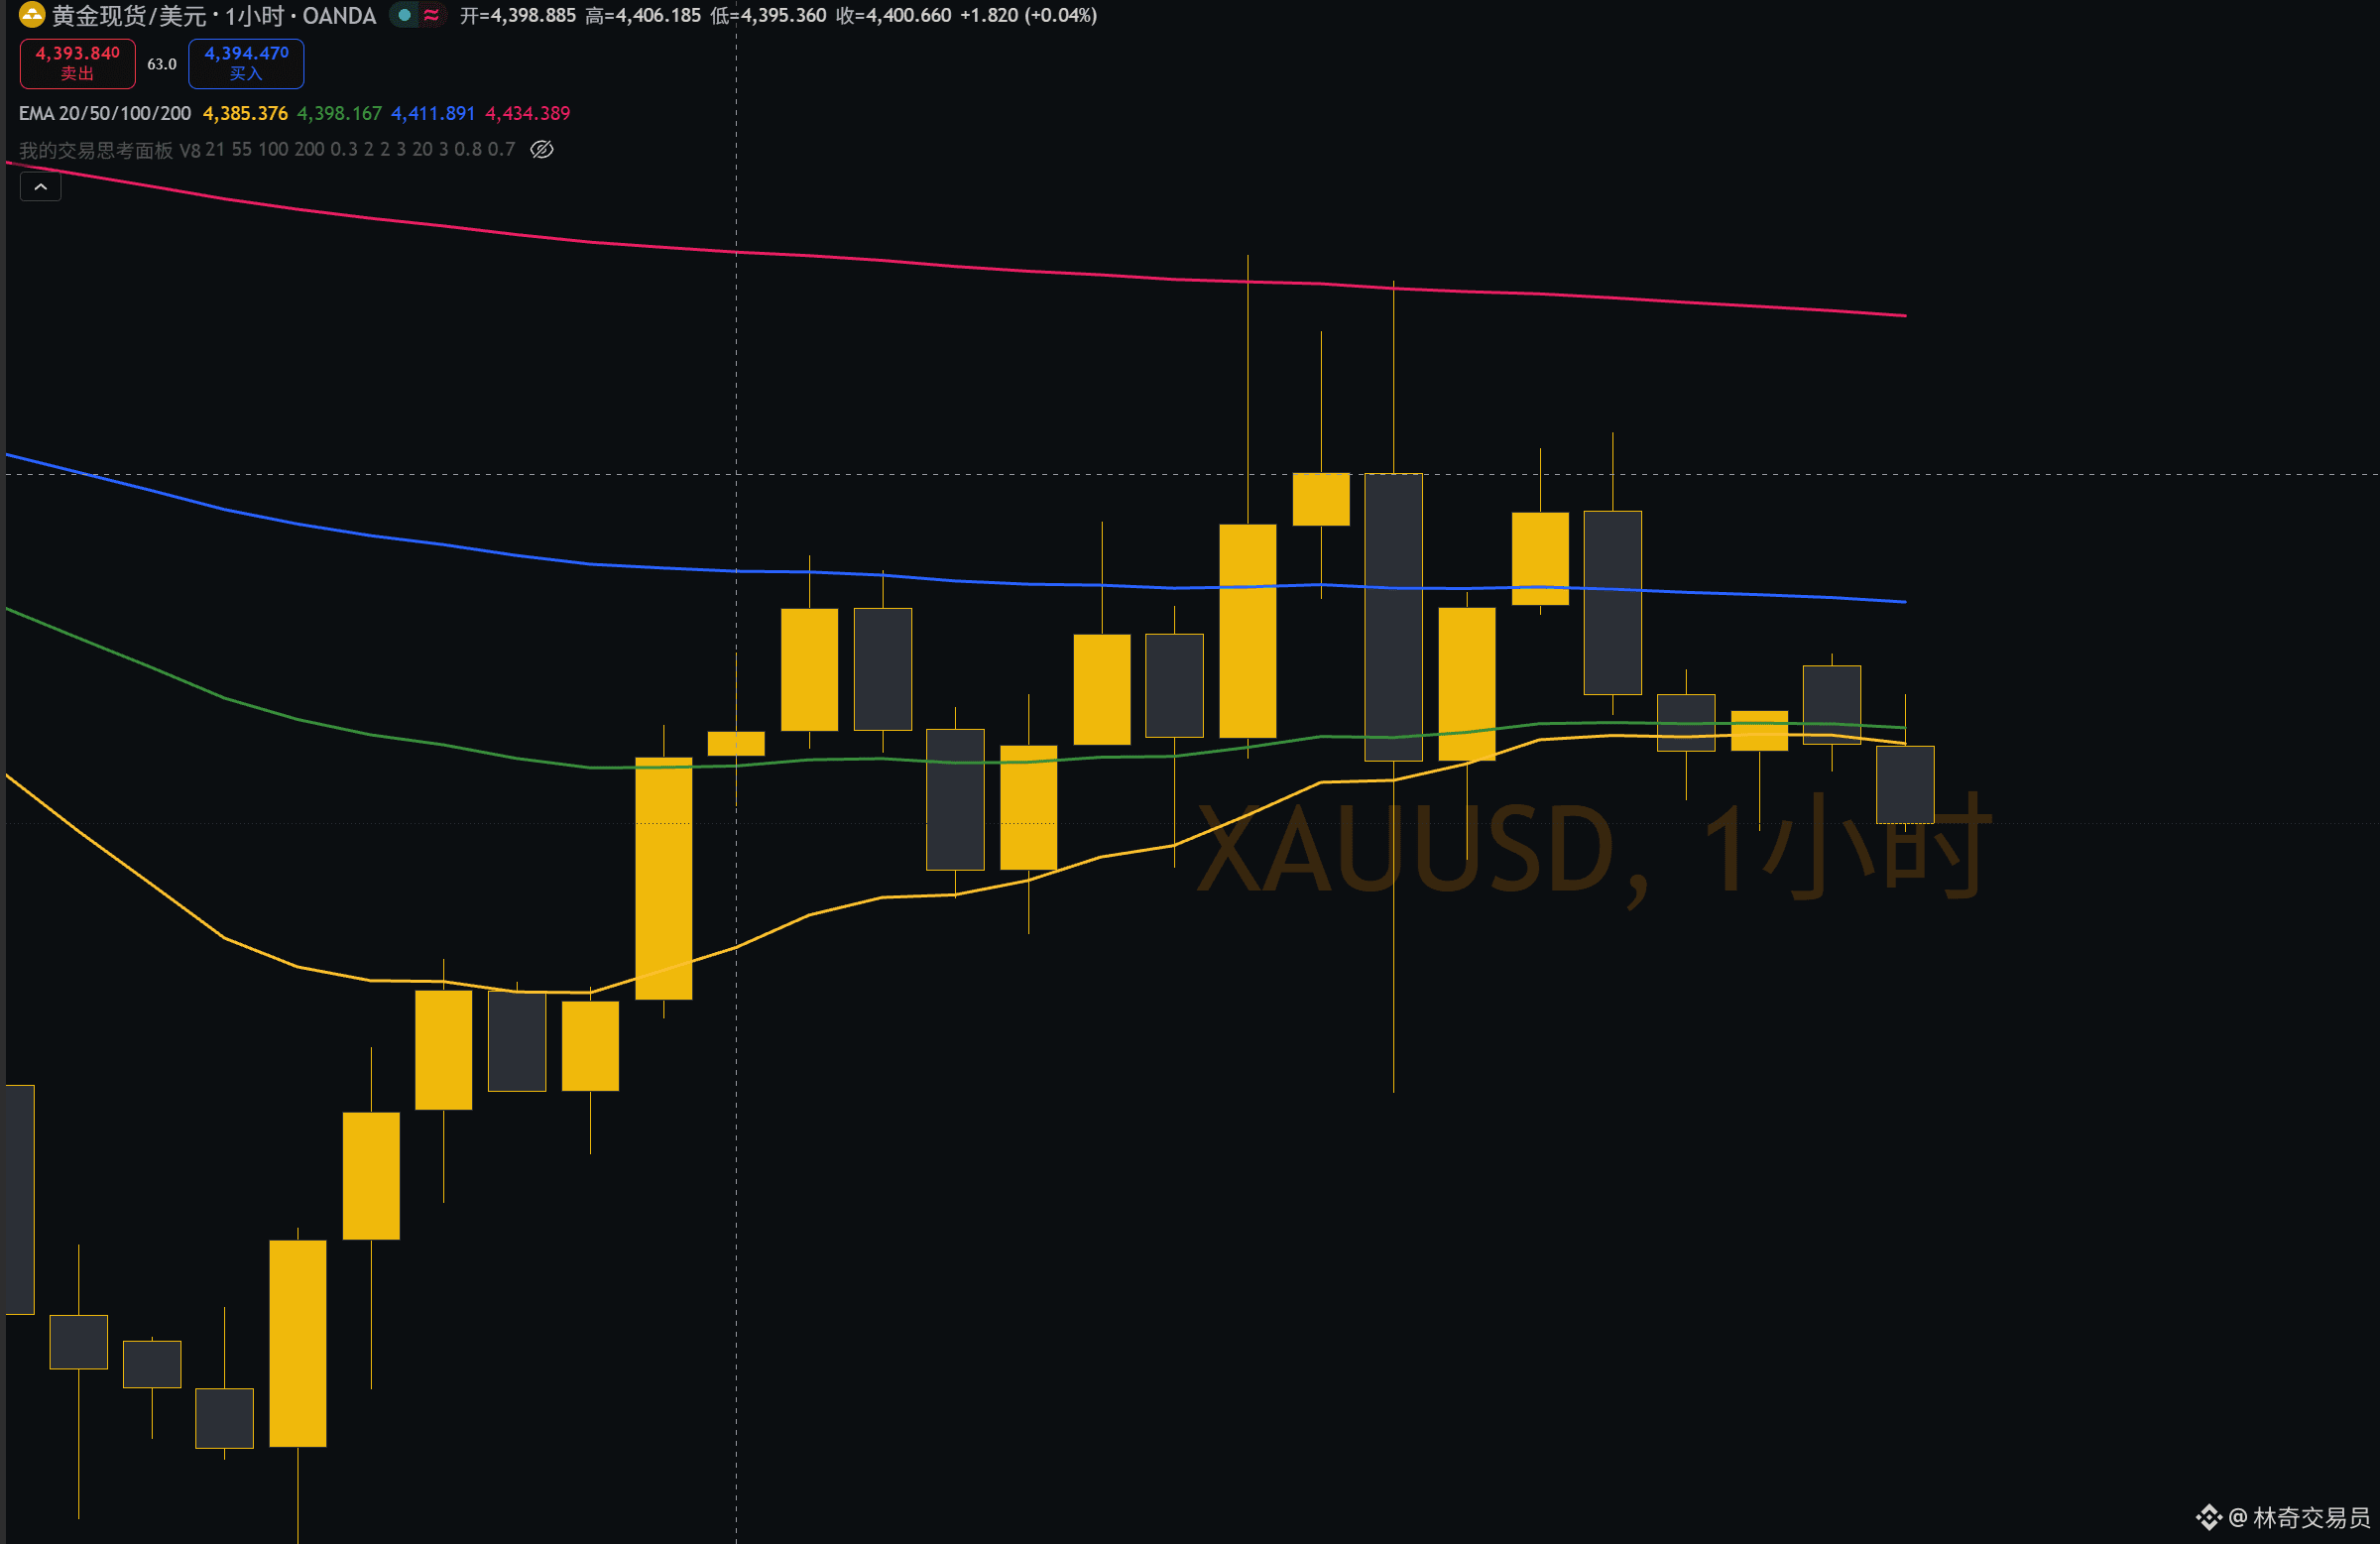
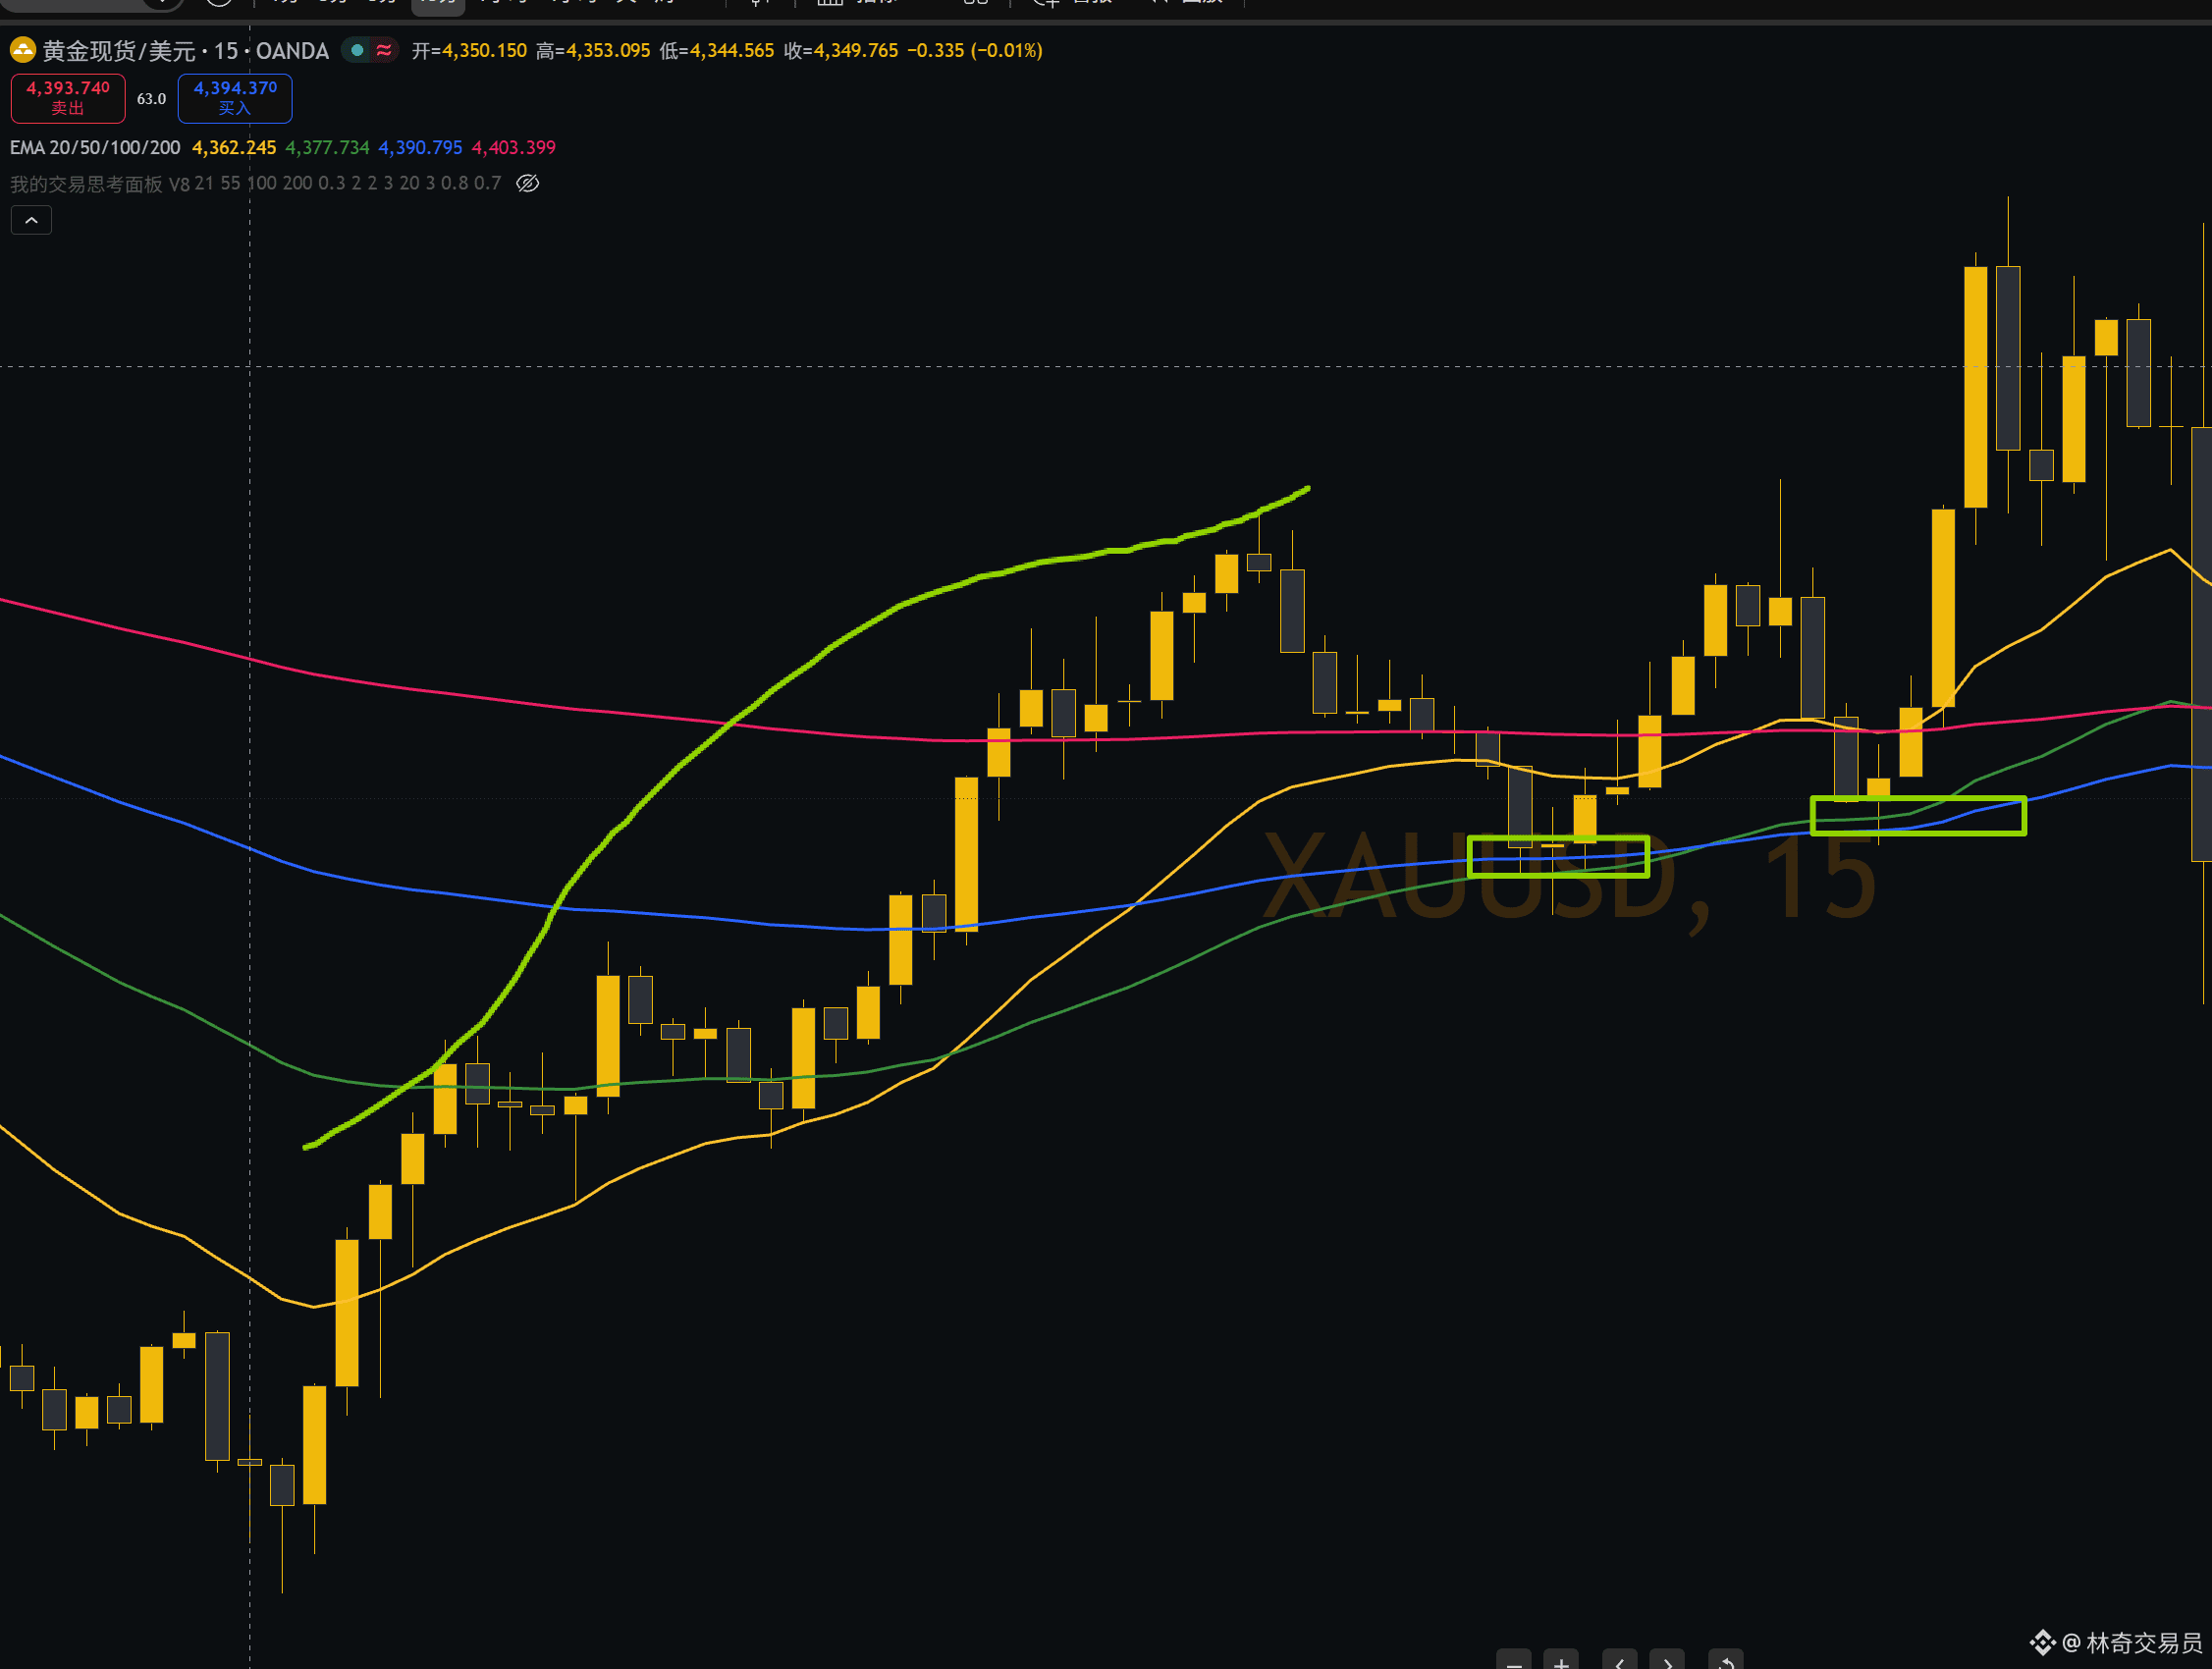
Yesterday we caught a round of a gold rebound; the logic is simple:
① Observation: Although the 1H is arranged bearish, the bottom shows strong rebound, indicating short-term buyers entering the market. ② Entry: Don’t chase the price. Wait until price rises and then meets resistance; place a buy order at the structural support level [4,396.76]. ③ Take Profit: When the price rebounds to the overlap zone of the 1H structure prior high + the 200 moving average (4,421.32), close the position immediately.
Summary: When trading a rebound, don’t get greedy for the bigger trend—exit as soon as you hit the double resistance levels.
If you agree with this logic, welcome to follow for continuous updates on real-time trading ideas.
#黄金
$XAU The Golden Bullish Rebound: Review of a Long Trade — Learn to “Take Profits When You’ve Done Well”
Yesterday we caught a round of a gold rebound; the logic is simple:
① Observation: Although the 1H is arranged bearish, the bottom shows strong rebound, indicating short-term buyers entering the market. ② Entry: Don’t chase the price. Wait until price rises and then meets resistance; place a buy order at the structural support level [4,396.76]. ③ Take Profit: When the price rebounds to the overlap zone of the 1H structure prior high + the 200 moving average (4,421.32), close the position immediately.
Summary: When trading a rebound, don’t get greedy for the bigger trend—exit as soon as you hit the double resistance levels.
If you agree with this logic, welcome to follow for continuous updates on real-time trading ideas.
#黄金
Yesterday we caught a round of a gold rebound; the logic is simple:
① Observation: Although the 1H is arranged bearish, the bottom shows strong rebound, indicating short-term buyers entering the market. ② Entry: Don’t chase the price. Wait until price rises and then meets resistance; place a buy order at the structural support level [4,396.76]. ③ Take Profit: When the price rebounds to the overlap zone of the 1H structure prior high + the 200 moving average (4,421.32), close the position immediately.
Summary: When trading a rebound, don’t get greedy for the bigger trend—exit as soon as you hit the double resistance levels.
If you agree with this logic, welcome to follow for continuous updates on real-time trading ideas.
#黄金
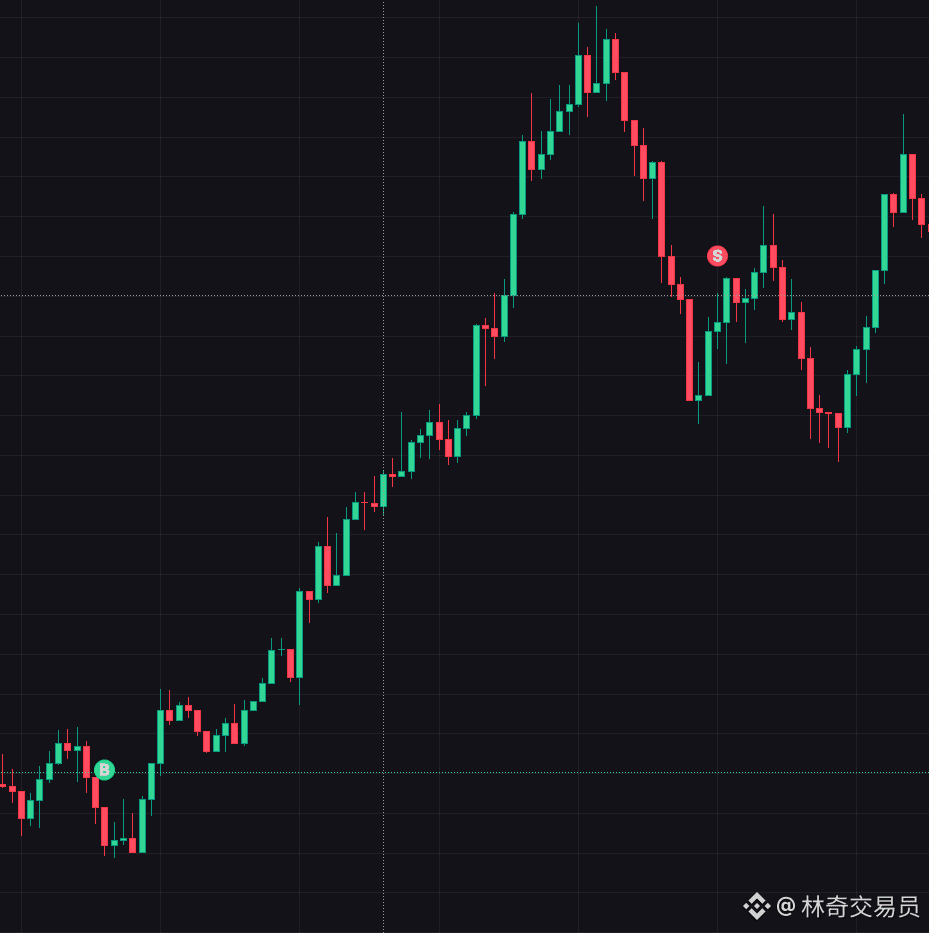
175
·
--
We’re starting to make real progress.
We’re starting to make real progress.


币安广场
·
--
How to post to get more traffic? First, check out this content diagnostic checklist
#创作者学院 The plaza interns are here to report! Every day I scroll through the posts on the plaza and see so many posts that obviously have something valuable, yet still can’t get out to the wider audience because of some small issue. It’s really a pity for everyone. So I’ve整理 my everyday observations of what gets posted well and what gets posted regrettably into this diagnostic checklist. Let me put it bluntly: trading-related content in the plaza is indeed what users are more interested in, but just because you write about trading doesn’t mean you’ll automatically get traffic. The key is how you write it.
1. How should the trading content be written?
Remember this universal formula: bullish/bearish view + opinion + share proof (screenshots/orders)
1. How should the trading content be written?
Remember this universal formula: bullish/bearish view + opinion + share proof (screenshots/orders)

45

·
--
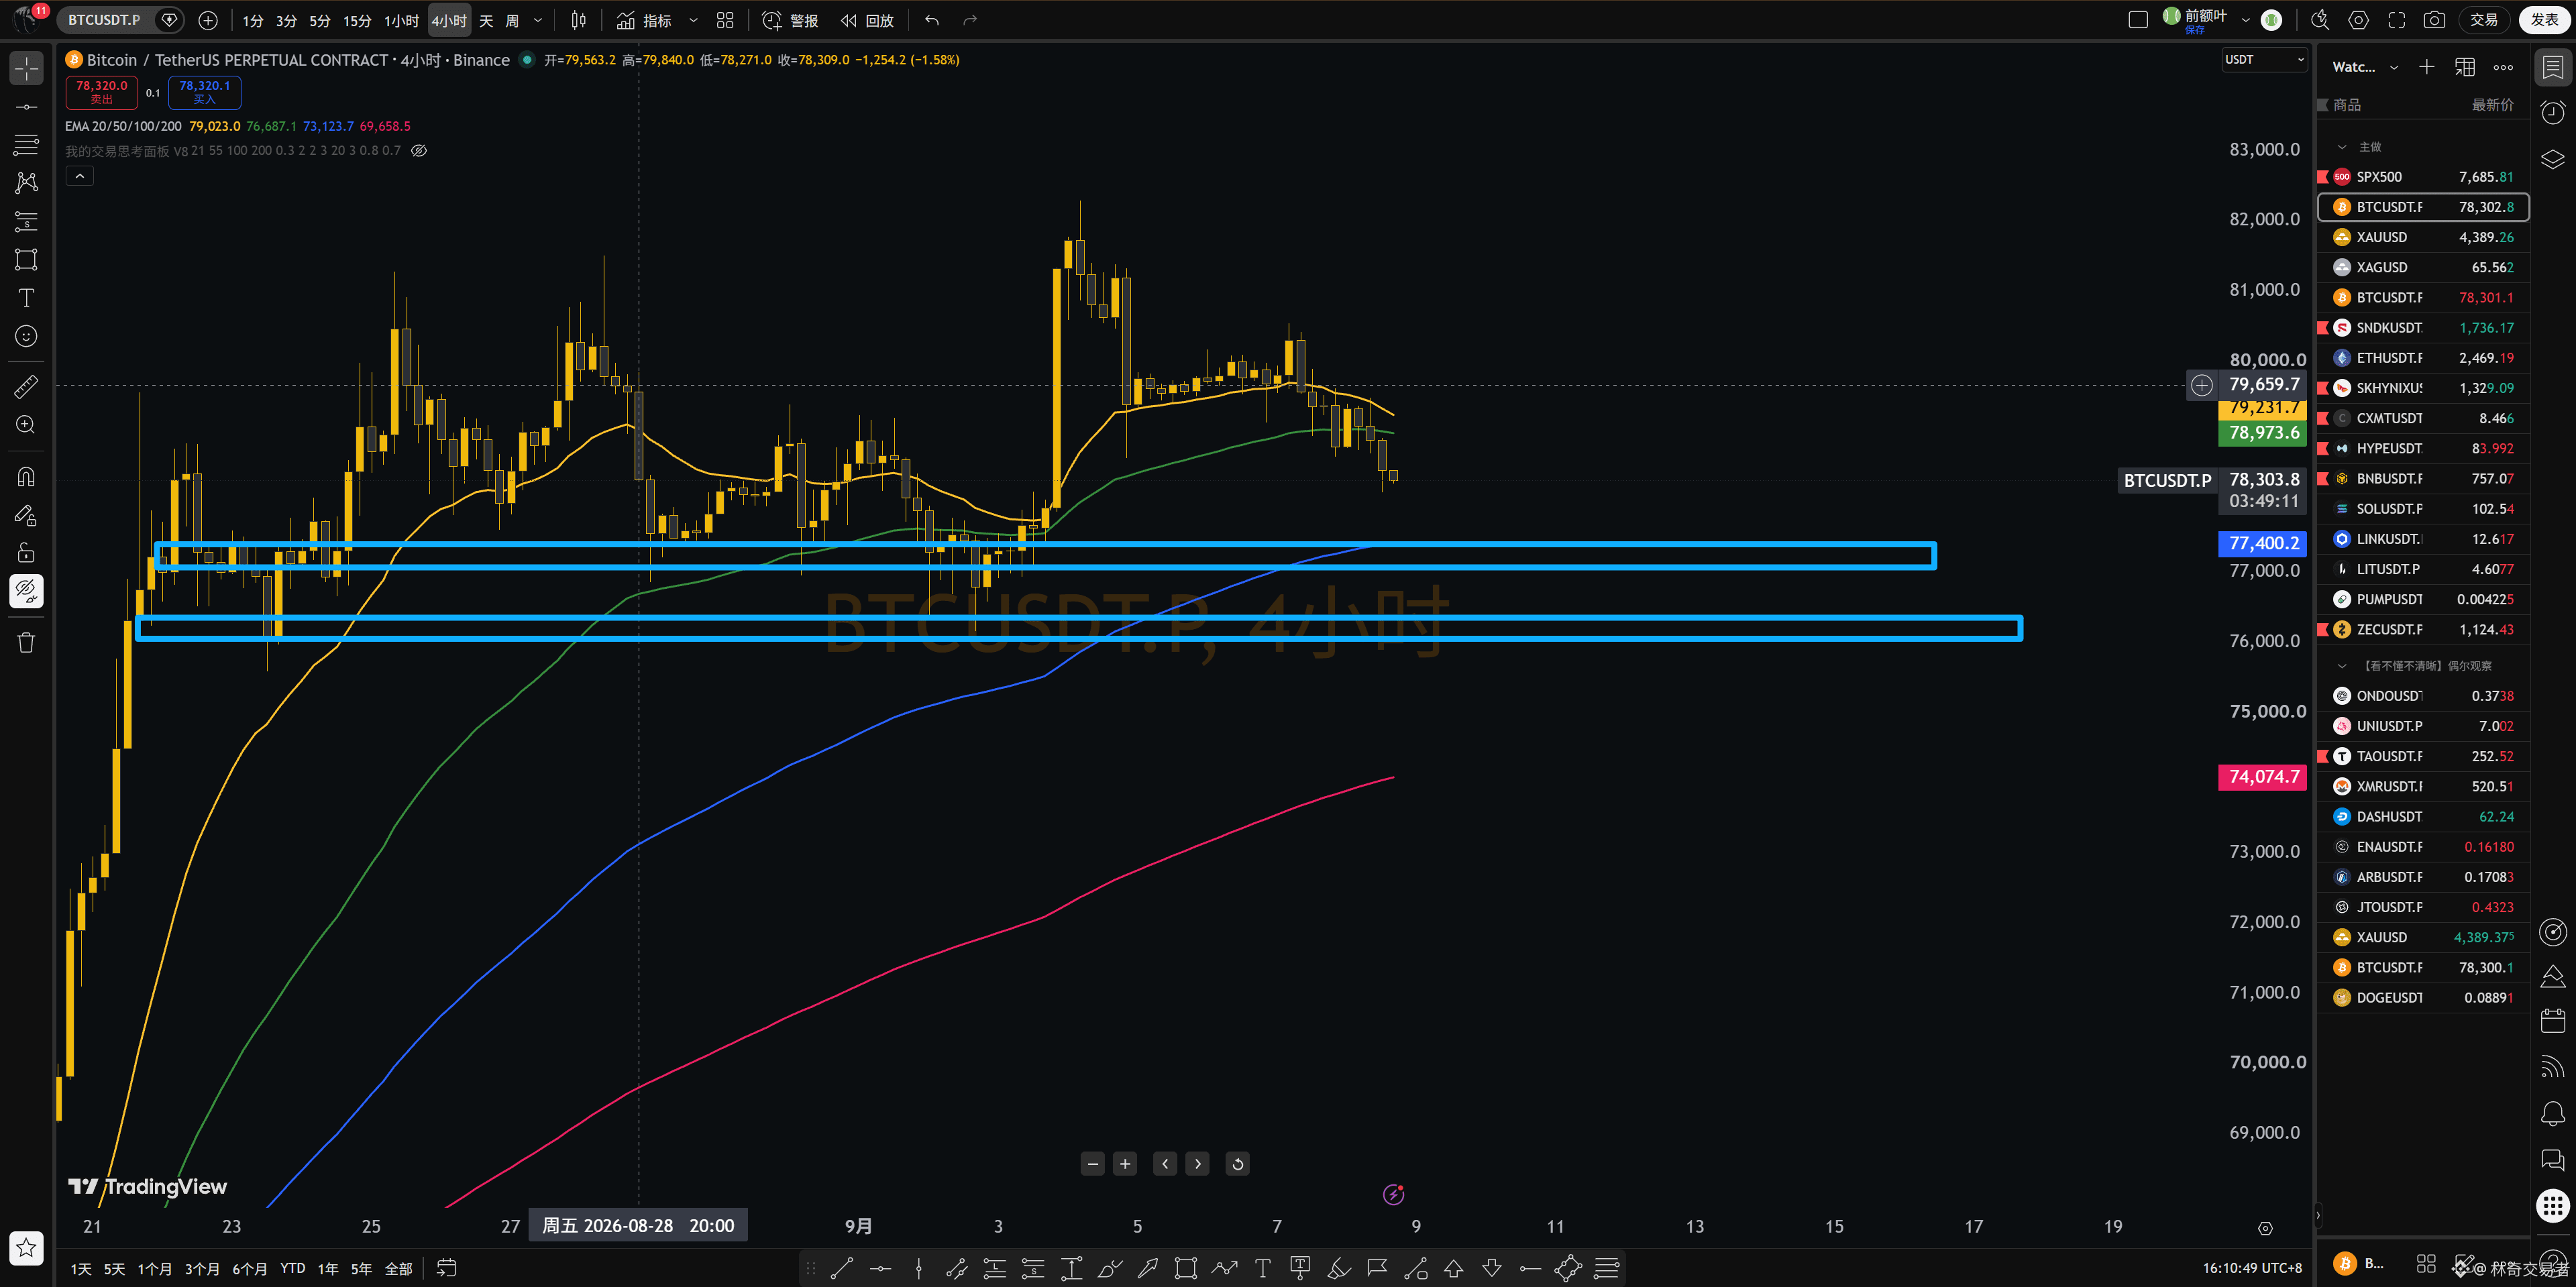
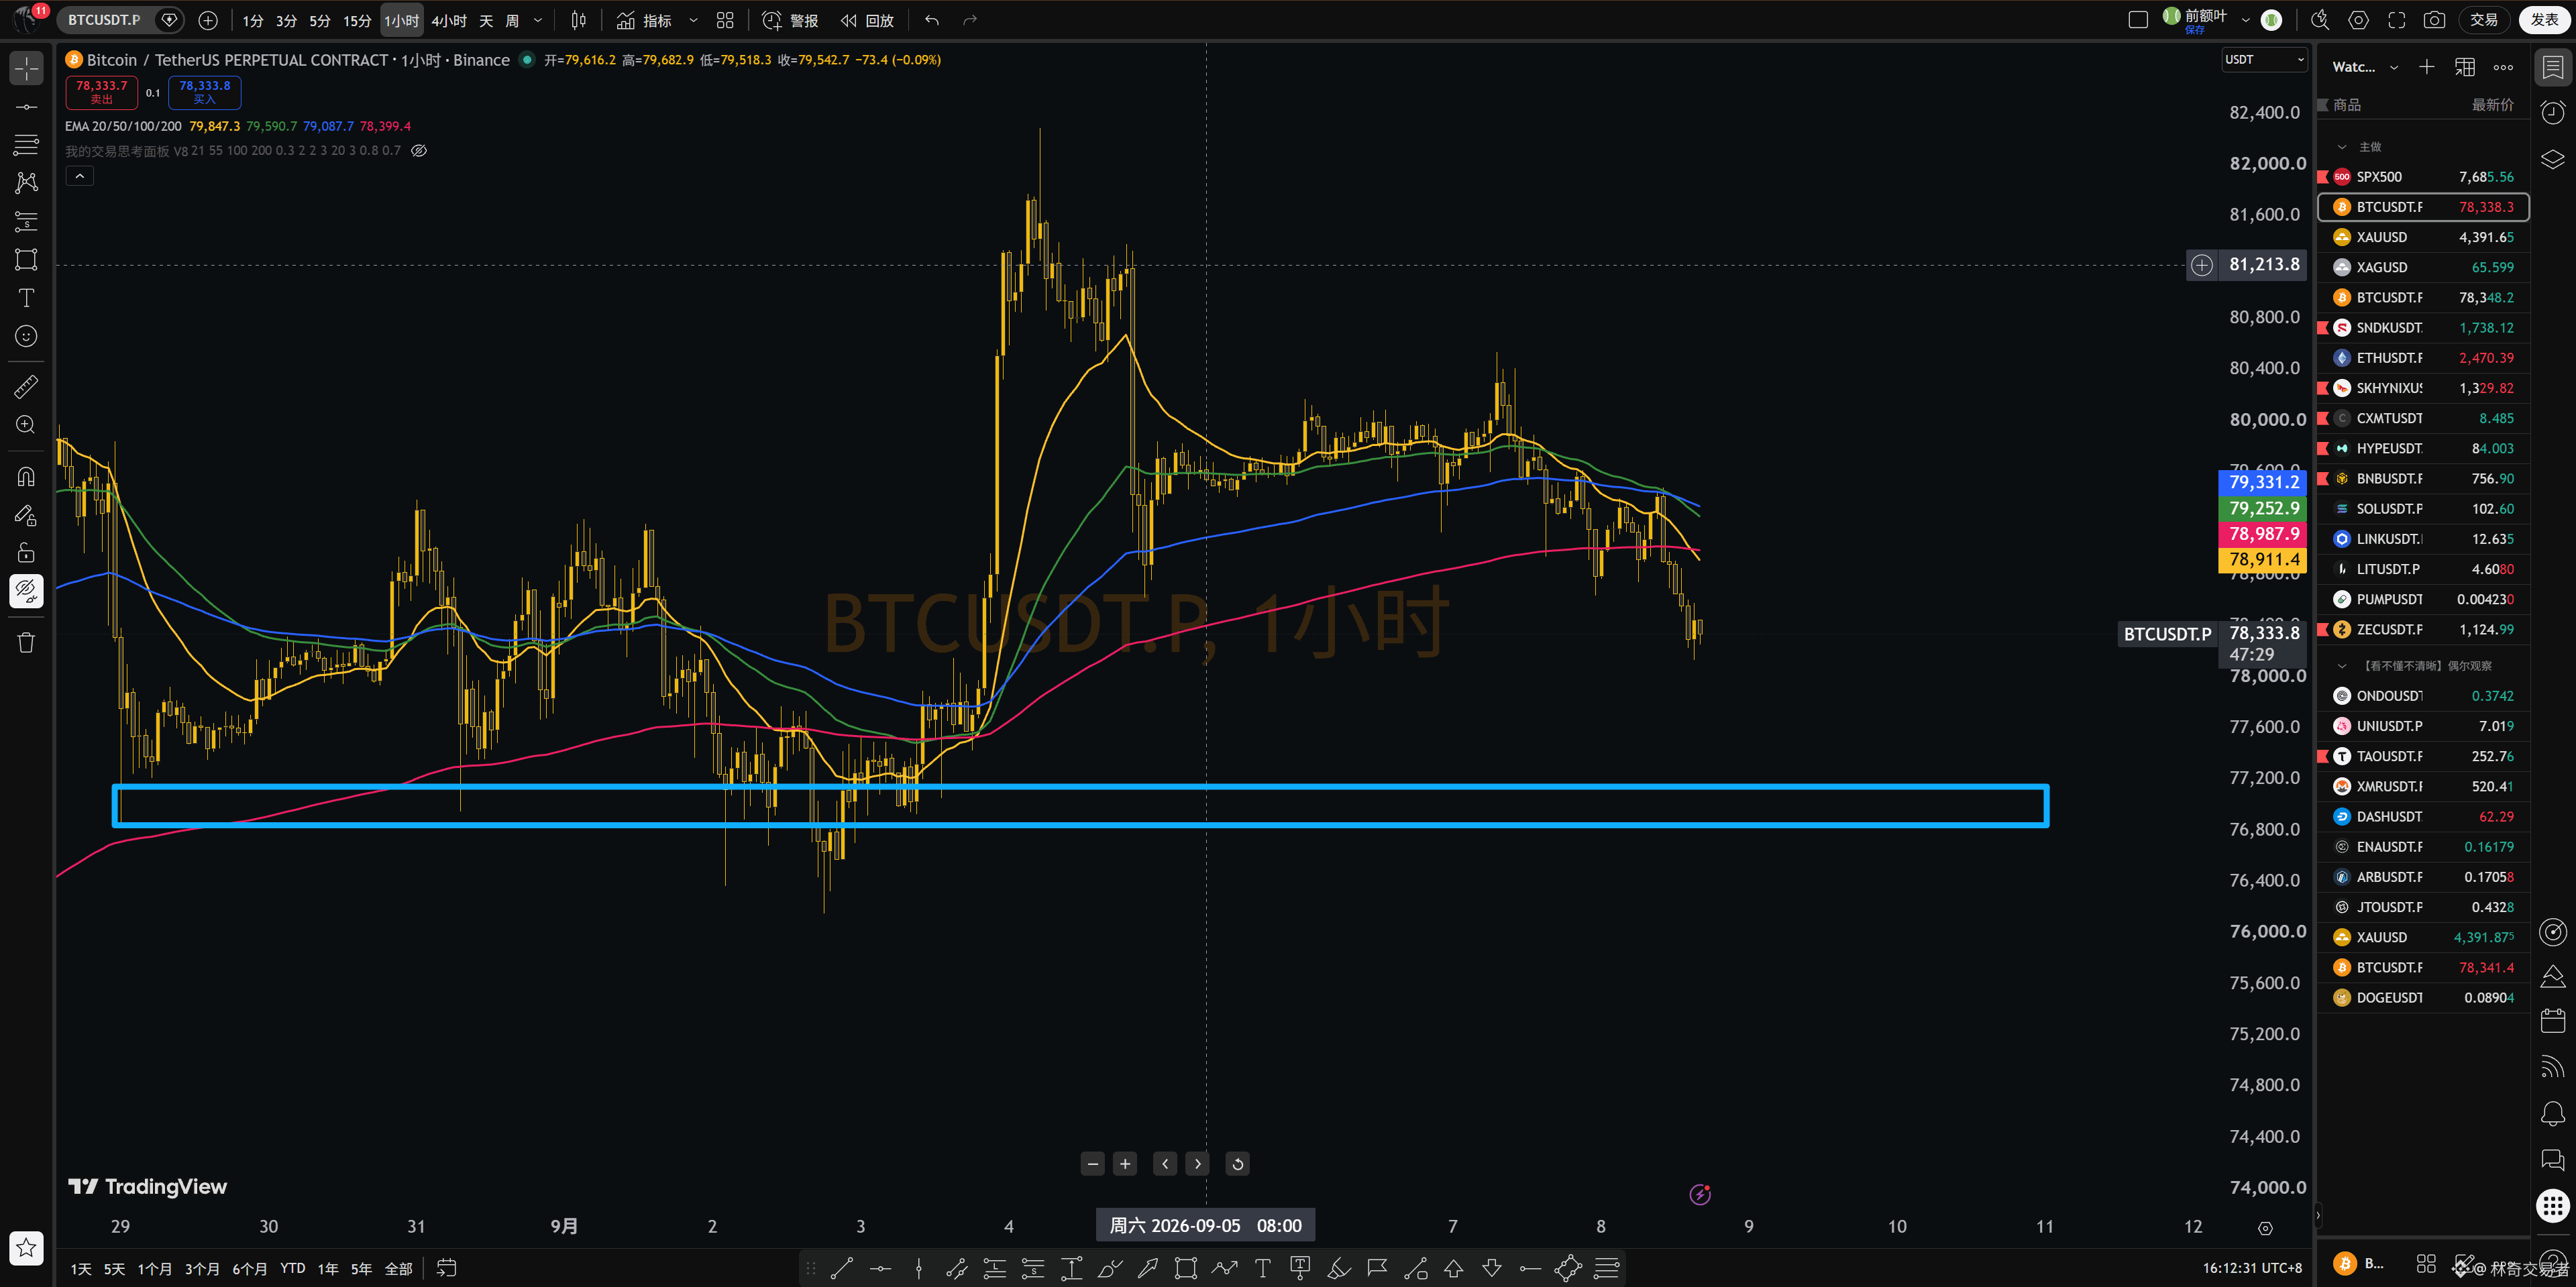
$BTC Looking at the moving averages, the daily chart is still mainly bullish.
What’s not good is that the 4-hour has already broken below 21, and the 1-hour has broken below 200 and moved into a bearish formation—this is contradictory.
So it depends on whether you trade short-term or long-term. For short-term (1-hour), take the bounce to short.
If you want to go long, wait for the blue area. On the 1-hour chart it still looks like there may be further downside, but don’t chase a short directly.
Short again on the rebound.
{future}(BTCUSDT)
$BTC Looking at the moving averages, the daily chart is still mainly bullish.
What’s not good is that the 4-hour has already broken below 21, and the 1-hour has broken below 200 and moved into a bearish formation—this is contradictory.
So it depends on whether you trade short-term or long-term. For short-term (1-hour), take the bounce to short.
If you want to go long, wait for the blue area. On the 1-hour chart it still looks like there may be further downside, but don’t chase a short directly.
Short again on the rebound.
What’s not good is that the 4-hour has already broken below 21, and the 1-hour has broken below 200 and moved into a bearish formation—this is contradictory.
So it depends on whether you trade short-term or long-term. For short-term (1-hour), take the bounce to short.
If you want to go long, wait for the blue area. On the 1-hour chart it still looks like there may be further downside, but don’t chase a short directly.
Short again on the rebound.
1.6k
·
--
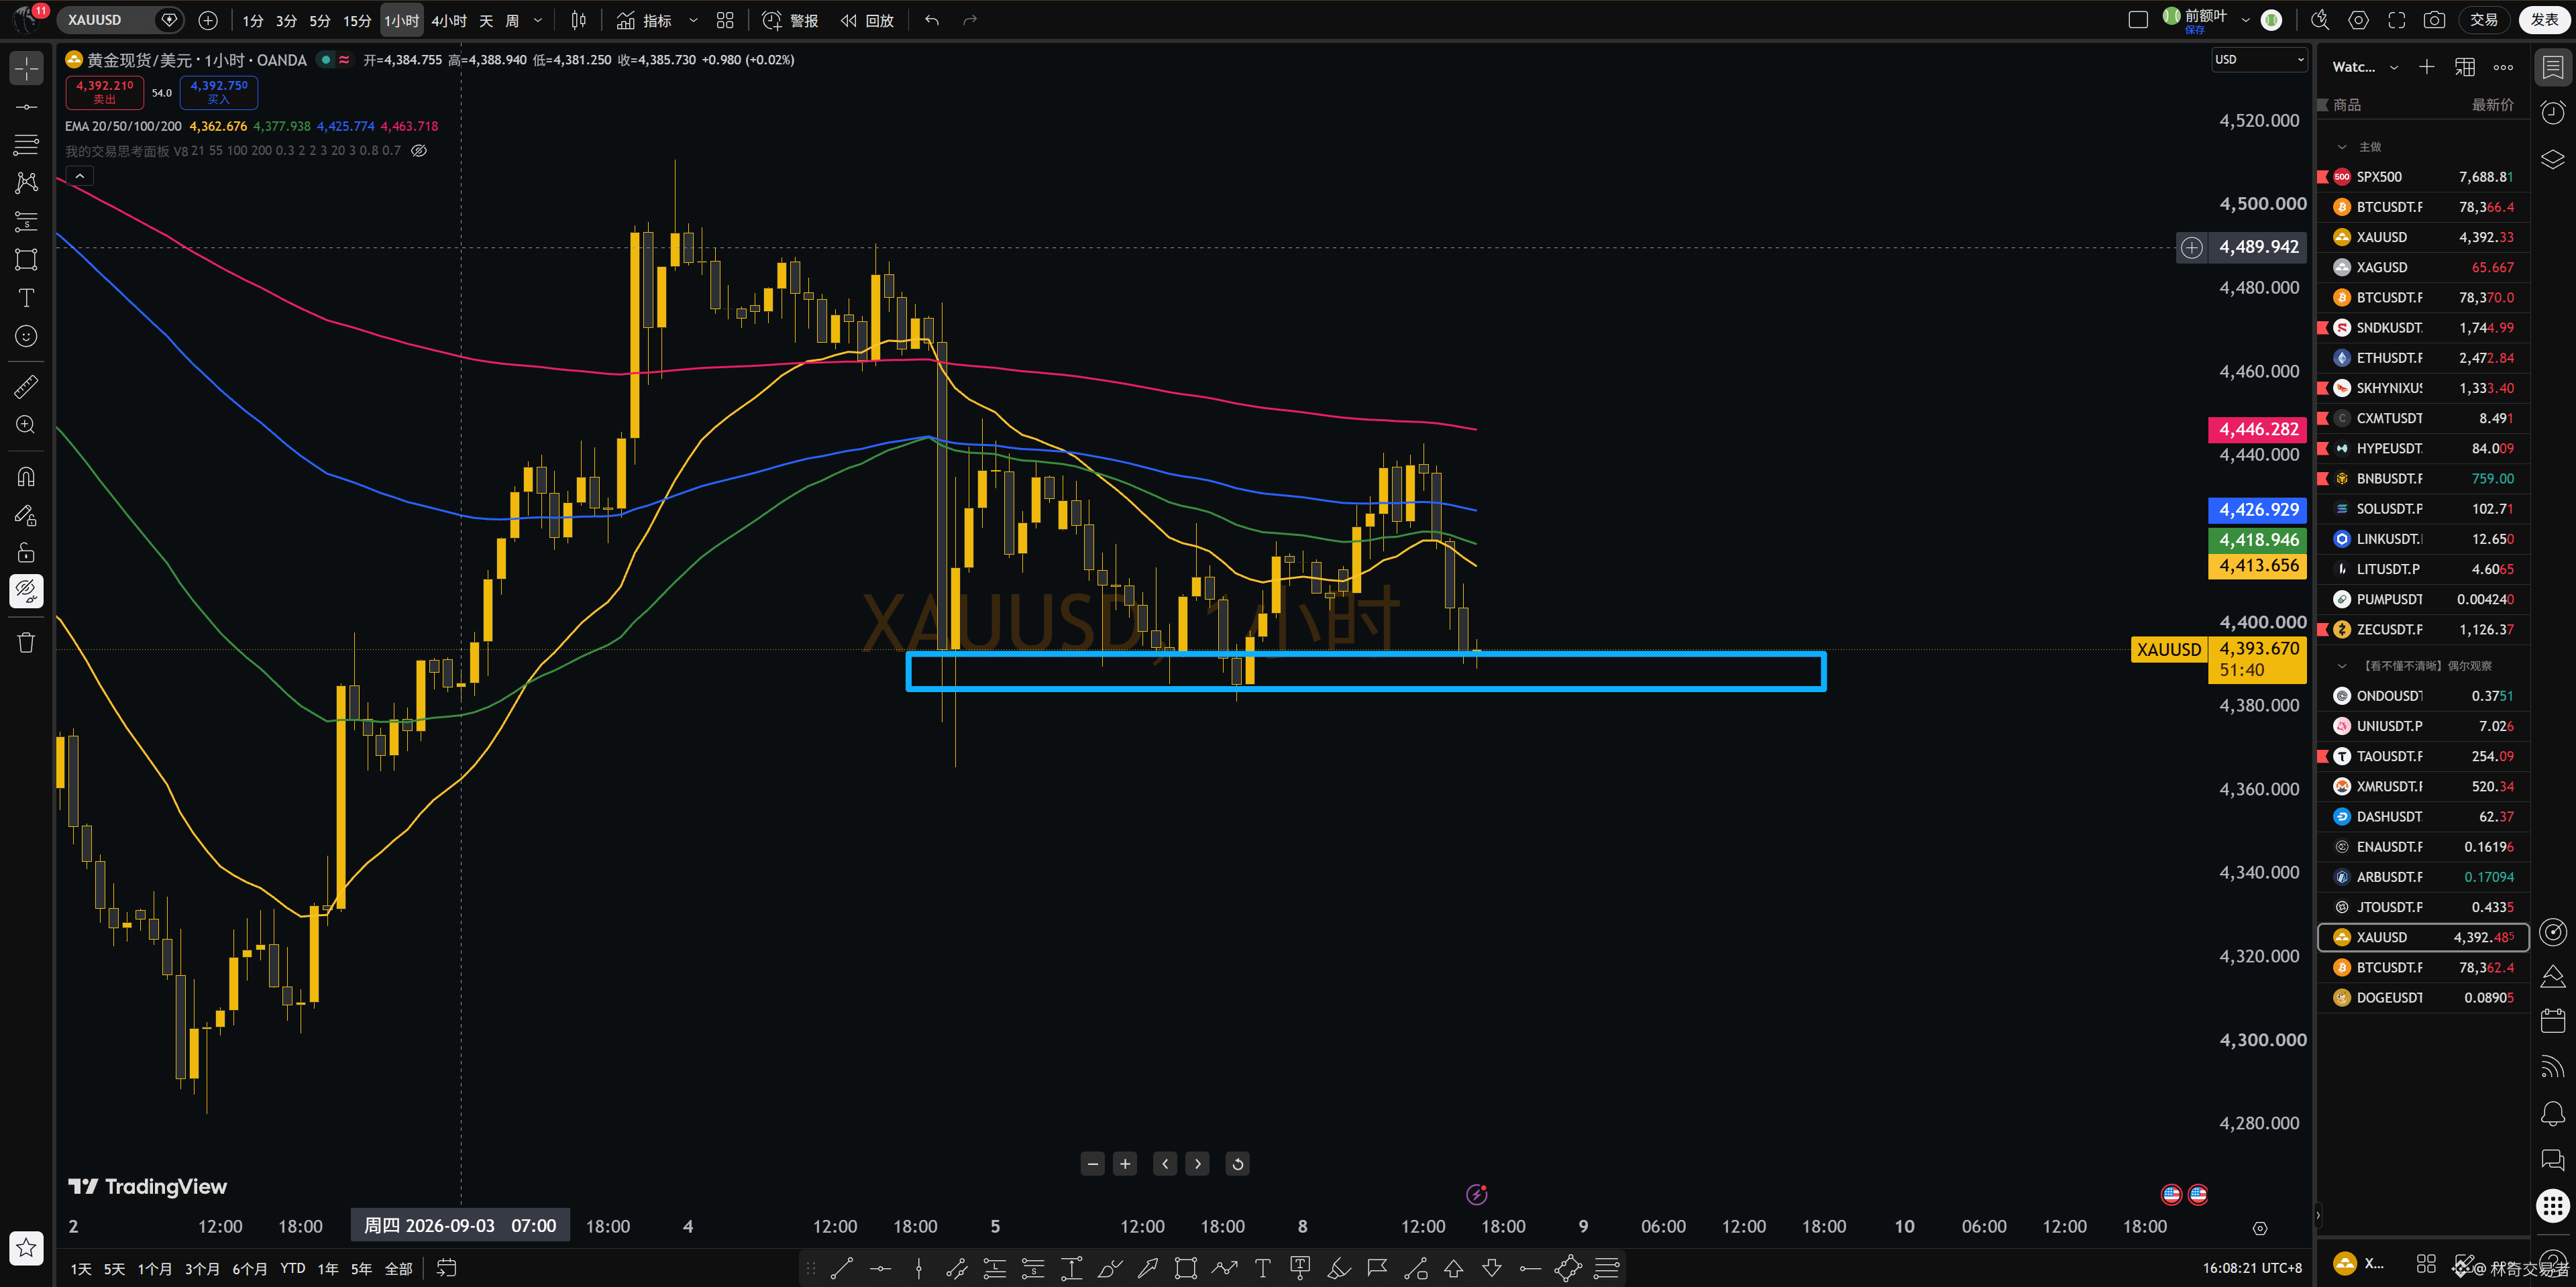
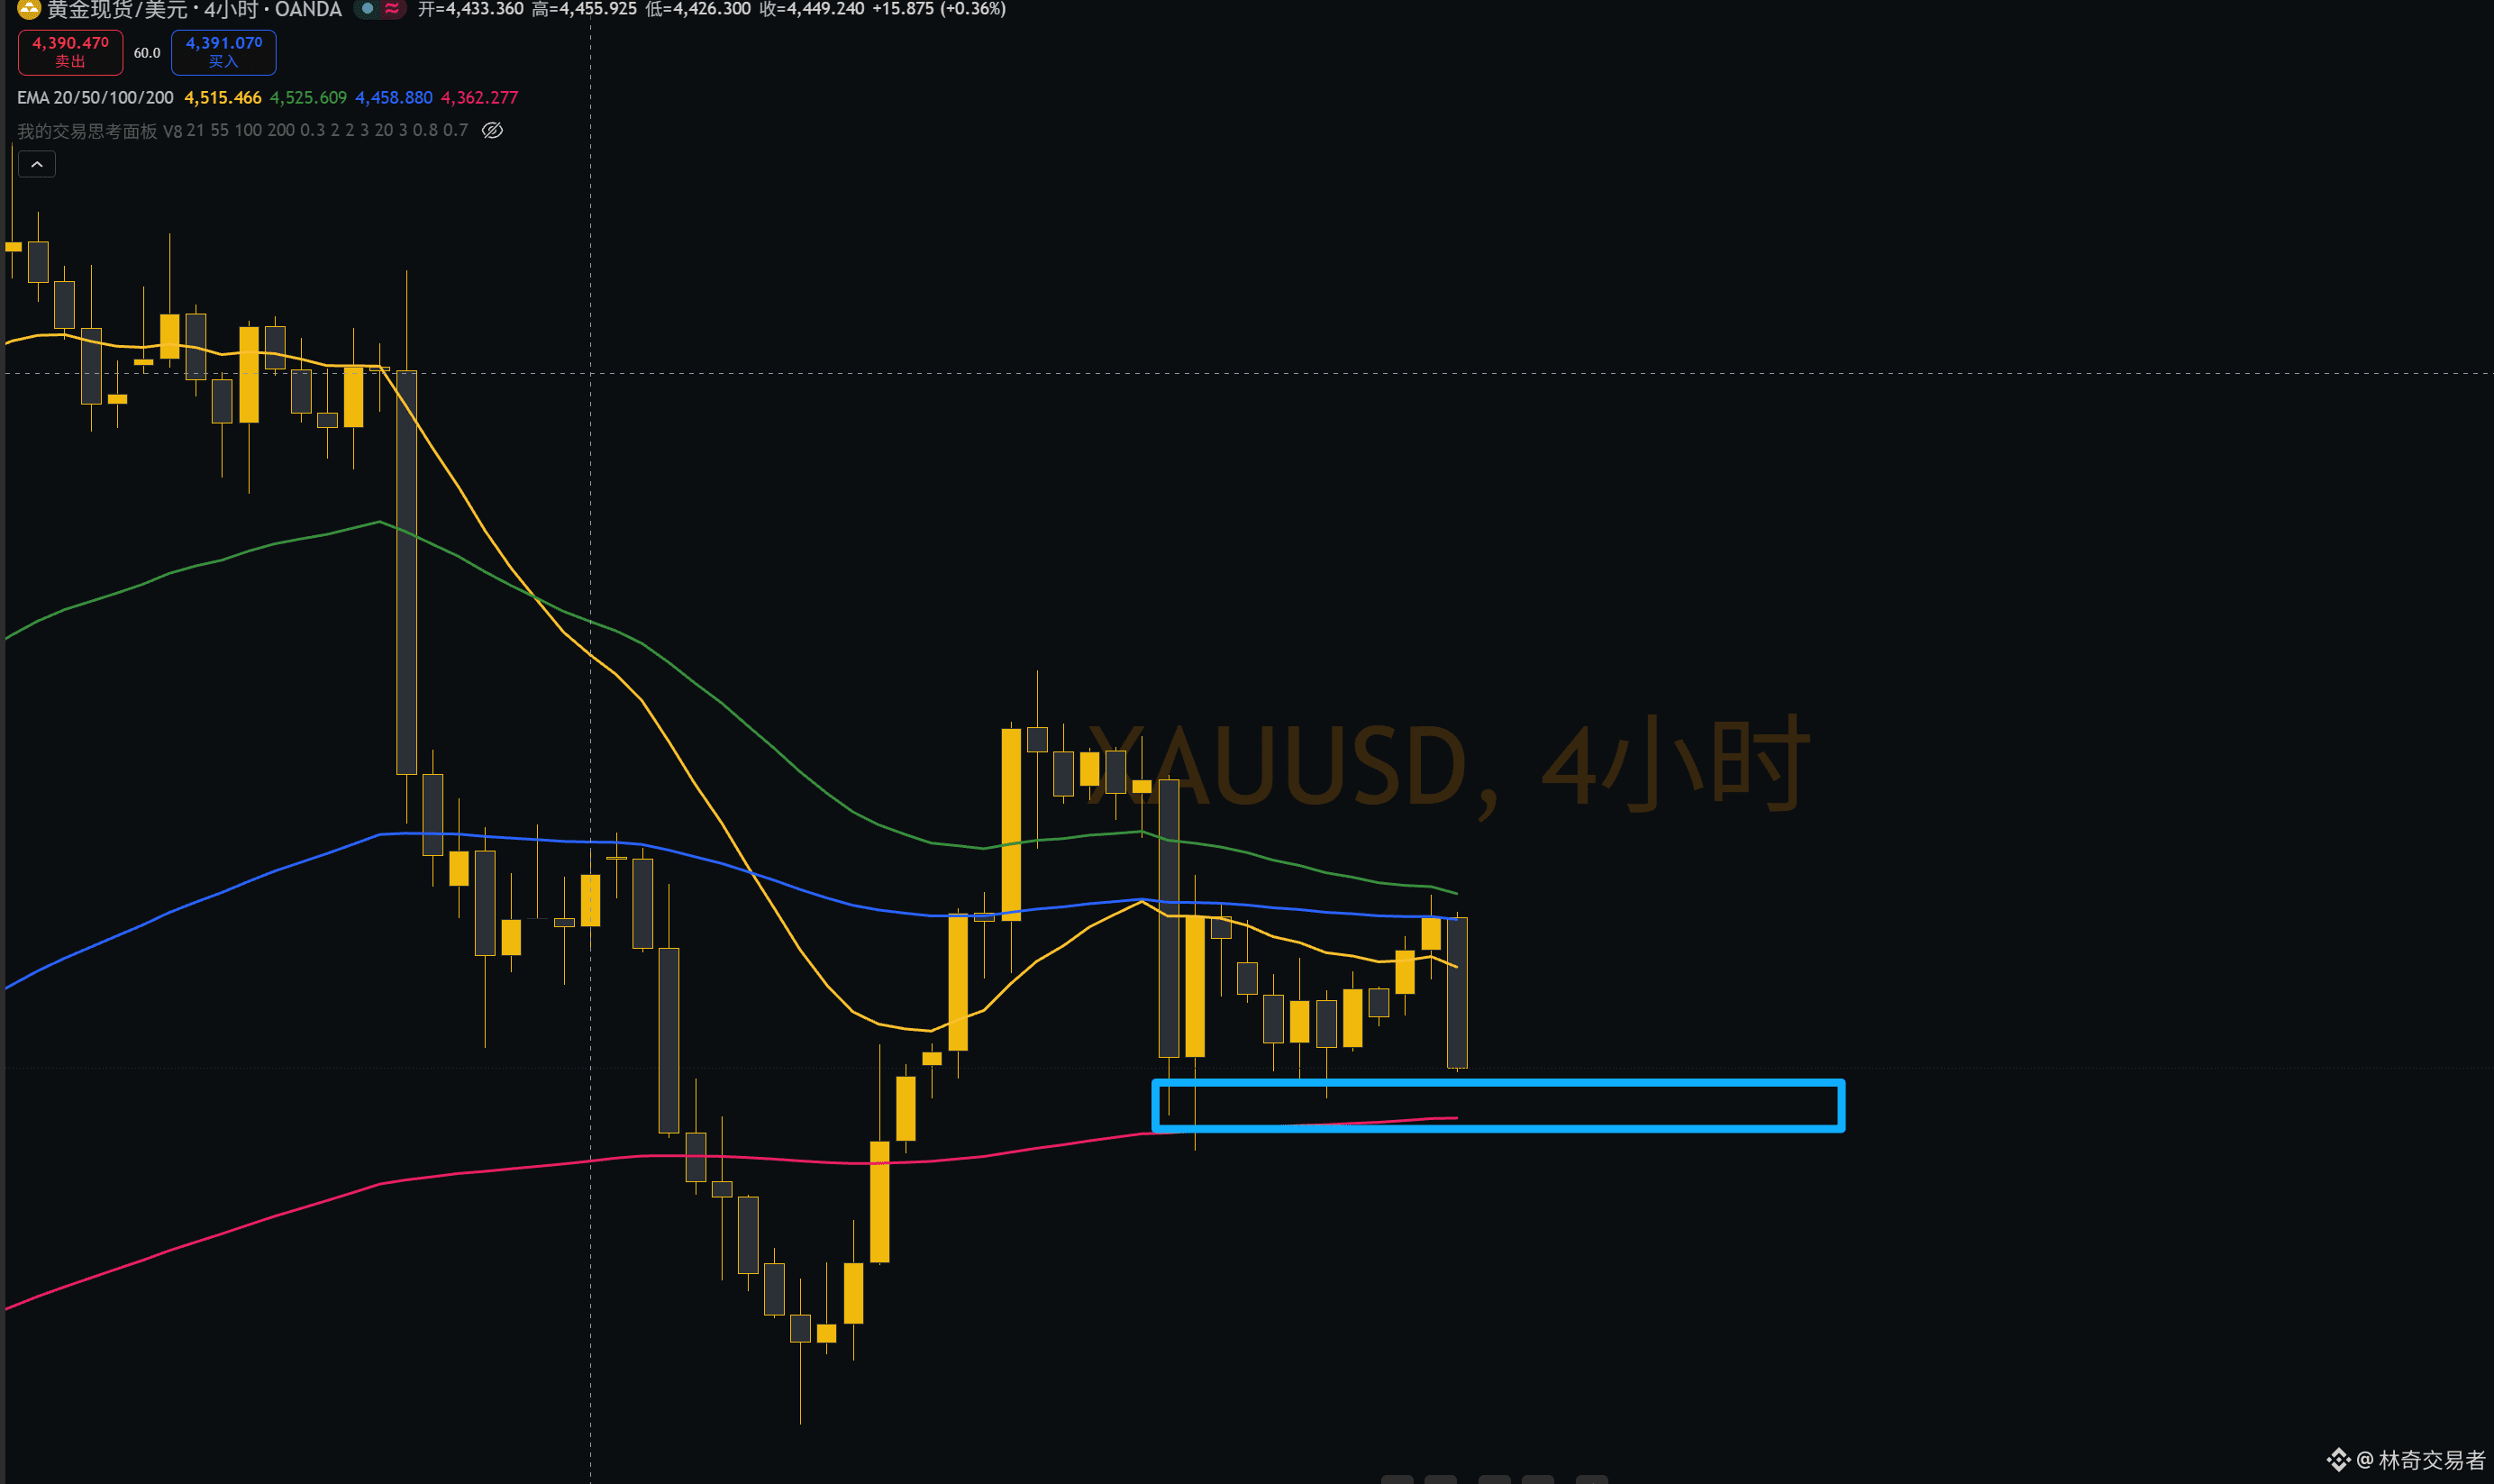
$XAUT Dajinzi is worth paying attention to this area, but the drop is a bit intense.
From the moving averages, the essence is going against the trend. So if there’s an opportunity for a 200 in 4 hours, it would be a good thing.
But even if it comes, don’t rush in right away—otherwise you’ll lose badly. That’s all experience.
The best is to wait until it stabilizes, and only then—when the decline stops—talk about it
{future}(XAUTUSDT)
$XAUT Dajinzi is worth paying attention to this area, but the drop is a bit intense.
From the moving averages, the essence is going against the trend. So if there’s an opportunity for a 200 in 4 hours, it would be a good thing.
But even if it comes, don’t rush in right away—otherwise you’ll lose badly. That’s all experience.
The best is to wait until it stabilizes, and only then—when the decline stops—talk about it
From the moving averages, the essence is going against the trend. So if there’s an opportunity for a 200 in 4 hours, it would be a good thing.
But even if it comes, don’t rush in right away—otherwise you’ll lose badly. That’s all experience.
The best is to wait until it stabilizes, and only then—when the decline stops—talk about it
143
·
--
188
·
--
$BTC Trading is getting more and more intuitive for me. However, I need to sustain this good feeling, repeatedly verify it, and strengthen my confidence. At the same time, it should also be reflected in my account—making everything even more perfect.
Here is my next step: increase my income, strengthen my psychological resilience, and integrate these techniques into something instinctive.
{future}(BTCUSDT)
$BTC Trading is getting more and more intuitive for me. However, I need to sustain this good feeling, repeatedly verify it, and strengthen my confidence. At the same time, it should also be reflected in my account—making everything even more perfect.
Here is my next step: increase my income, strengthen my psychological resilience, and integrate these techniques into something instinctive.
Here is my next step: increase my income, strengthen my psychological resilience, and integrate these techniques into something instinctive.

214
·
--
Seymark is right: 2+2=5. He said: You are right.
Seymark is right: 2+2=5. He said: You are right.

350
·
--
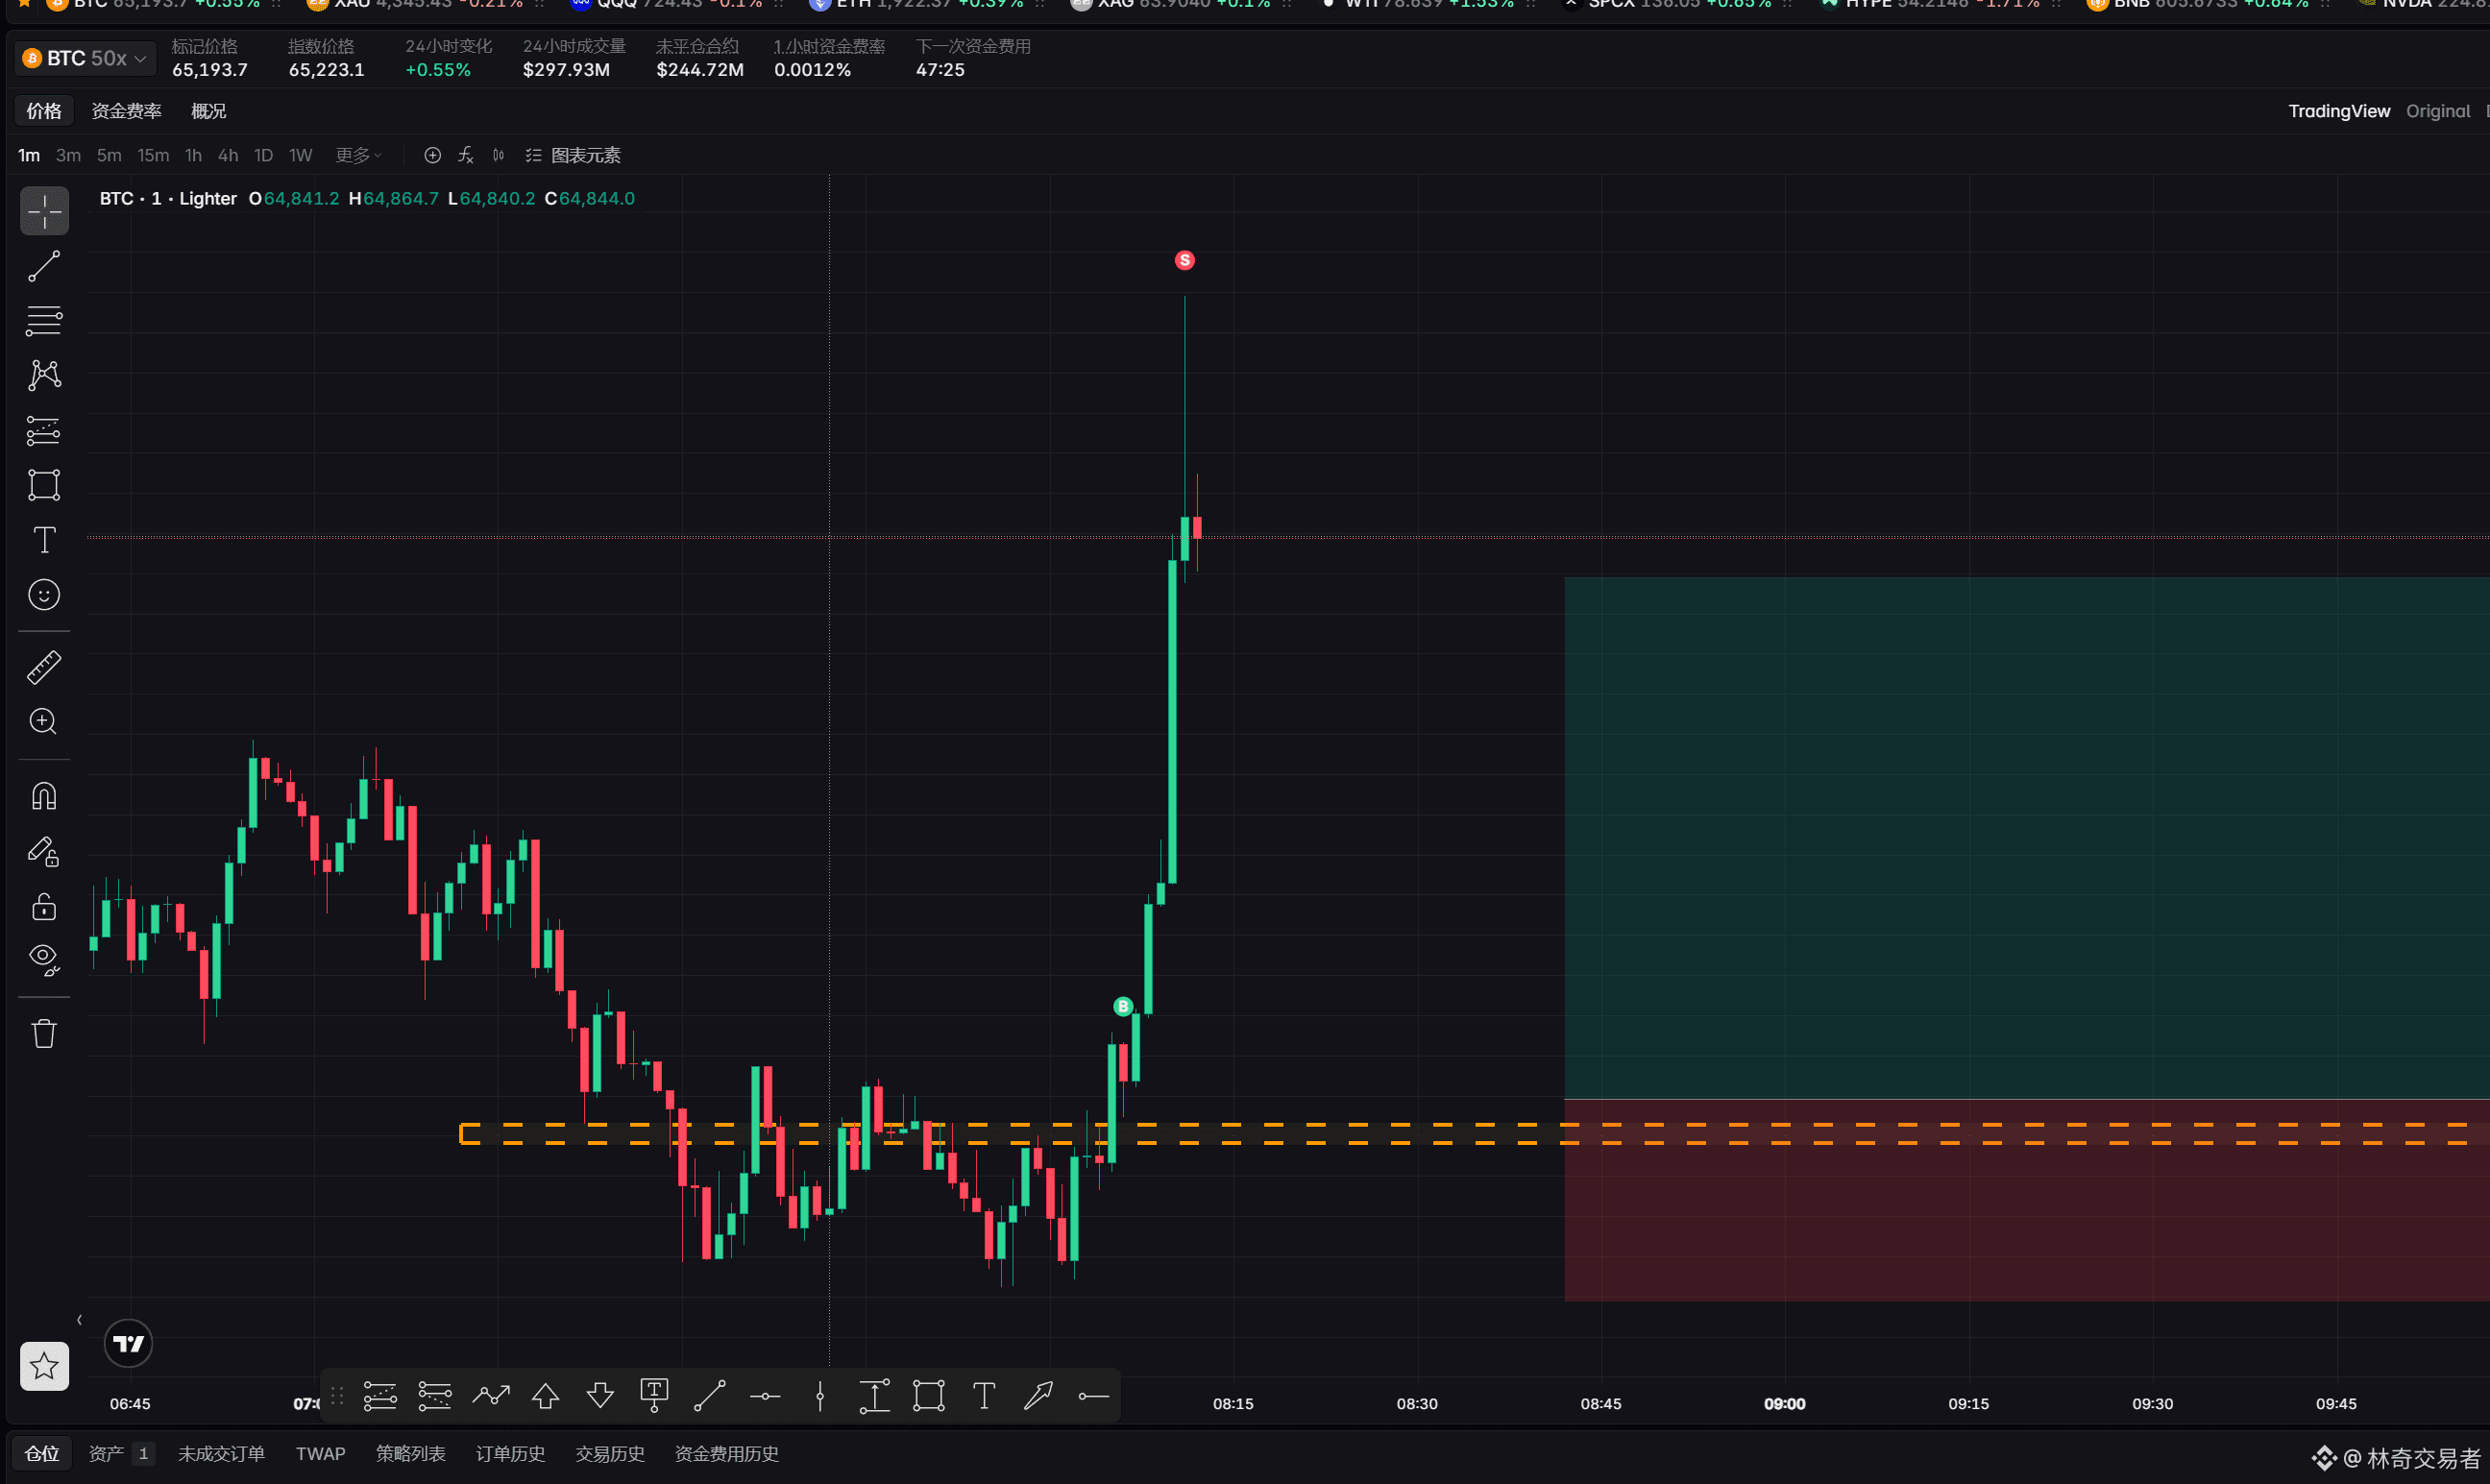
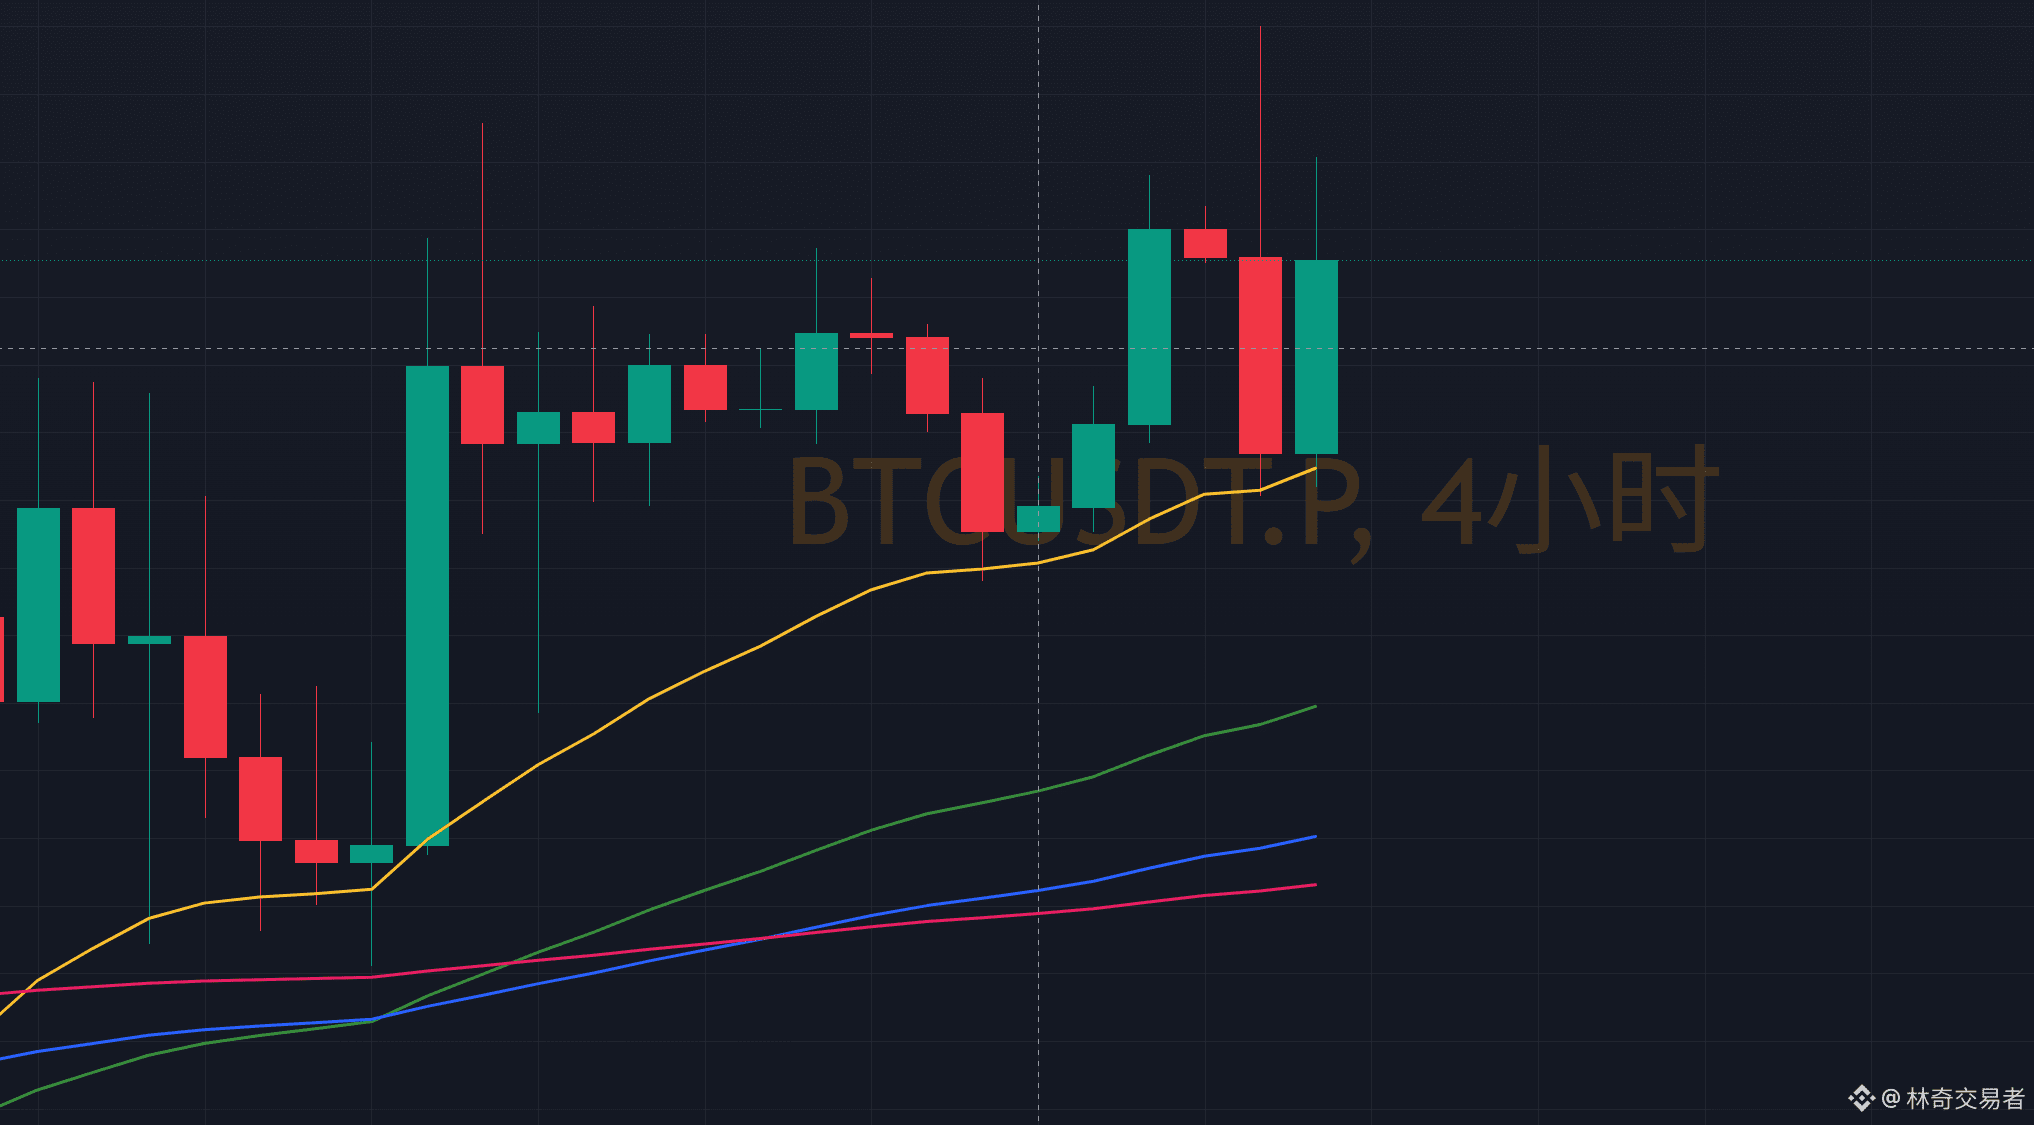
$BTC at critical locations, really will have a response, and it’s very big.
The key point here is 21 of the 4 hours.
{future}(BTCUSDT)
$BTC at critical locations, really will have a response, and it’s very big.
The key point here is 21 of the 4 hours.
The key point here is 21 of the 4 hours.
304
Log in to explore more content
Join global crypto users on Binance Square
⚡️ Get latest and useful information about crypto.
💬 Trusted by the world’s largest crypto exchange.
👍 Discover real insights from verified creators.
Email / Phone number
Trending Topics
USAugustPPIRisesLessThanExpected
12,975 views
368 Discussing
🚨 US AUG PPI: Rises LESS Than Expected! Bullish for Crypto? 🚀
PPI +0.4% MoM as expected, but CORE PPI only +0.2% vs +0.3% expected - cooling!
What it means:
• Wholesale inflation softer than feared
• Fed rate hike chance now 62% - but dovish signals coming
• Core PCE revisions expected downward - bullish
• BTC usually pumps on softer PPI
Fed meeting Sep 15-16 - Market now expects pause, not hike?
Is this the green light for Q4 rally?
#Bitcoin #PPI #Fed #CryptoNews #BTC#usaugustppiriseslessthanexpected
True News
·1 Likes
·1.2k views
SECApprovesNasdaqTexasCommodityTrustRule
10,410 views
340 Discussing
ECBRaisesRatesSecondTimeTo2.5%
6,846 views
241 Discussing