Binance Square
Kralice 1
120 Posts

Kralice 1

#Youtuber #Investor
0 Following
0 Followers
0 Liked
Posts
·
--
See translation
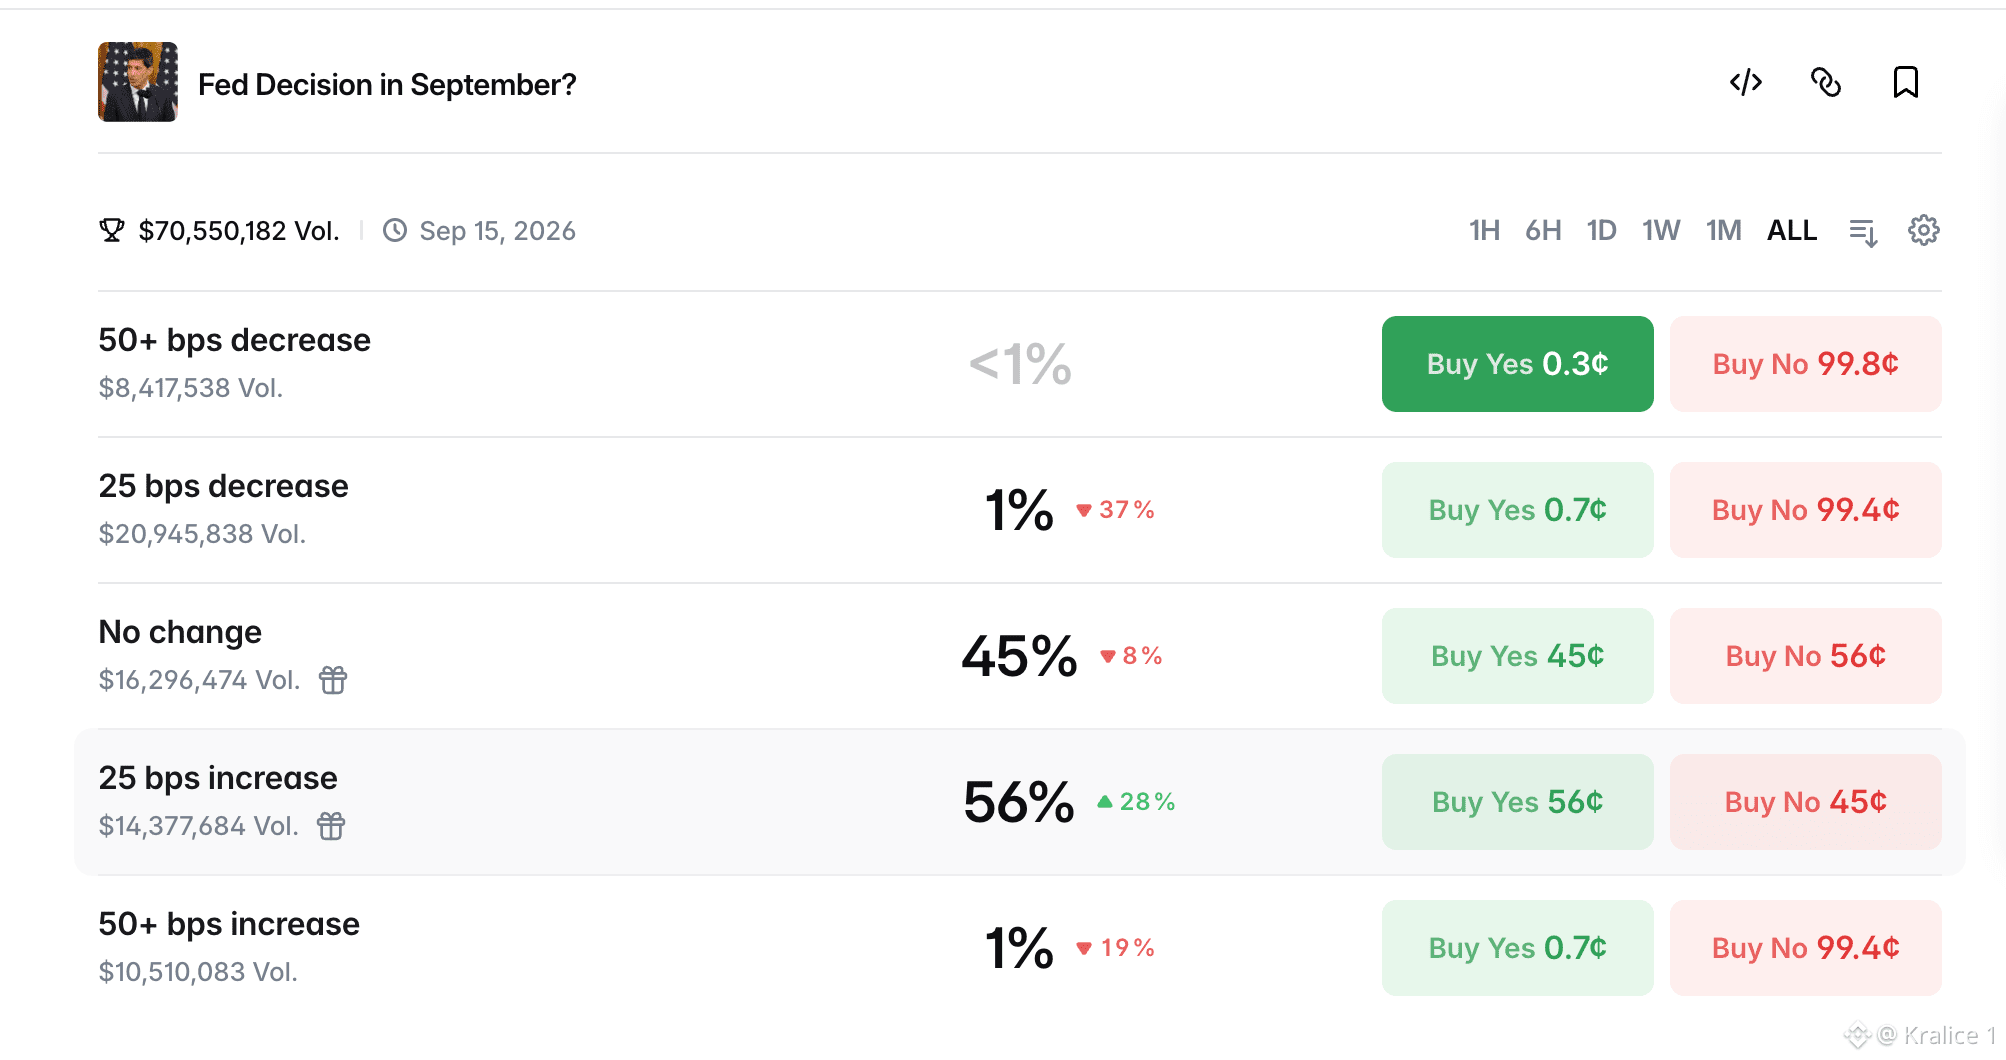
Fed'de artık faiz indirimi değil, faiz ARTIRIMI konuşuyoruz. Bitcoin ise 78K'da tutunuyor. 👀 Bugün piyasa oldukça karışık: - Polymarket'te eylül toplantısında 25 bp faiz artırımı ihtimali %56'ya yükseldi. - Fed funds futures tarafında da artırım olasılığı yaklaşık %58. - Brent petrol ABD-İran çatışmasının yeniden tırmanmasıyla $90'ı aştı. - Buna rağmen BTC yaklaşık 78K bölgesinde tutunuyor. Ve kurumsal tarafta alımlar devam ediyor. 🟠 Strategy → 4,603 $BTC / $369.7M 🔵 BitMine → 53,501 $ETH / ~$131M değerinde token aldı. Yani elimizde çok ilginç bir denklem var: Makro baskı artıyor ama kurumsal kripto talebi devam ediyor. 📍 Günlük yön beklentim: Ben bugün nötr / temkinli taraftayım. Bence BTC'nin petrol $90+, güçlü dolar ve faiz artırımı beklentisine rağmen 78K'da kalabilmesi çok önemli bir güç göstergesi. DİKKAT: Bu hafta cuma günü gelecek ABD istihdam verisi artık çok daha kritik. Sizce Fed gerçekten eylülde faiz artırır mı? 👇 Yatırım tavsiyesi değildir.
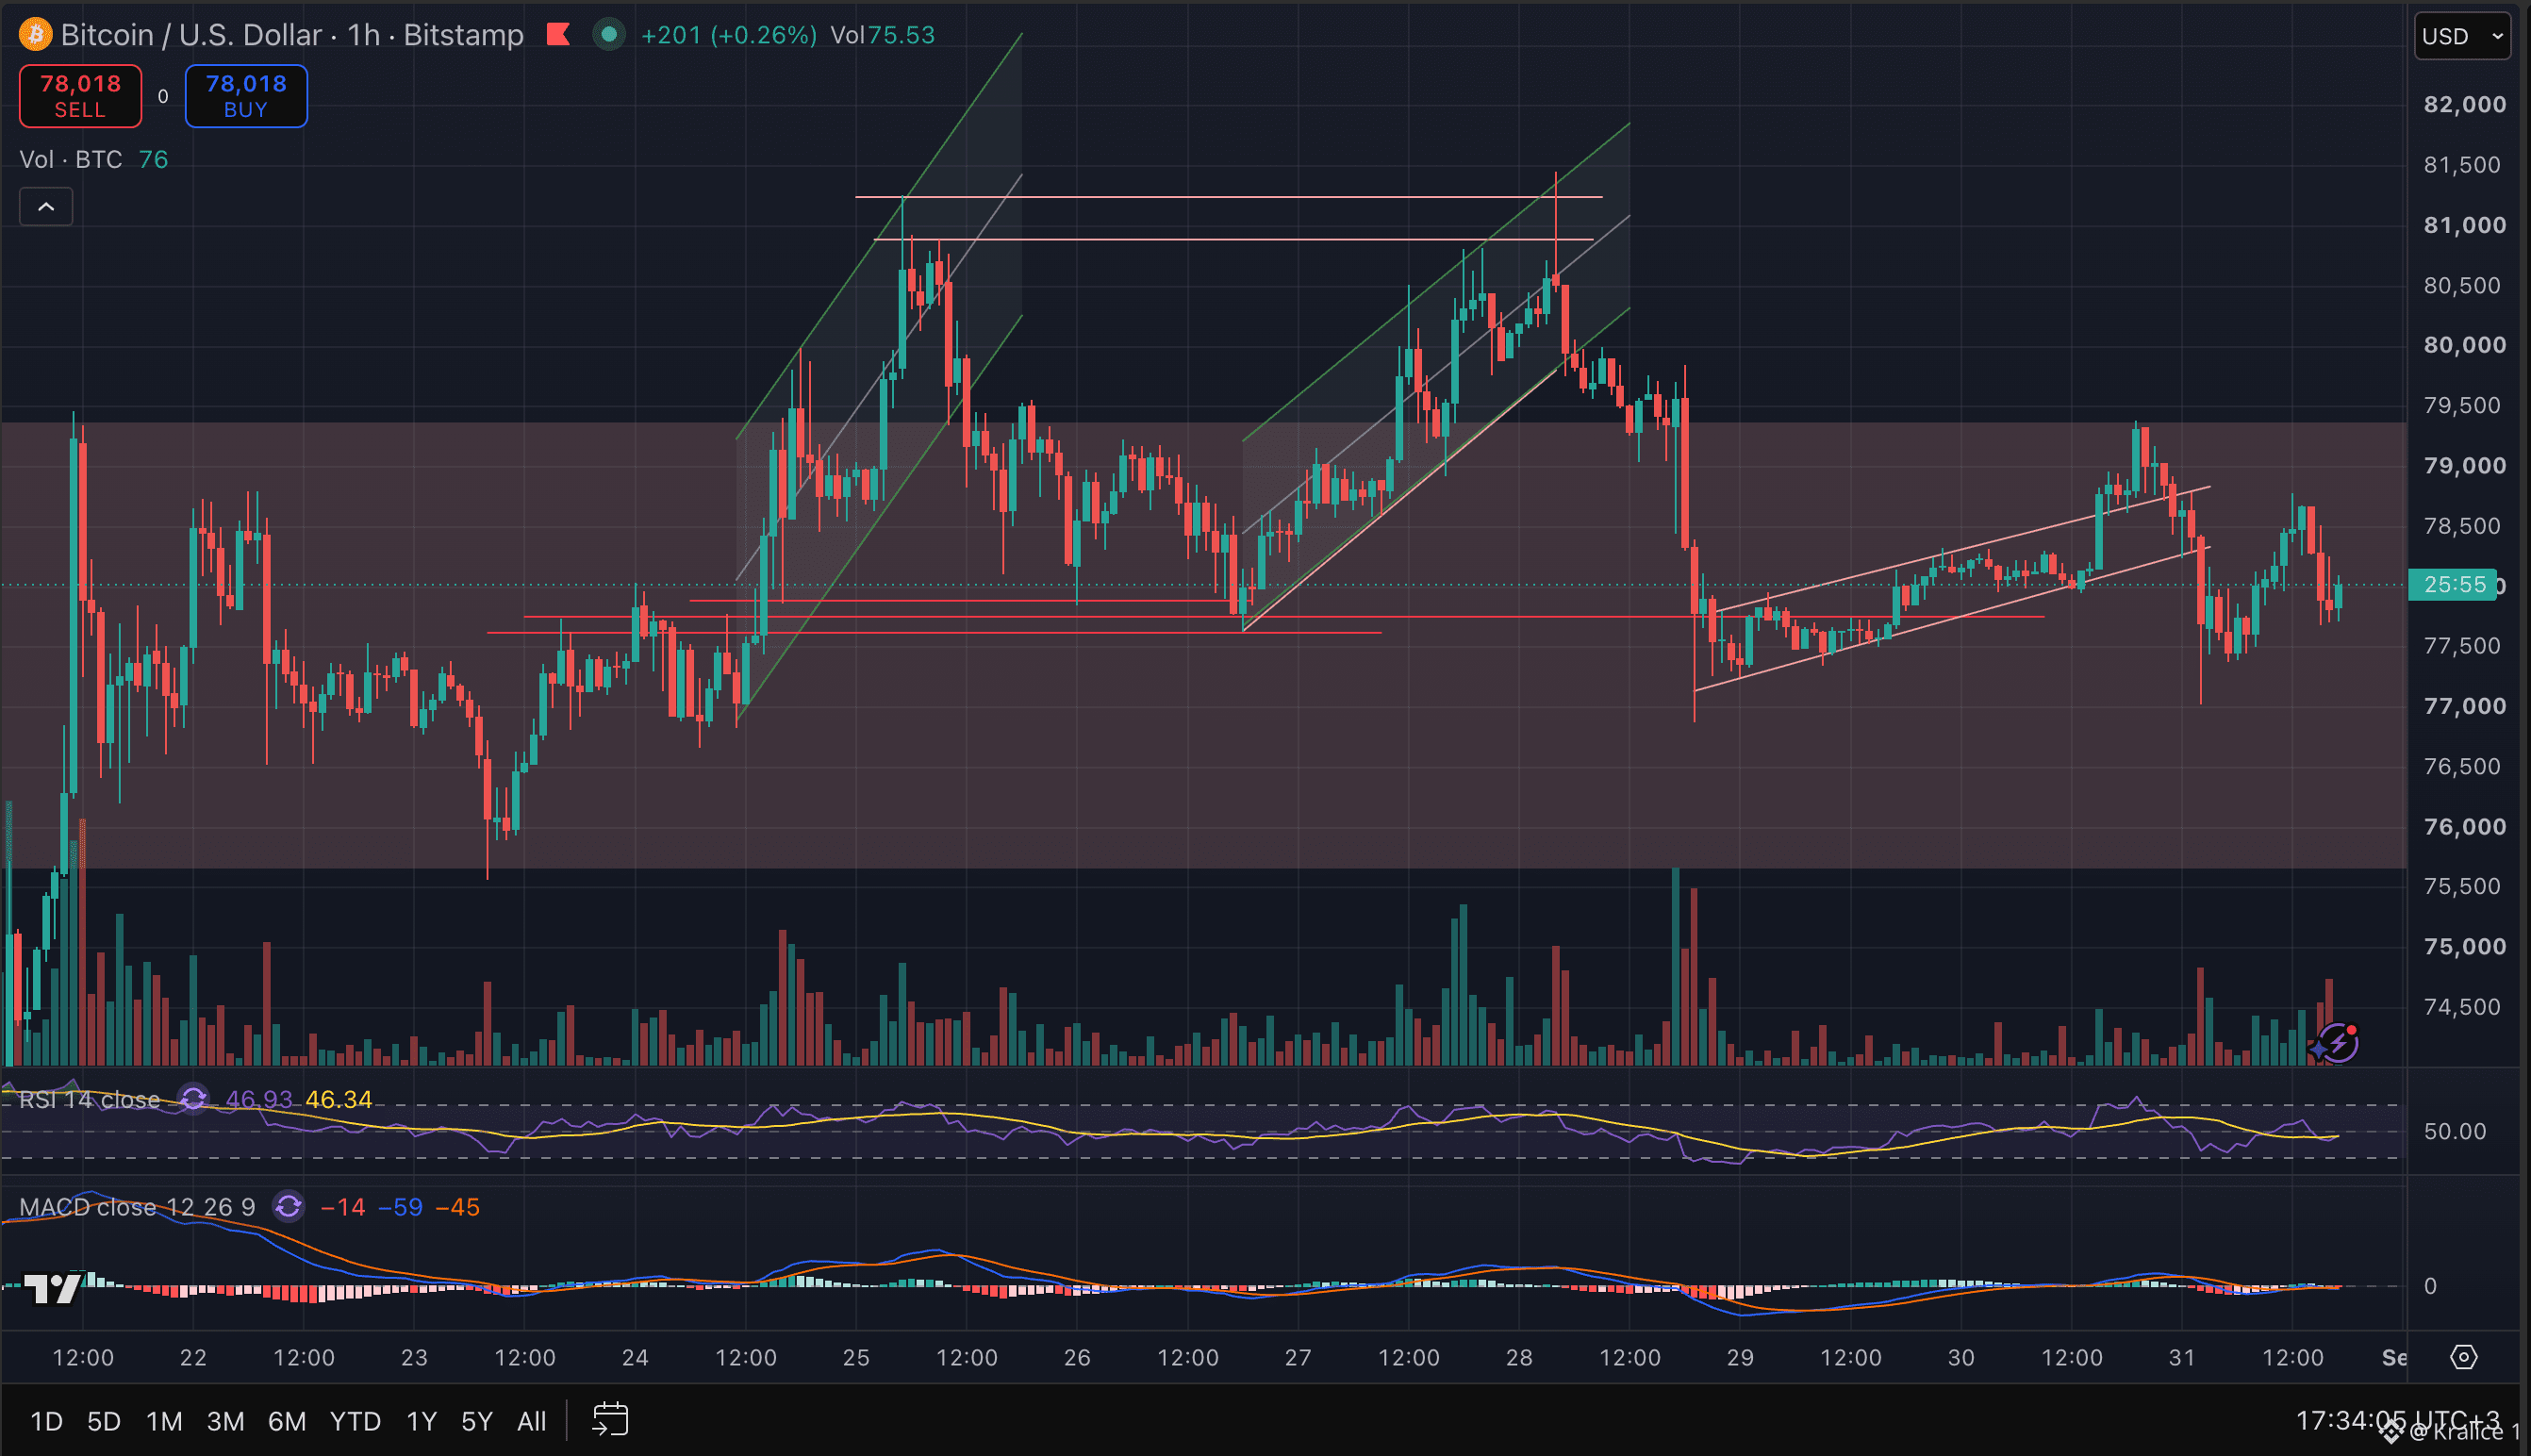
Bitcoin has bounced back to 79K after today’s 77K drop. 👀 Key developments over the weekend: - Michael Saylor shared “We’re Back.” Strategy may be preparing to resume Bitcoin buying after a two-month break. - About $40 million worth of $BTC was moved from a six-Bitcoin wallet that has been inactive for 10+ years. However, most of the BTCs weren’t sent to exchanges. - Trump said that the U.S. strategic oil reserves will be refilled with Venezuelan oil again. - Charles Schwab is preparing to add trading support for SOL, AVAX, and LINK following BTC and ETH. - Major banks are pushing forward a joint stablecoin project. 📍 Daily direction expectation I’m pulling today back from neutral to slightly positive. The main bullish confirmation for me is still a breakout above the 80–81K zone. If Saylor truly bought BTC again, tomorrow could get even more interesting!!! Do you think Bitcoin can break above 80K in the new week? Not investment advice.
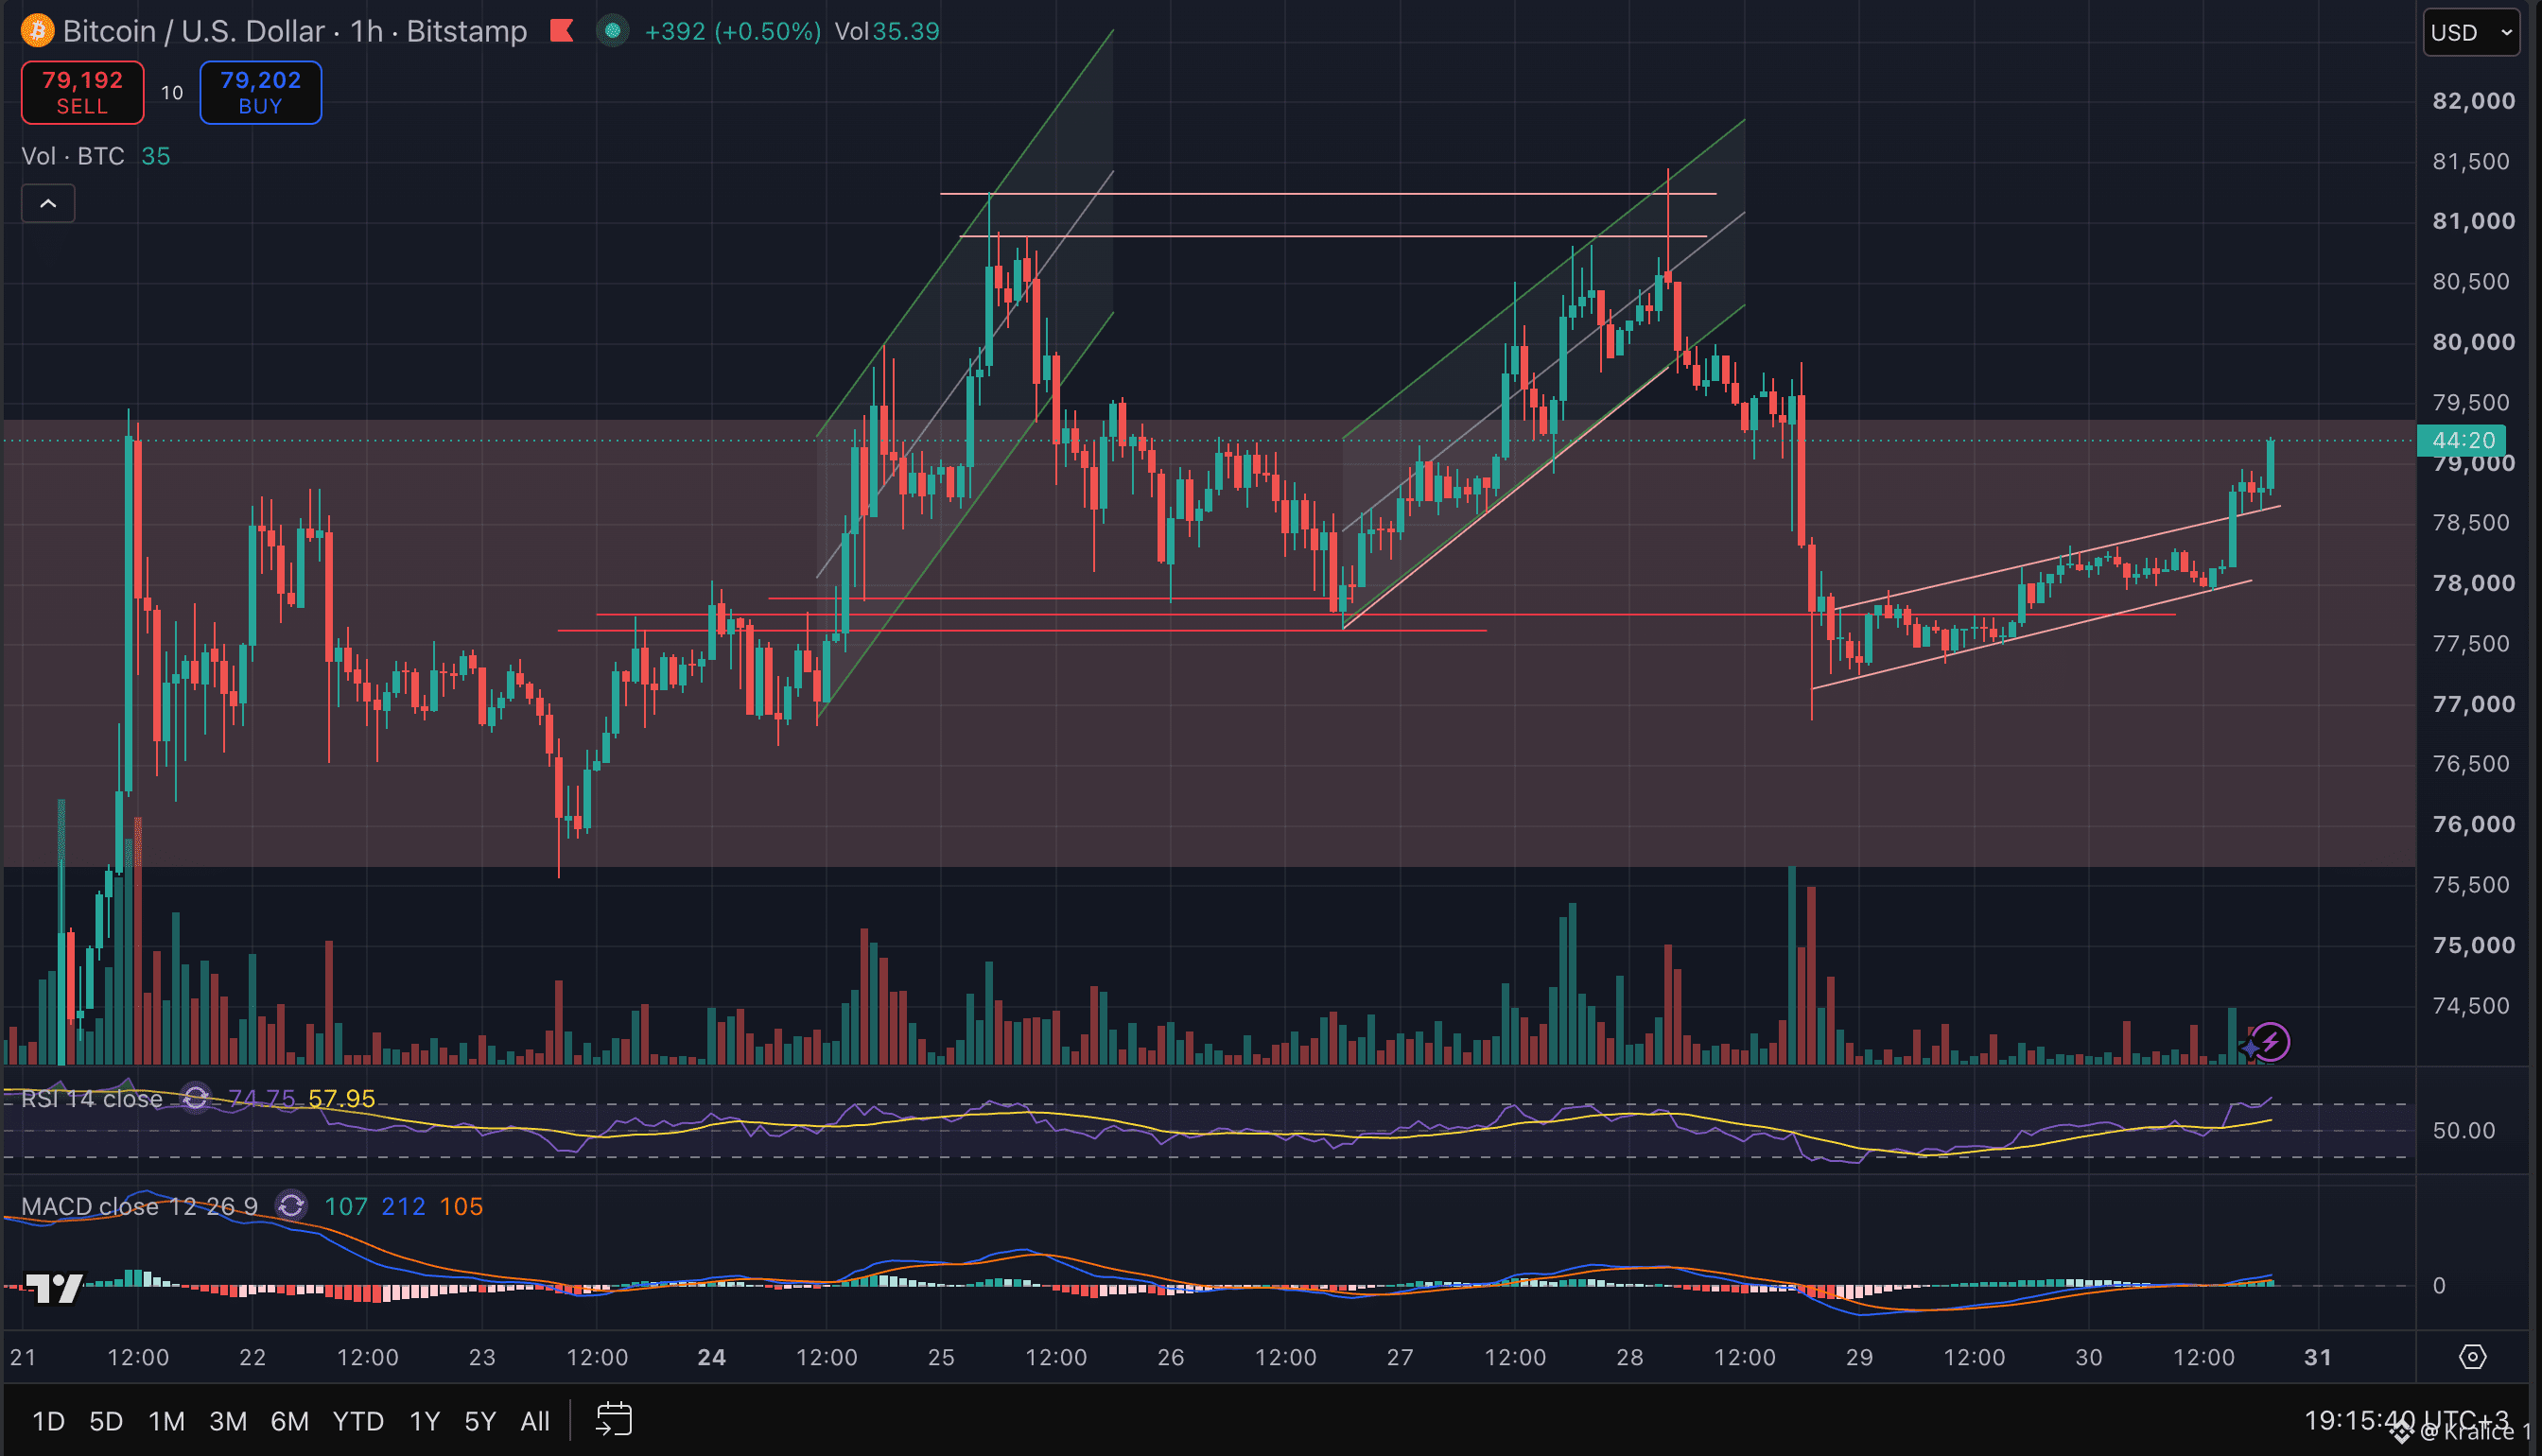
This week Bitcoin was rejected at 81K, and we’re entering the weekend in a critical zone. Today, three important developments I’m following: 1- The 9-day streak of inflows into Spot Bitcoin ETFs ended. On Friday, there was approximately $202 million in net outflows. 2- Fed Chair Kevin Warsh sent a message saying there’s “work to do” on inflation. Rate-hike expectations in the market strengthened. 3- About $40 million worth of $BTC was moved from six Bitcoin wallets that haven’t moved in 10+ years. But an important detail: most of the BTCs were not sent to exchanges. So I don’t read this directly as a “whale sell.” 📍 My daily directional outlook: Today I’m neutral-to-bearish / cautious. Do you think 80K will be reclaimed over the weekend? 👇 Not investment advice.
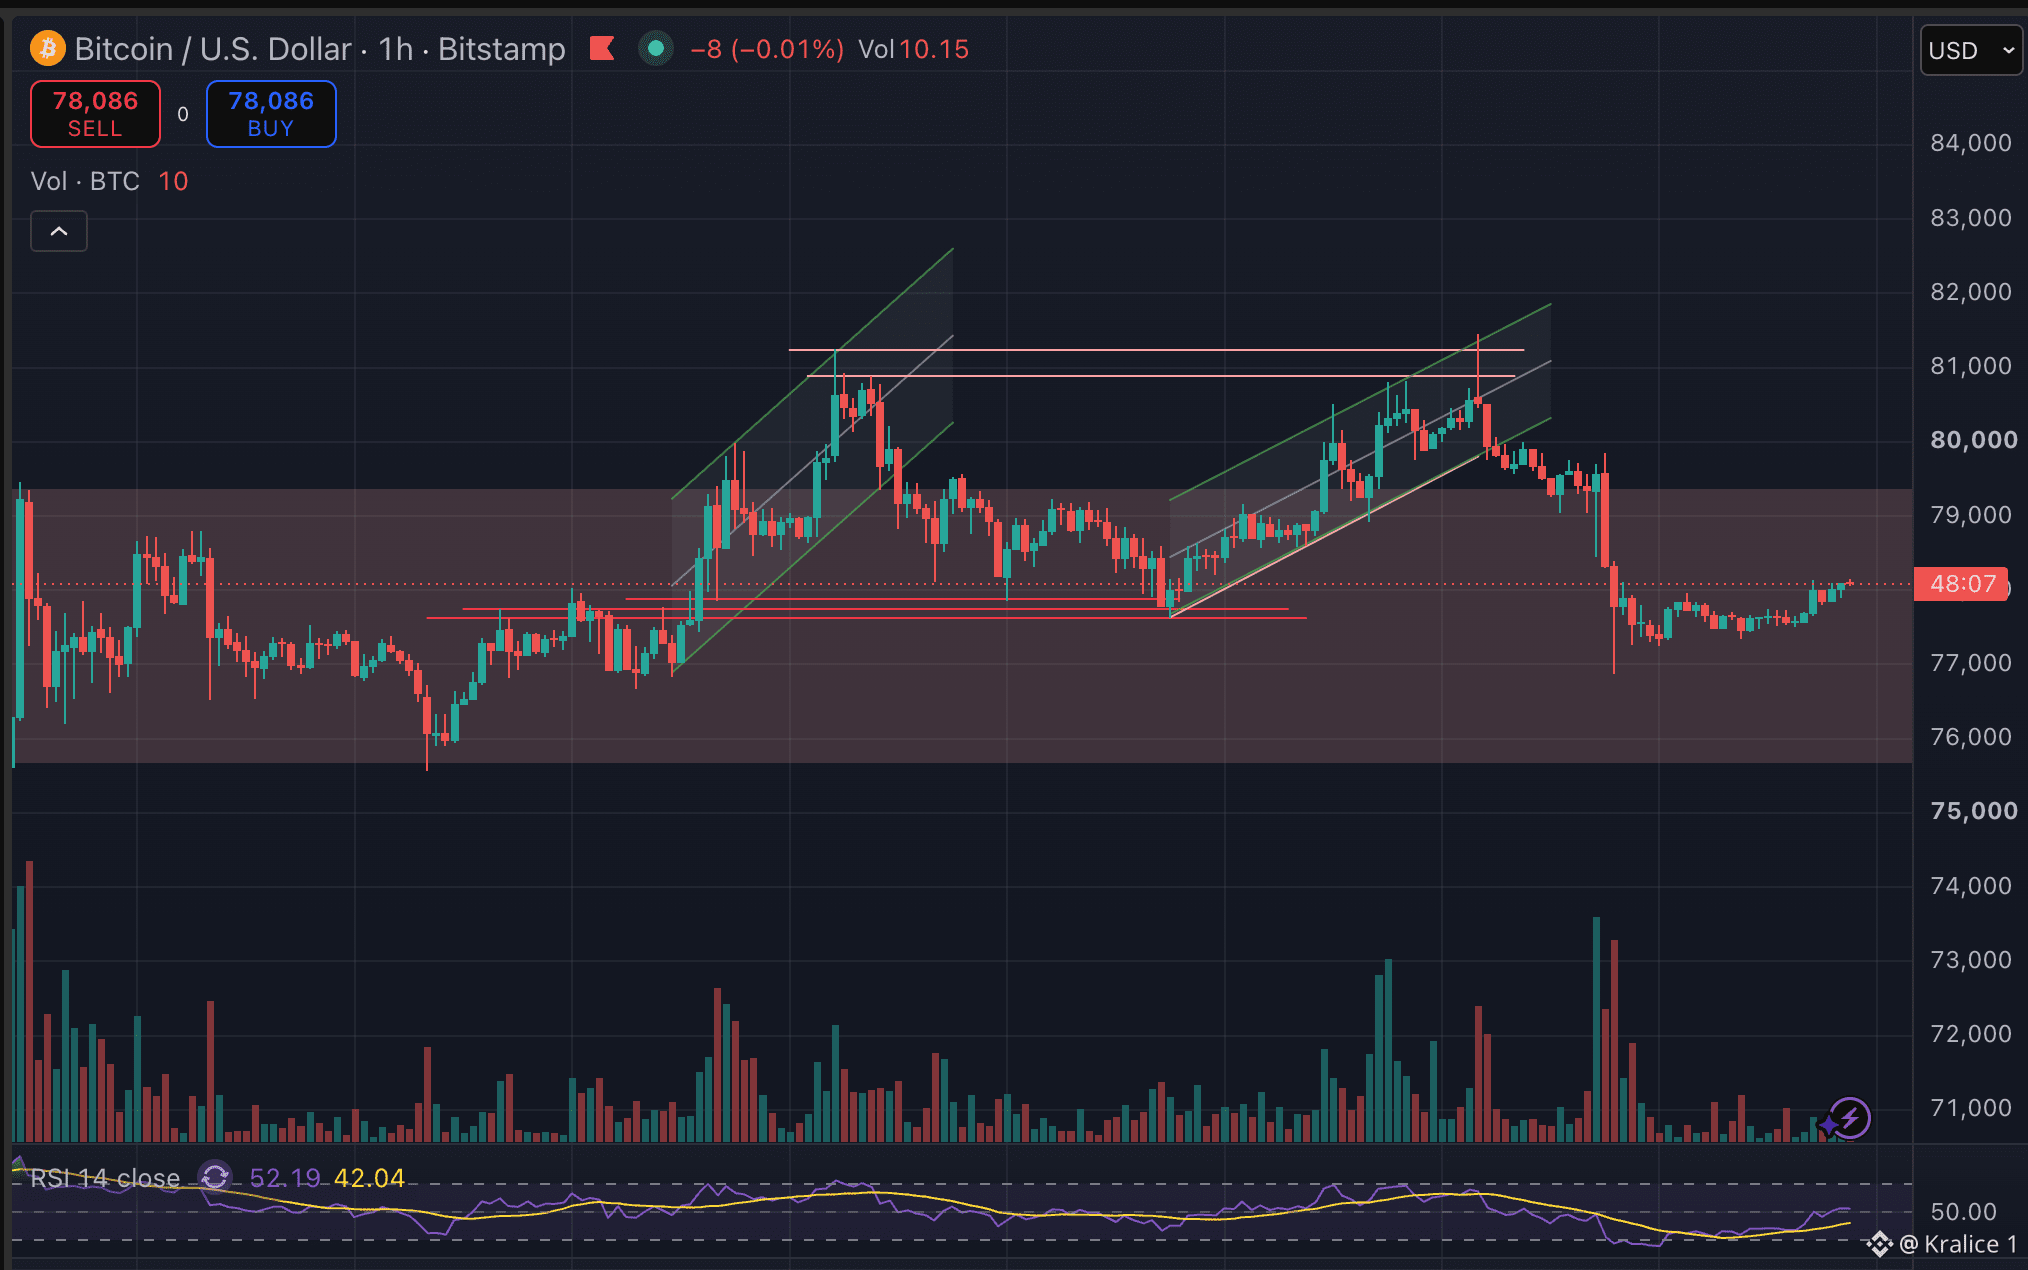
Bitcoin was rejected once again from the 81K level and fell back to 78.7K after the Warsh speech. Now we are in a critical zone. 👀 Fed Chairman Kevin Warsh sent a message saying, “We still have work to do” regarding inflation. After Warsh’s speech, bond yields rose, and $BTC retreated to the 78.7K area. In addition, the approximately 81,700 Bitcoin options worth $6.4 billion expired today. 📊 My daily direction expectation For today, I’m shifting my outlook to neutral-negative. There was no dovish message from Warsh, and the short-term bullish structure on the 1-hour chart has been broken. So for me today, it’s less about 80K and more about whether 77.7–78K can hold. Do you think Bitcoin will enter the weekend above 80K or below it? 👇 Not investment advice.
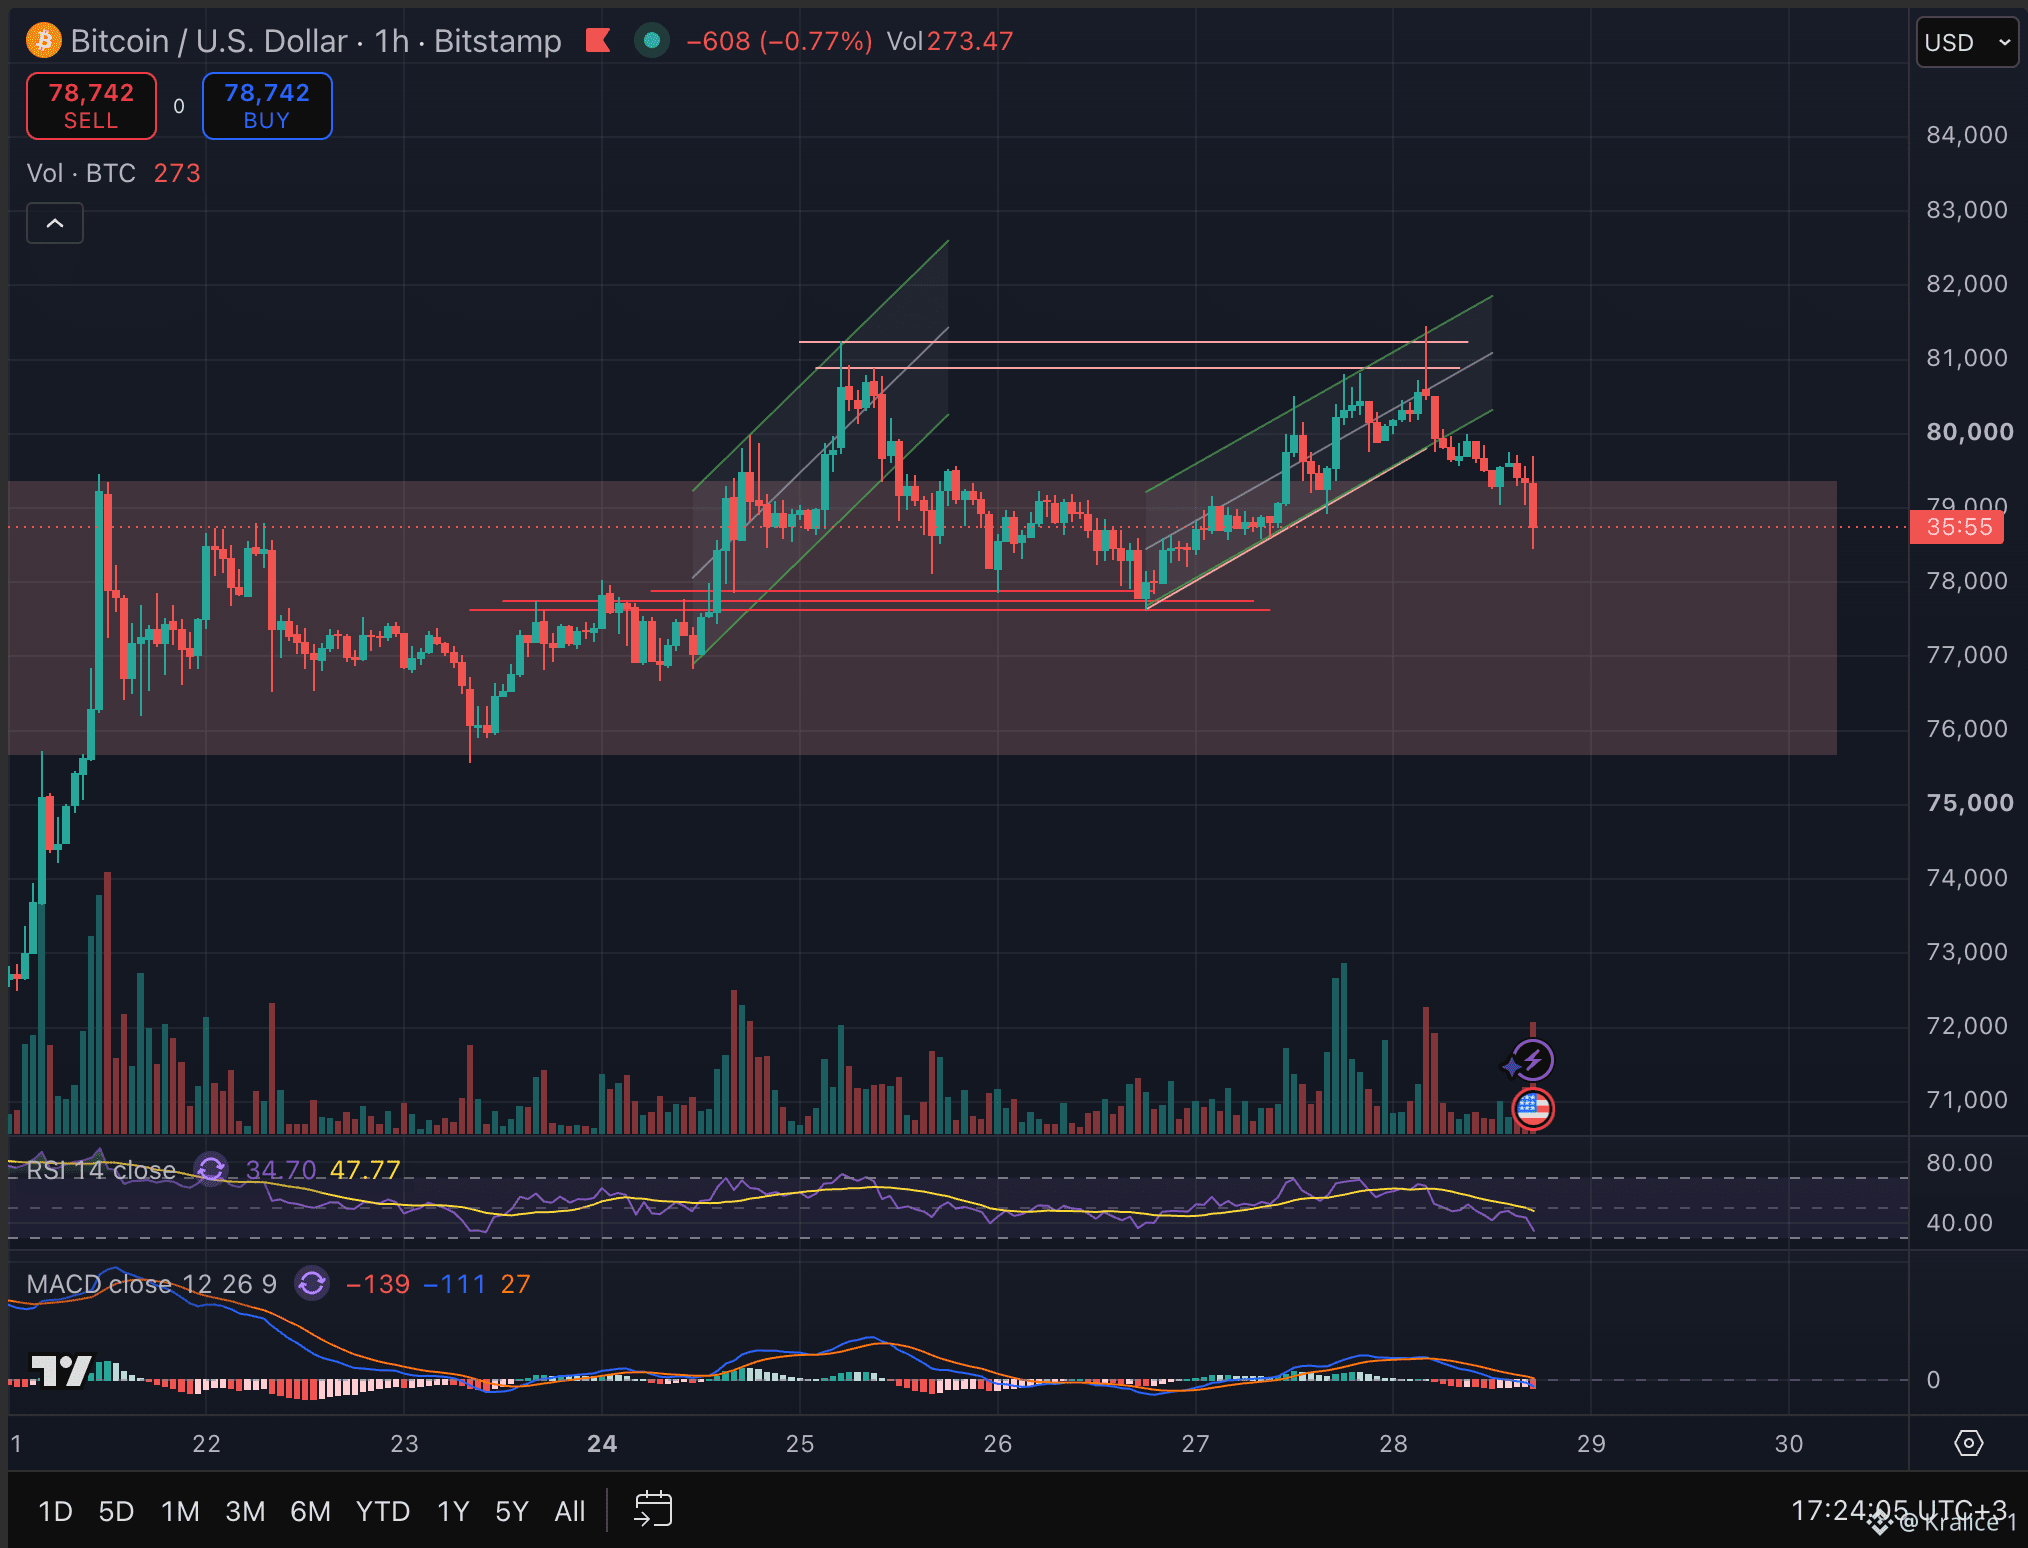
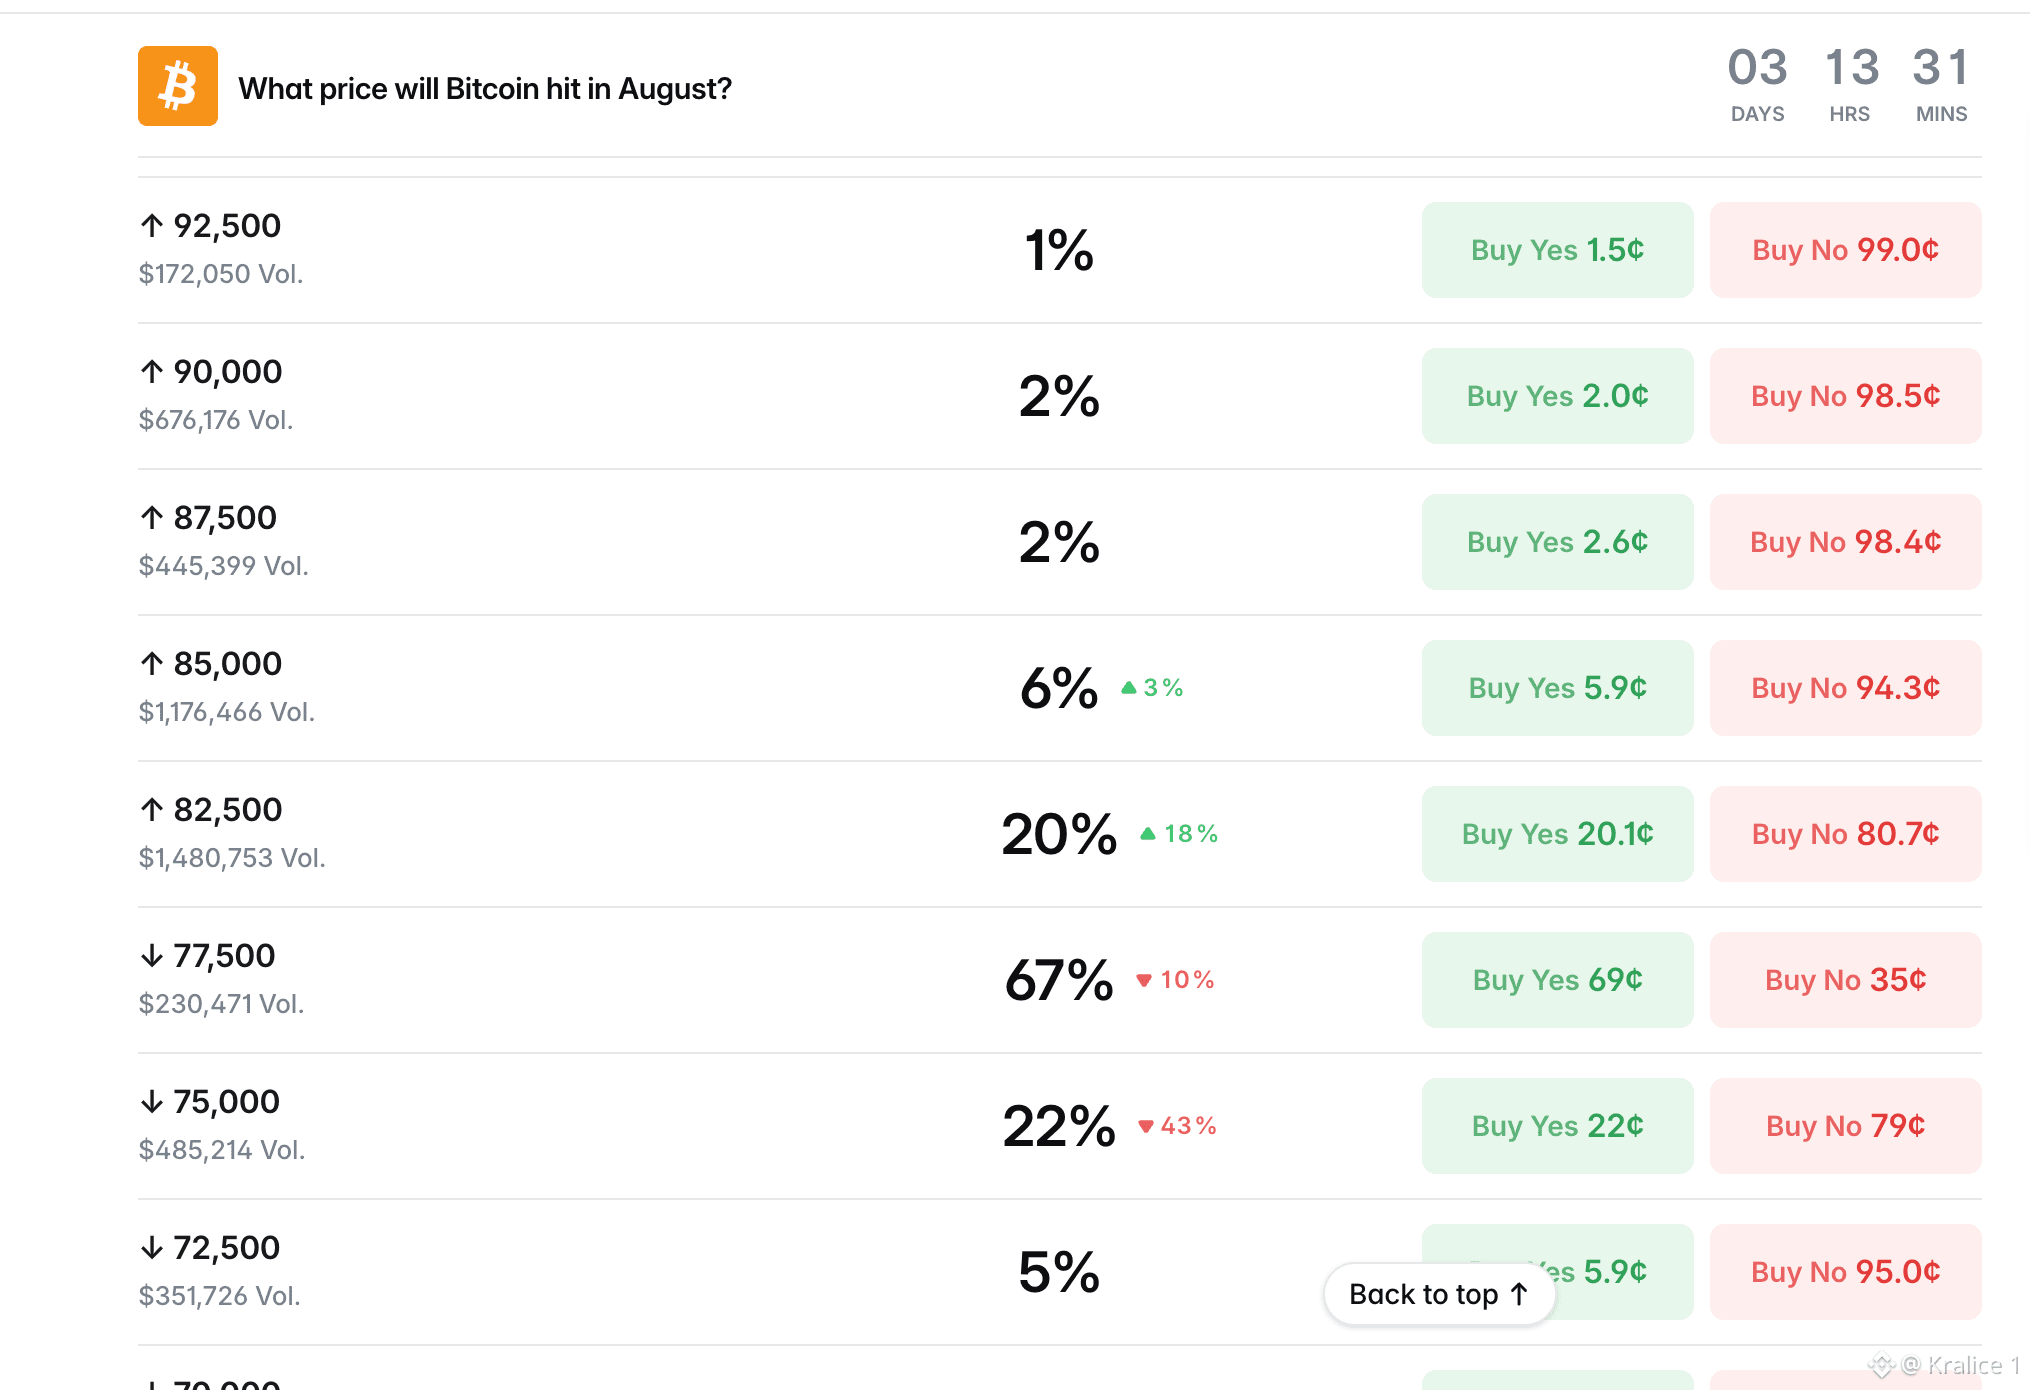
Iran–Oman Hormuz Talks: What Does It Mean for Bitcoin and Oil? Iran and Oman are continuing negotiations for the Strait of Hormuz. The possible agreement could have positive effects on oil, inflation, and $BTC.

Bitcoin’s Critical 80–82 Thousand Dollar Resistance: 8% of the Supply Is in This Zone! About 8% of the $BTC supply has been accumulated between $80–82k. ETF investors’ costs and the 50-week moving average also point to the same range.
Bitcoin once again tested 80K, but the real battle is just beginning. 👀 For $BTC, the 80K–82K range is not ordinary resistance. - About ~8% of the BTC supply was acquired in this zone. - The average cost for ETF investors is also around 80K–82K. - The 50-week MA is near 81.1K. - Spot Bitcoin ETFs have seen net inflows for 8 straight days, totaling roughly $2.8 billion in that time. On one side there is strong institutional demand, and on the other a massive supply wall. Even more, there is about $6.4 billion worth of BTC options expiring this Friday. For me, the critical zone is very clear: Holding above 80K–82K: a strong confirmation for the rally to continue. Below 77.5K–78K: the first important signal that short-term momentum is weakening. 🟢 My daily directional expectation: Today, my main expectation is sideways to slightly positive, but I remain cautious while price is below 80K. (Not investment advice)
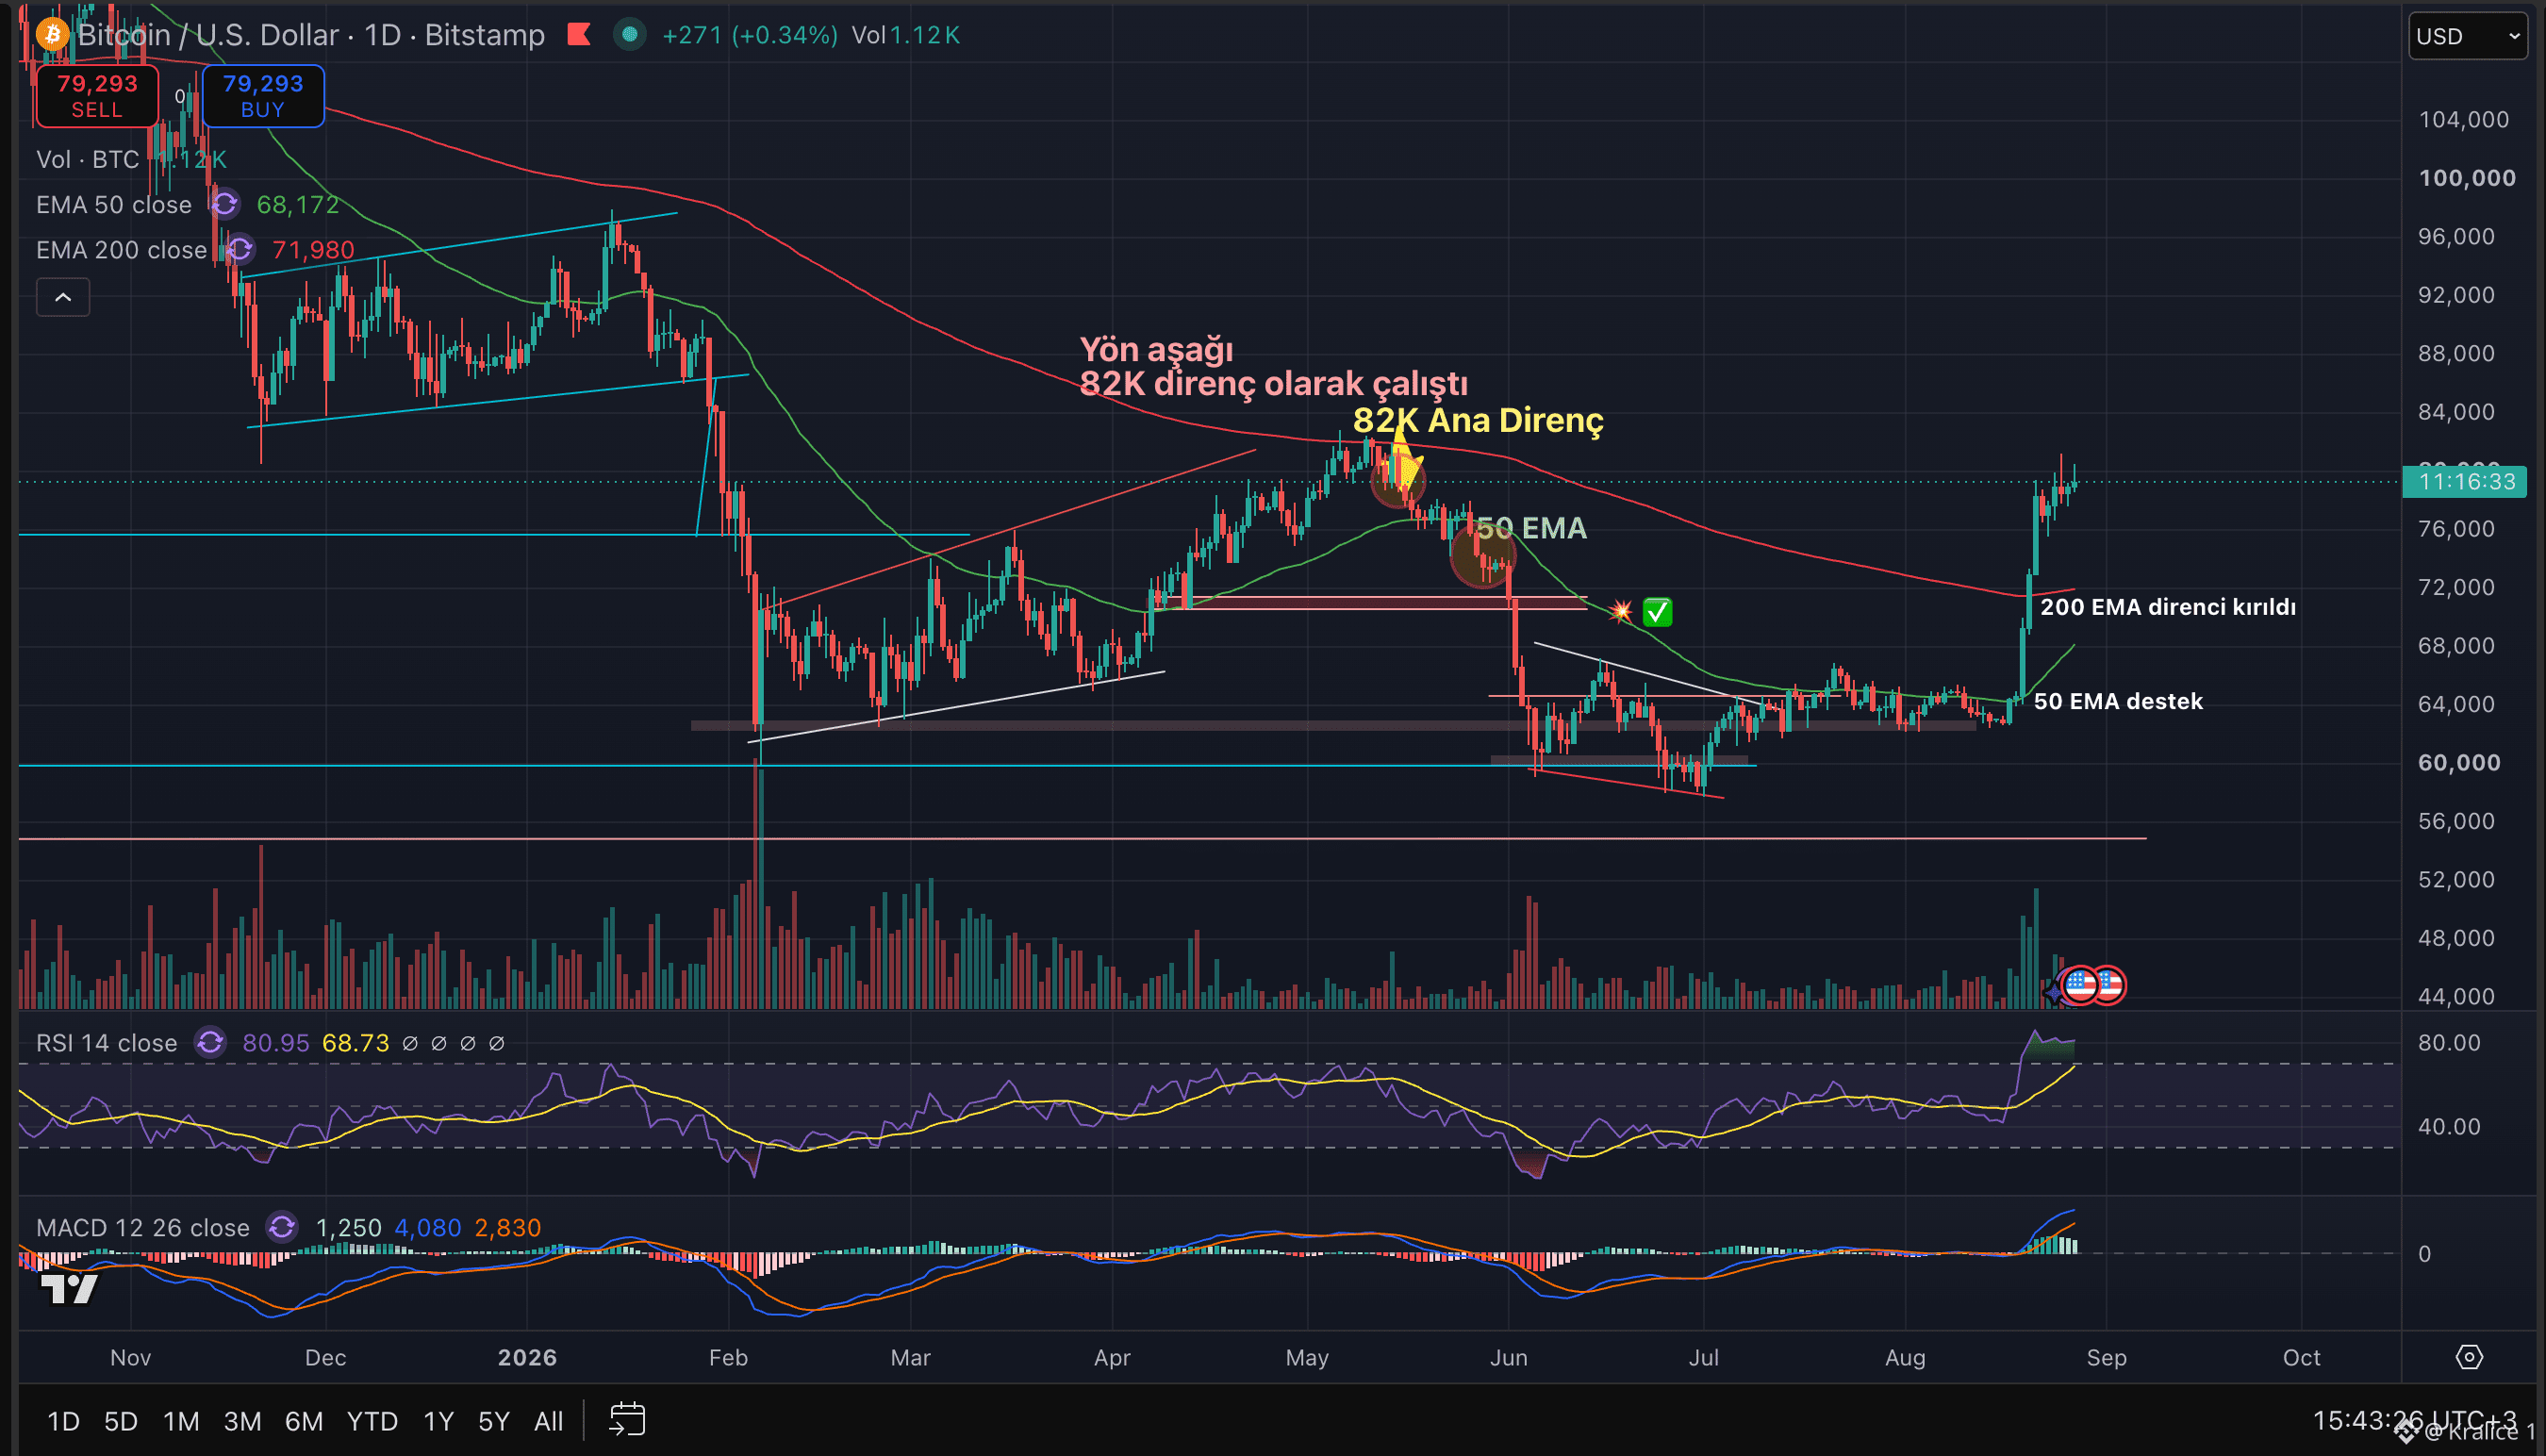
Is this just a correction, or the end of the rally? 👇 First, let me say this: It’s only a correction! After $BTC rose by about 23% over the last 7 days, it’s consolidating in the 78–79K range. ATTENTION: ▪️ Rejection came from the 81K area. ▪️ The weekly 50 EMA has been regained. ▪️ ETF demand continues. ▪️ Market sentiment is in an extremely optimistic zone. ▪️ On Friday, a $6.4 billion BTC options expiry is coming. Today’s Core PCE came in line with expectations at 0.2% month-over-month. There isn’t a big inflation surprise, but the annual core PCE is still 3.3%. After a rapid rise, a correction is normal—look at the weekly chart and how positive it is 👇👇👇 But I’m also waiting for your opinions, especially if anyone thinks it will drop..
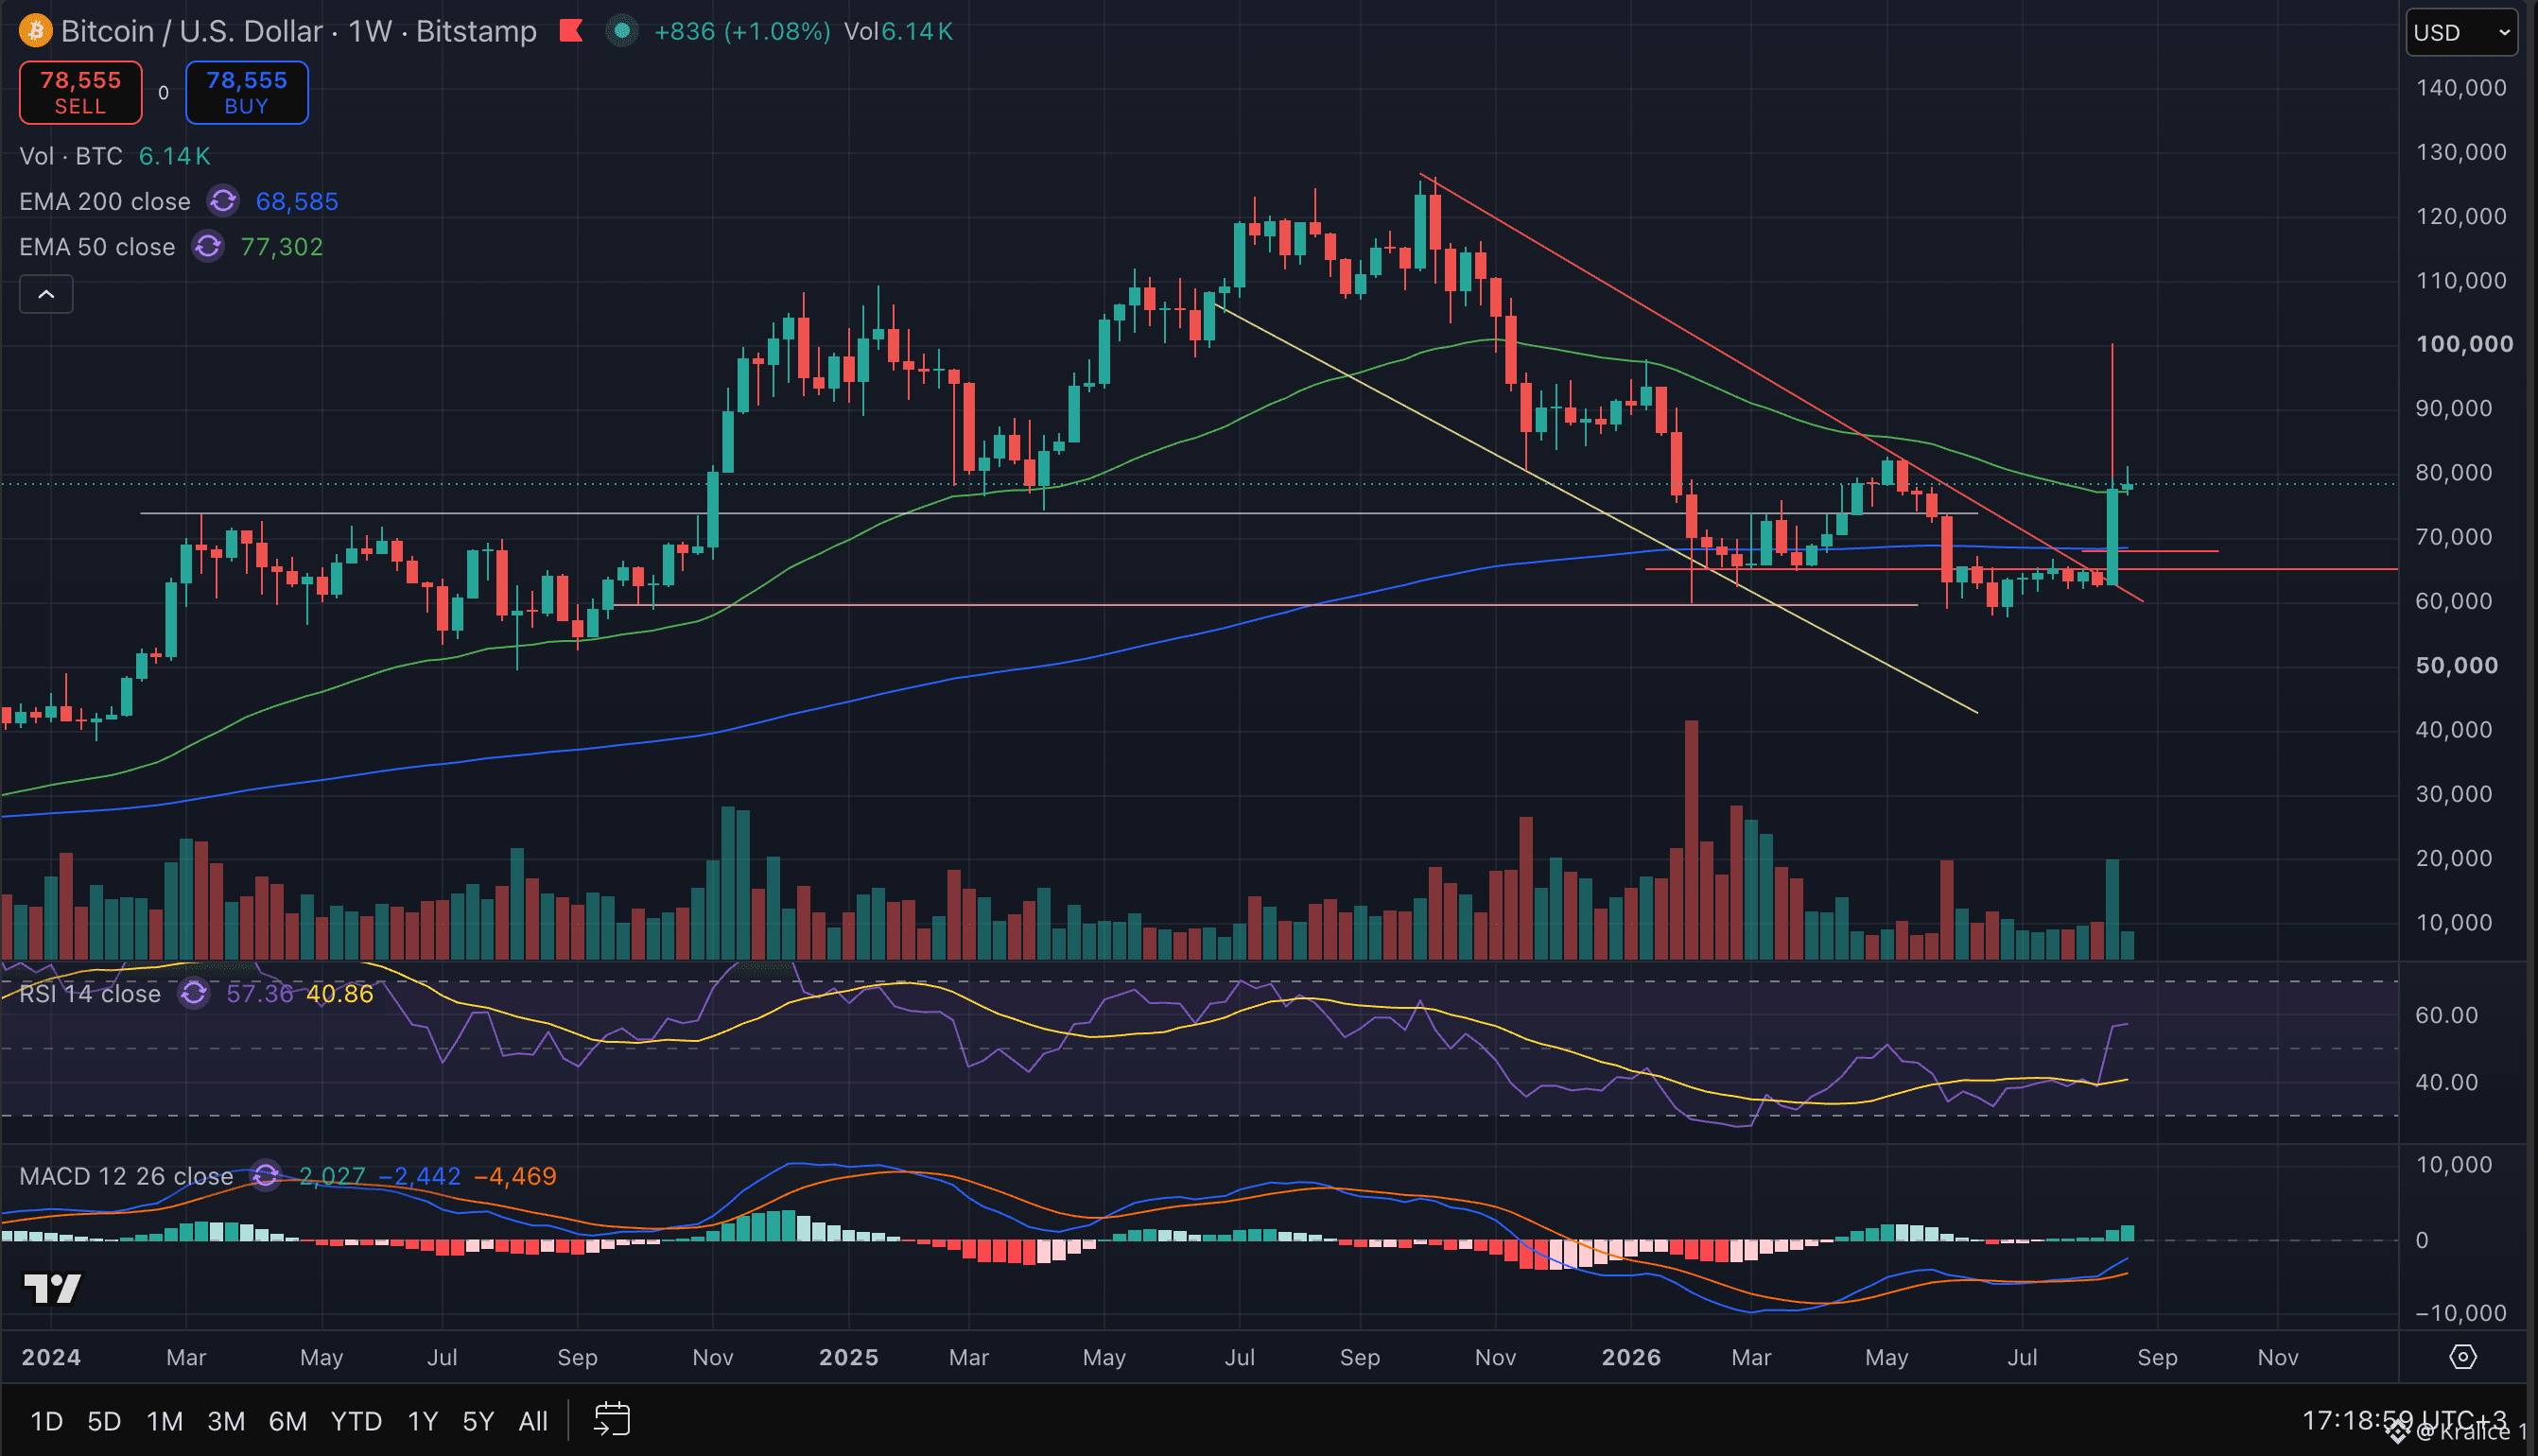
Bitcoin saw 81K, but I think we’ve now reached the most important test of the rally. 👀 Last week’s first push higher was driven by a dev short squeeze. Even today, in the 81K move alone, about $225M in shorts were liquidated in just 10 minutes. 🚨 But the data I care about more is this: as $BTC moved up, futures open interest fell to the lowest point in 5 months. In other words, the market isn’t inflating with excessively leveraged longs. On top of that, the positive streak in Monday’s Bitcoin ETF flows reached 6 days. That matters because a short squeeze is a temporary, forced buy. ETF inflows help us judge whether real spot demand is still continuing. BUT WATCH OUT: BTC was rejected exactly at the 81–82K key resistance. And tomorrow, Core PCE will be released. For now, my short-term direction: SIDEWAYS (slightly up). The rally is strong, but when everyone starts getting overly optimistic again, you can’t afford to abandon risk management. 👑
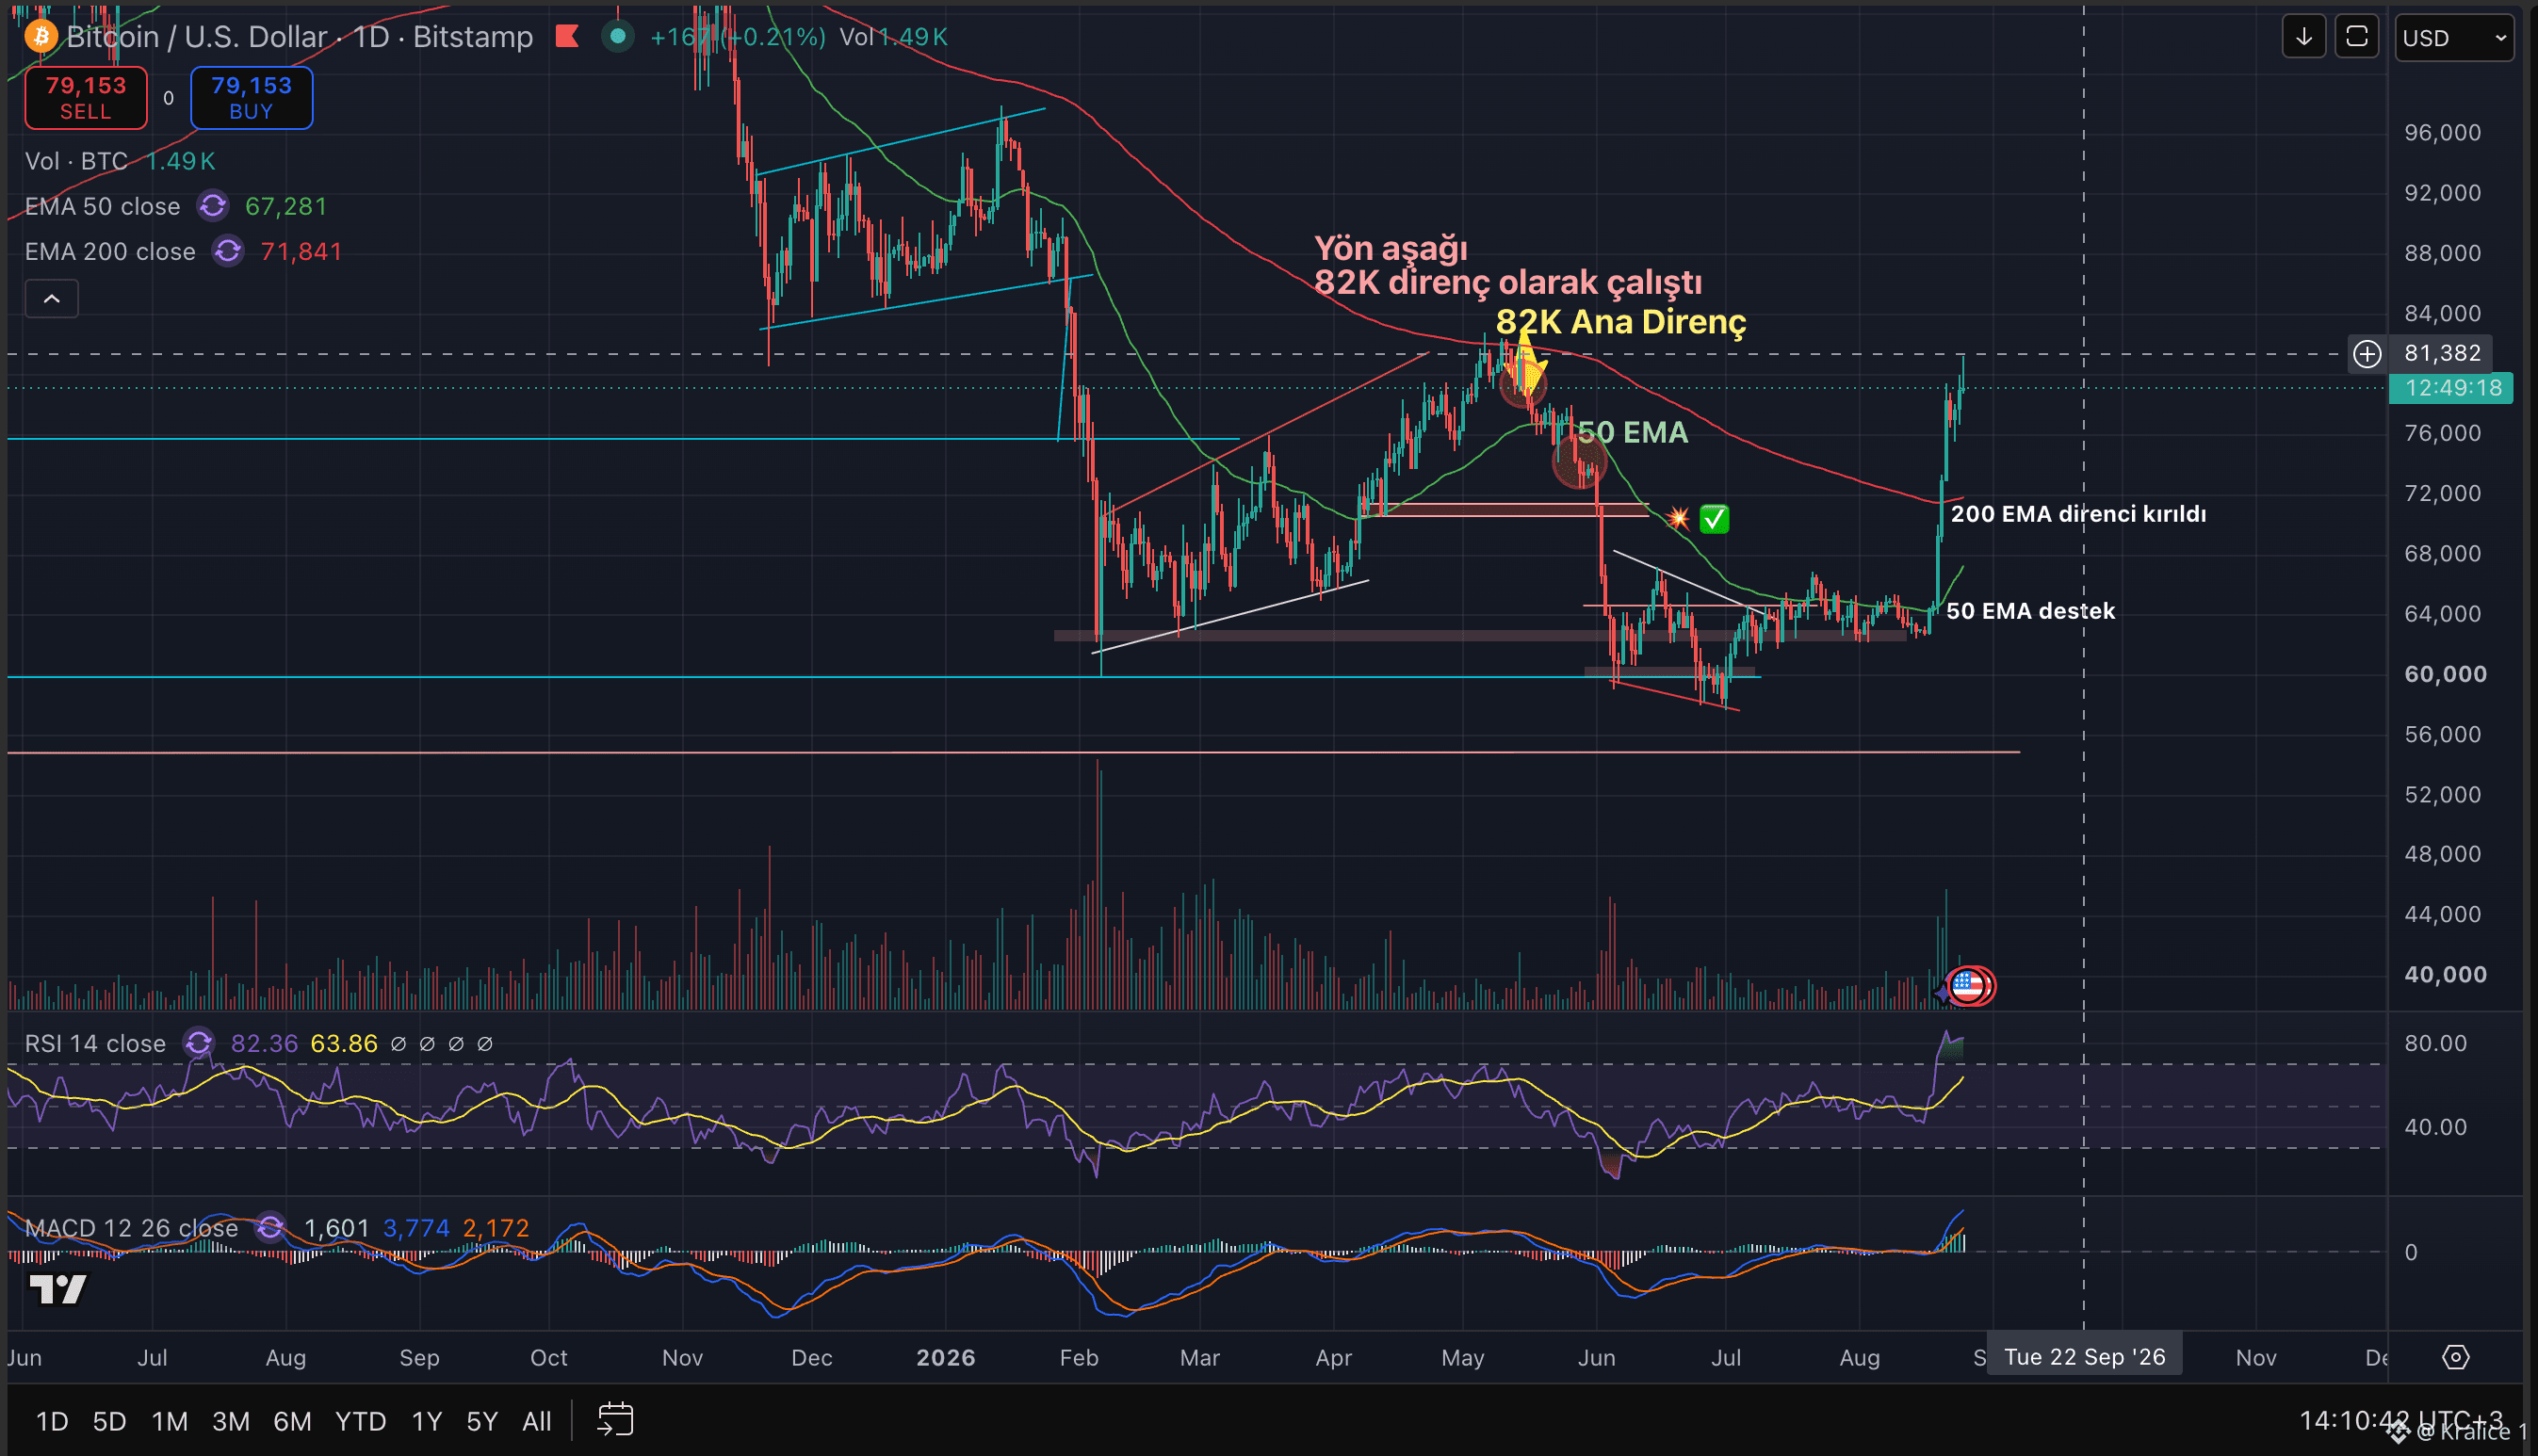
Bitcoin is back at the 79K door. But pay attention here. 👀 A good portion of last week’s 23% rally was accelerated by a short squeeze. Now most of the shorts have been cleared, and we can see leveraged longs starting to accumulate. So the market’s risk profile is changing. $BTC reclaimed the daily 200 EMA with strong volume, which is quite positive for the medium term. But the daily RSI is 82. So instead of chasing the price with FOMO here, I’d rather watch for the 82K breakdown or a healthy pullback. For now, my short-term bias is: RANGEBOUND, but with an upward tilt.
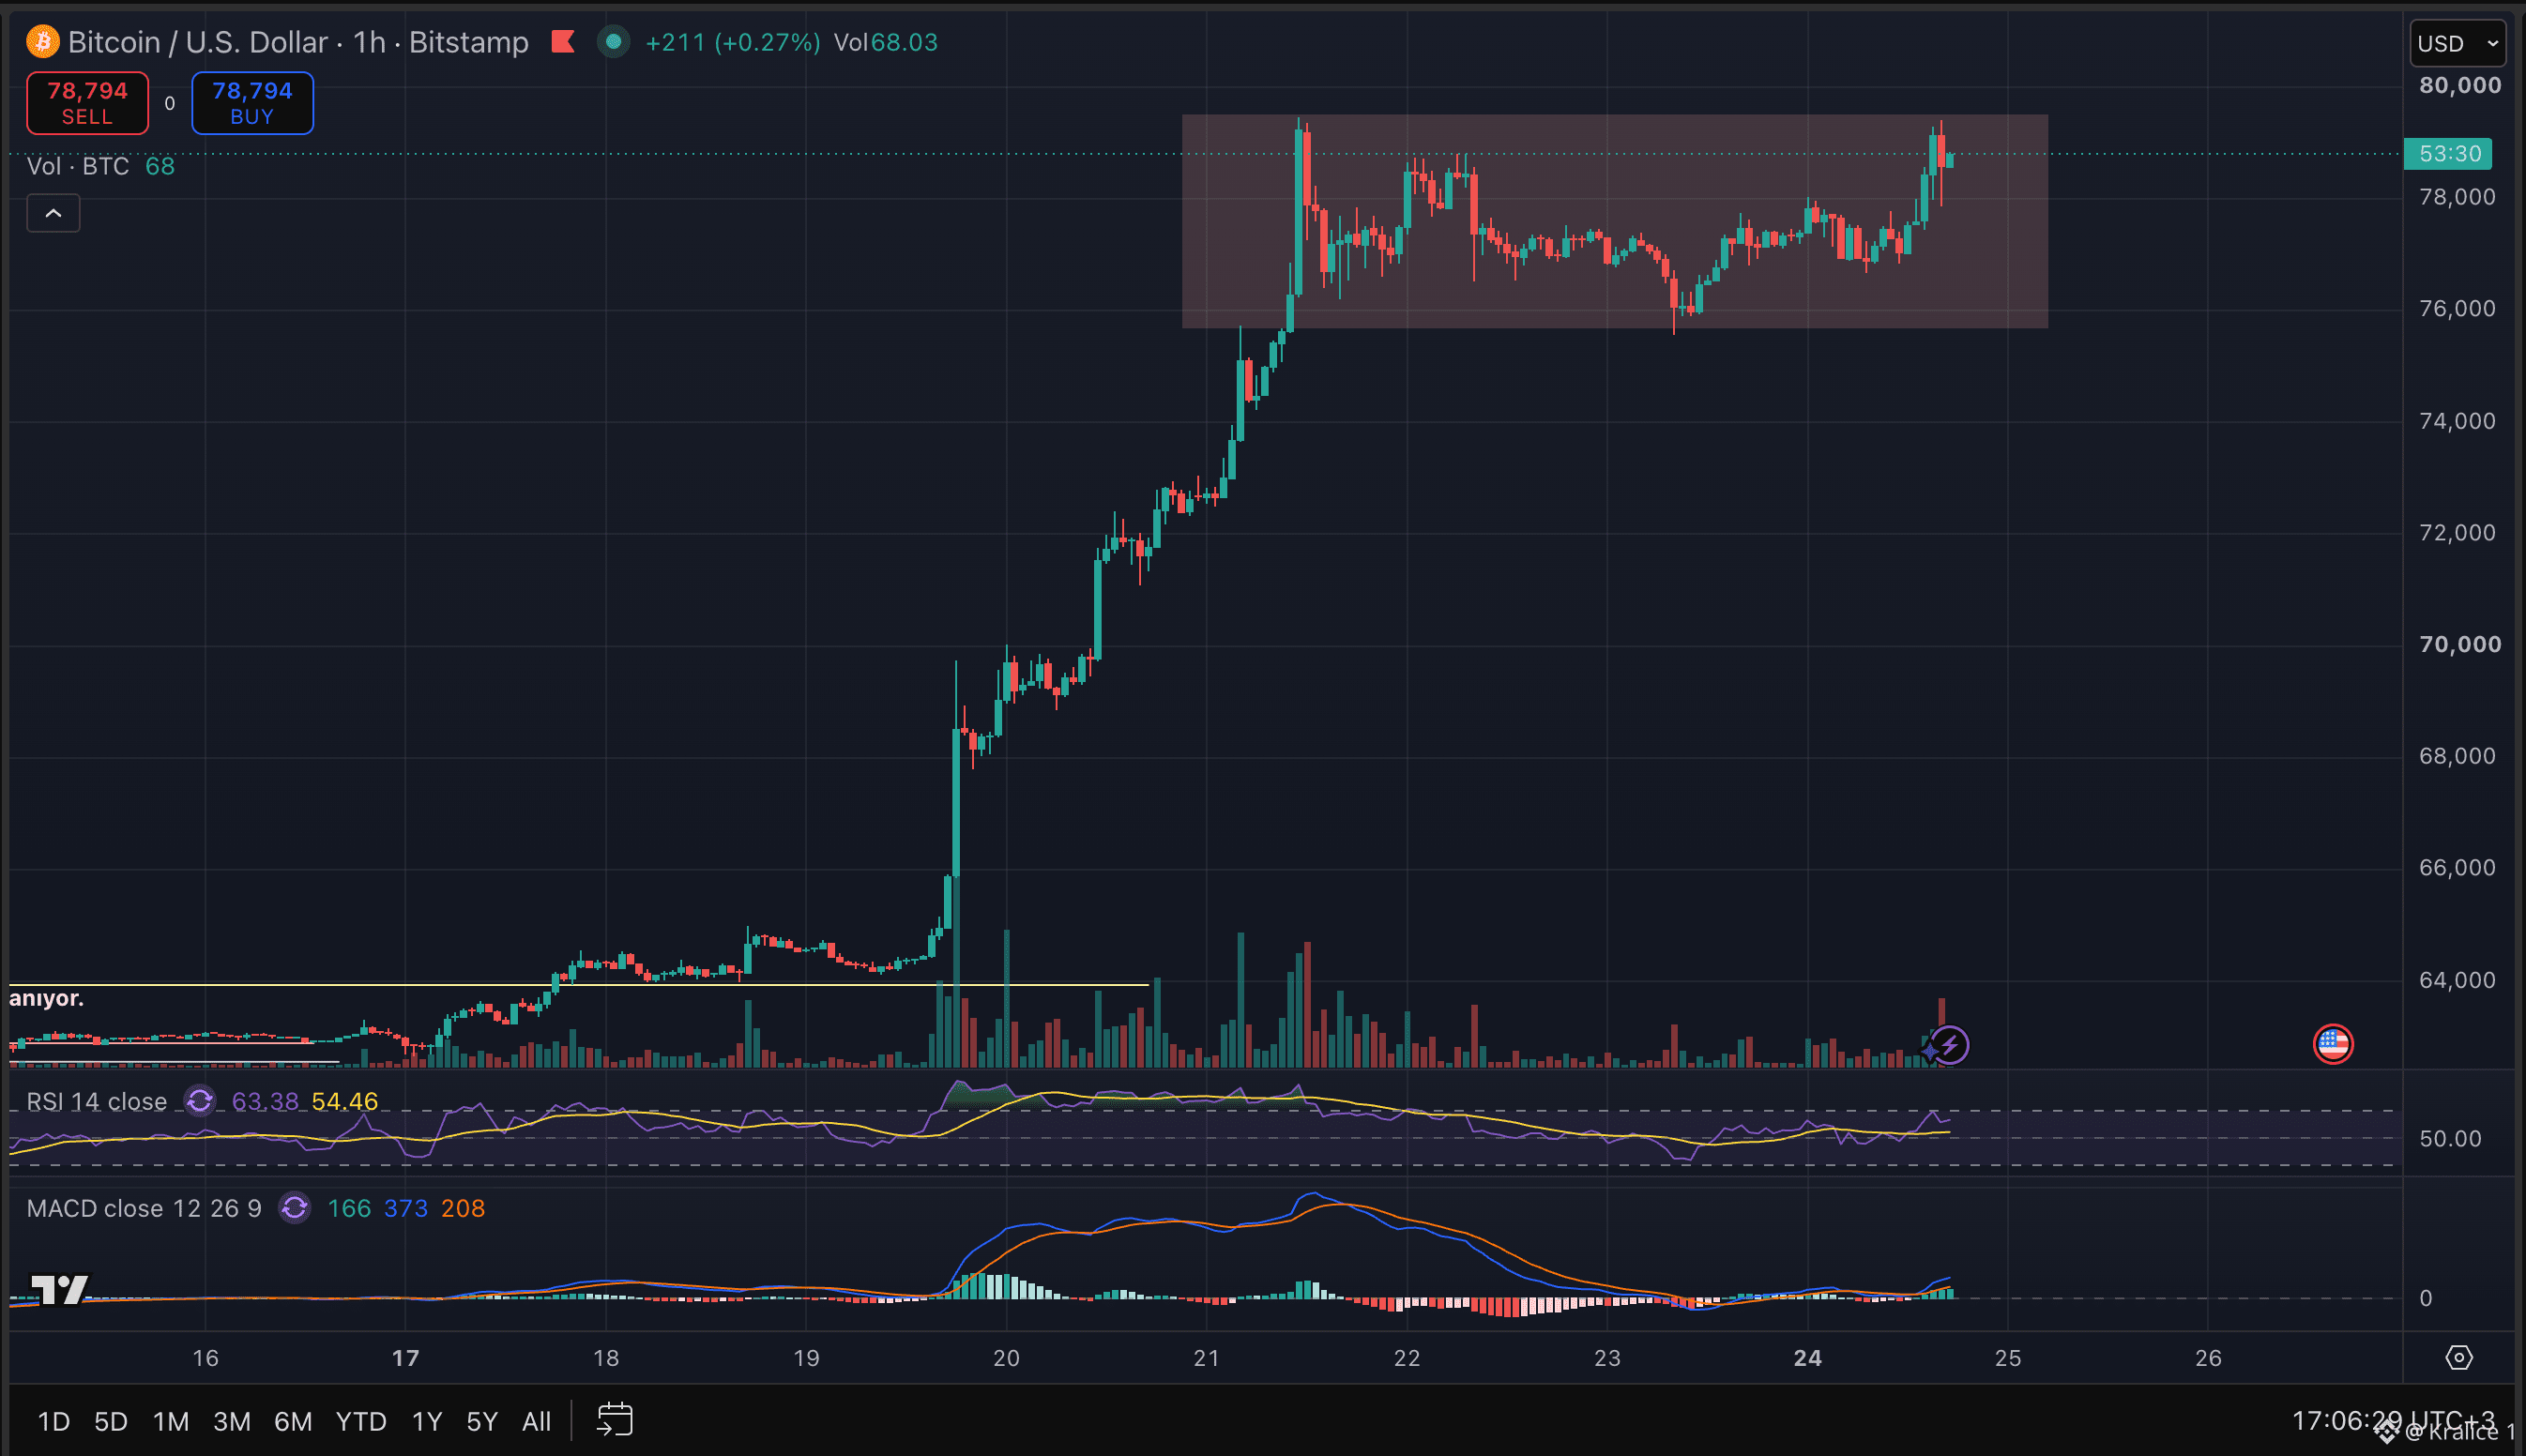
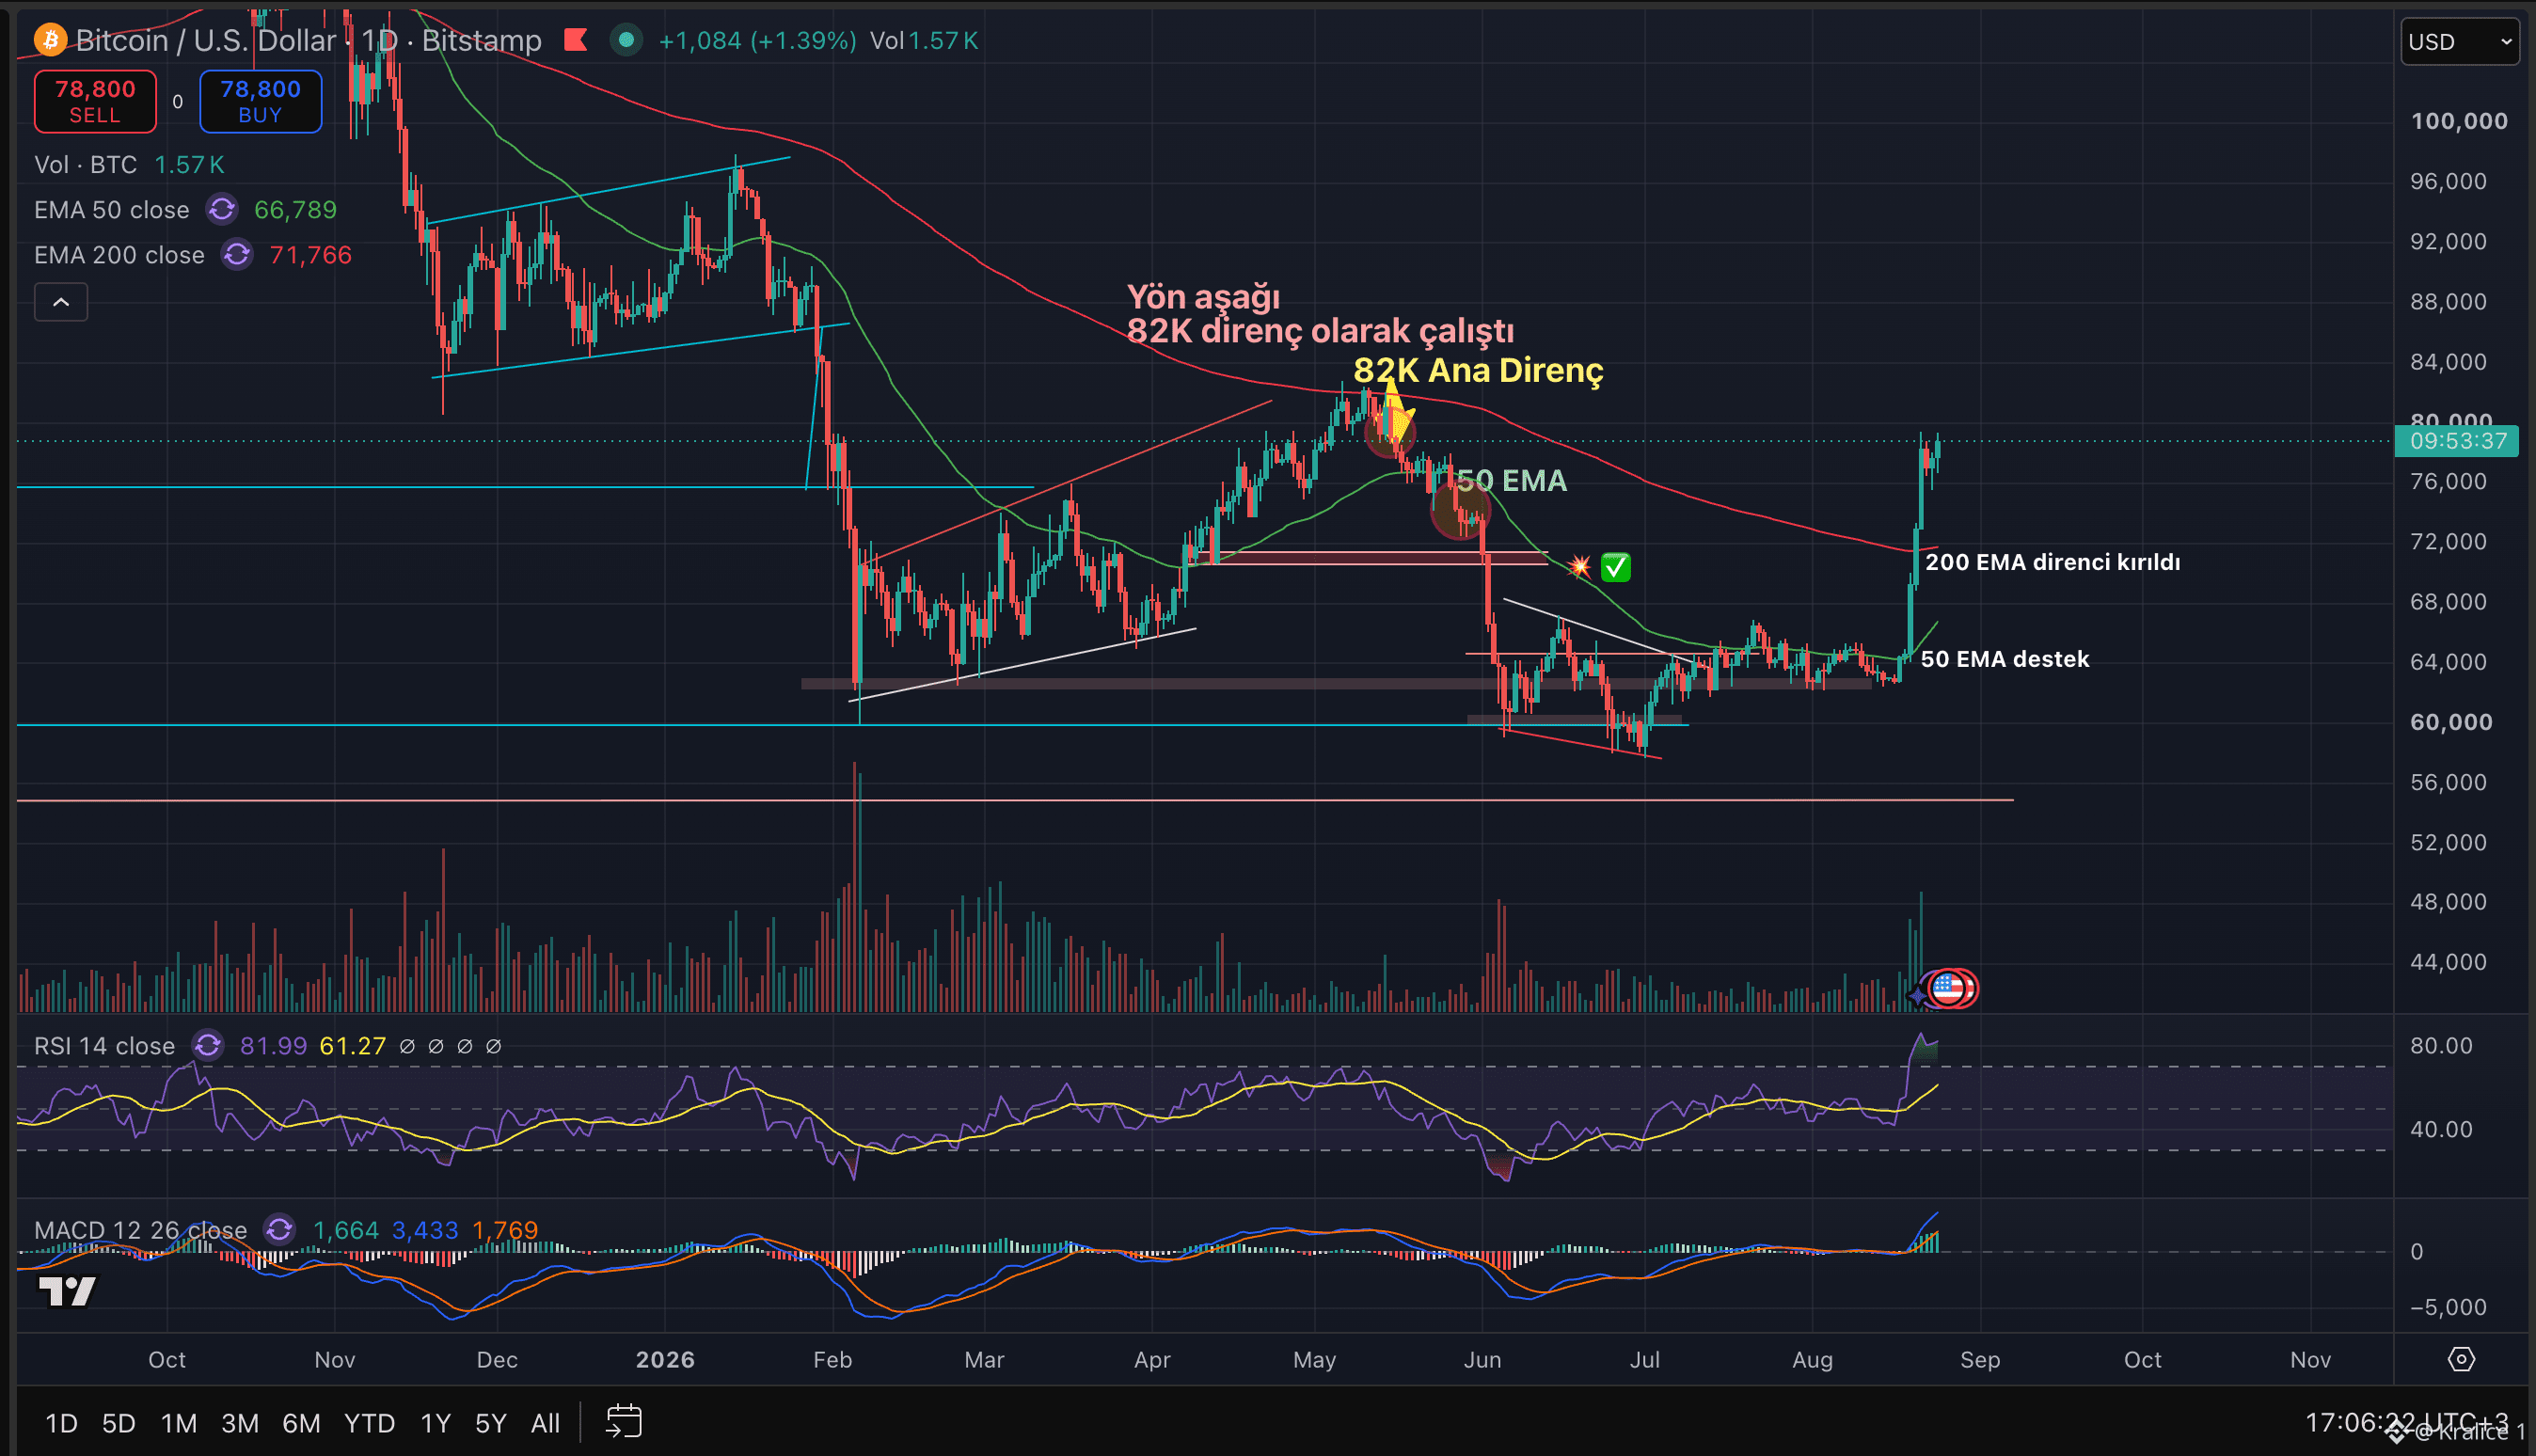
Bitcoin once again saw 79k, there is a double top—it's got to break through this area quickly; resistance will be around 82k. $BTC
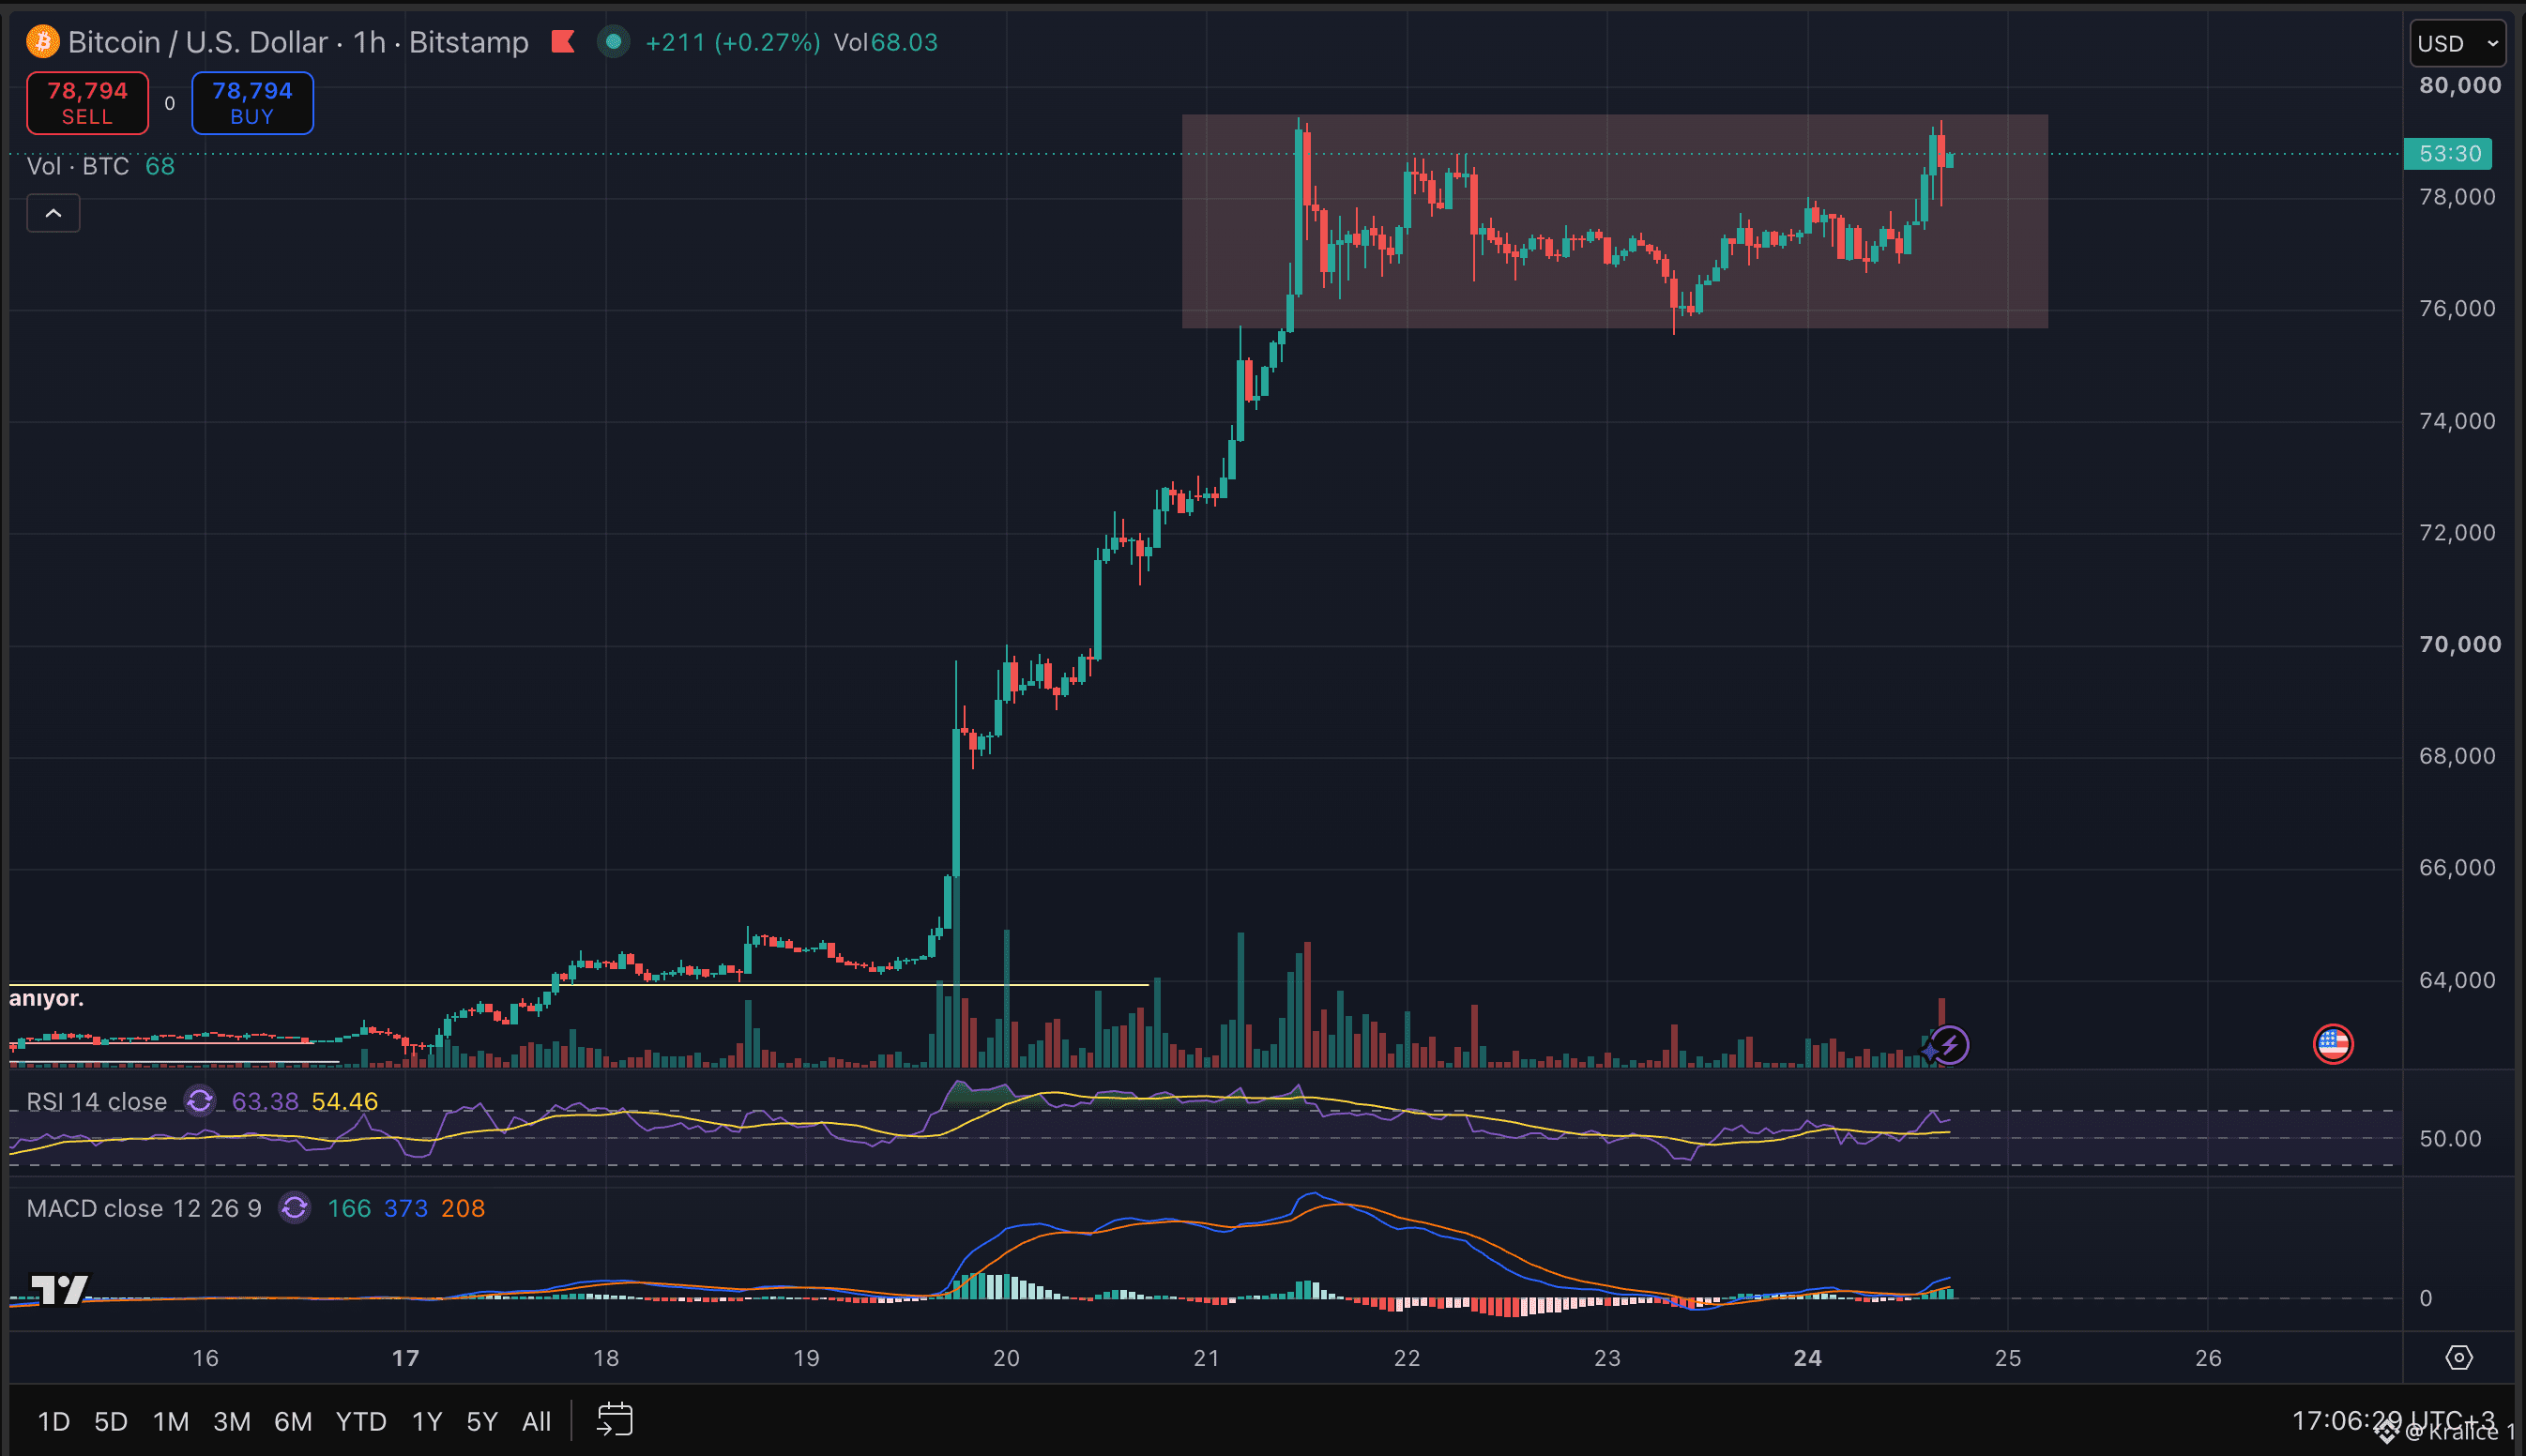
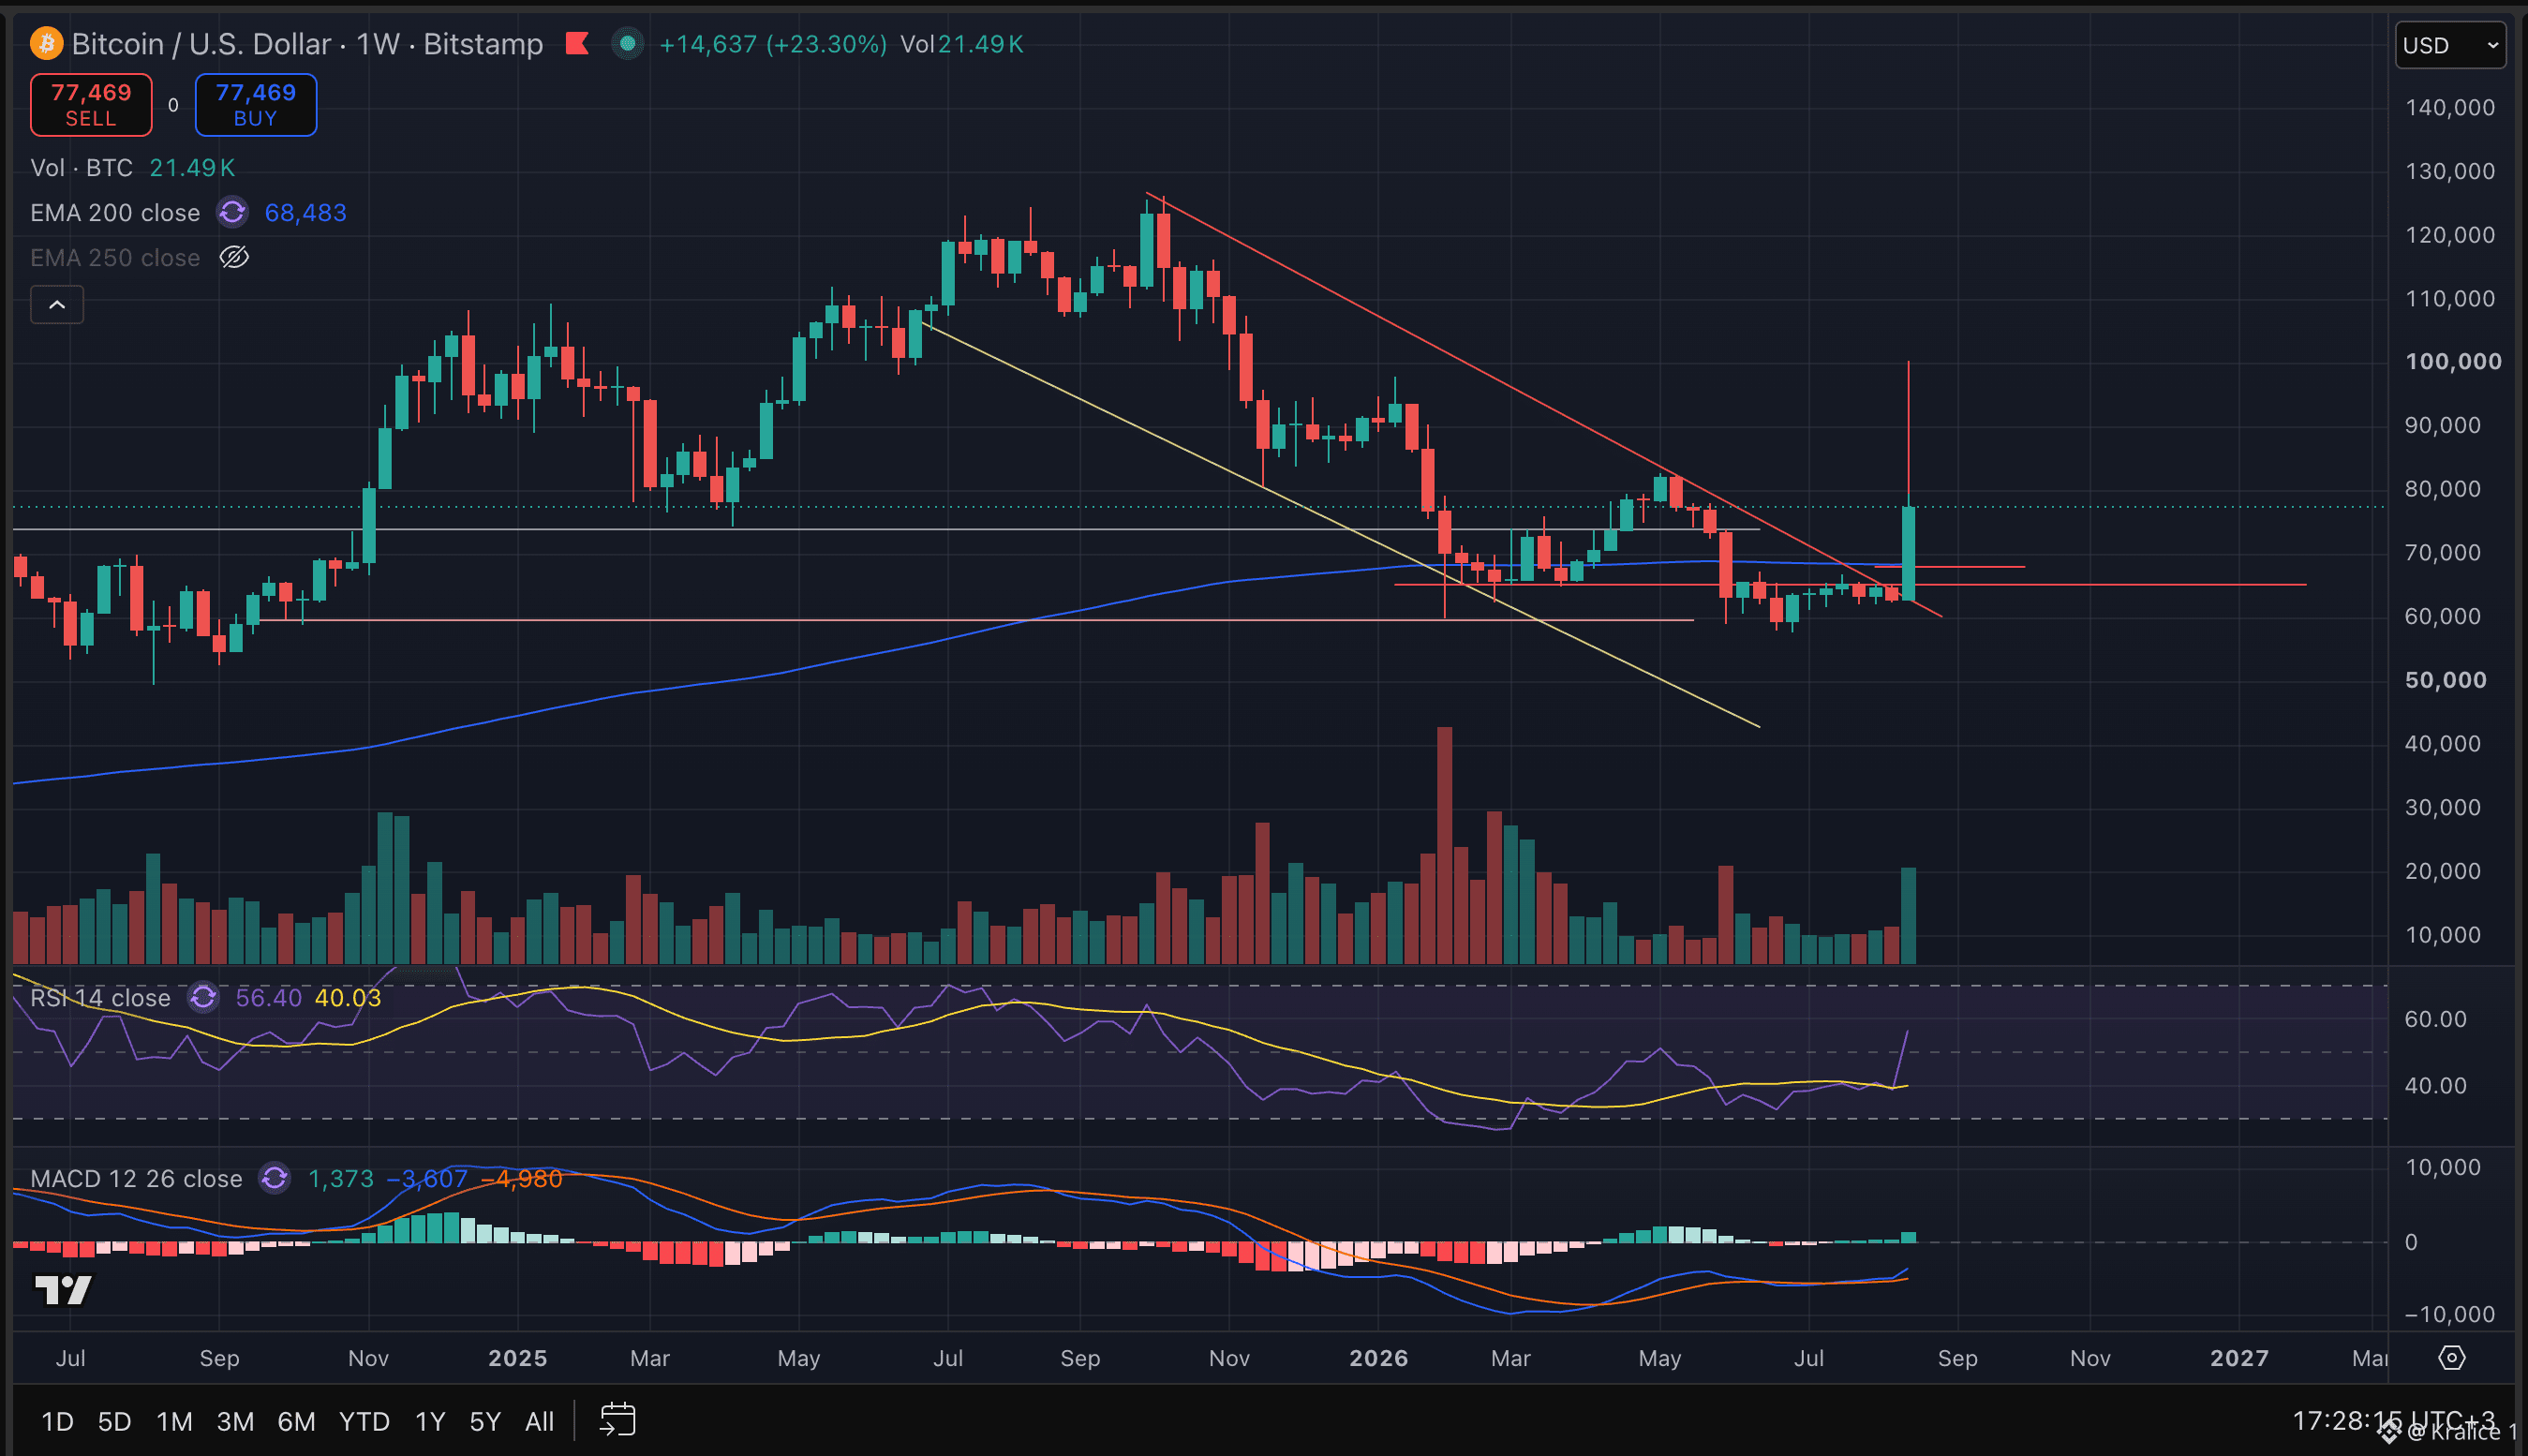
BTC closed the week up more than 20%, but I think the real important part is starting now. There were three key forces behind last week’s move: 1- The US Treasury increased its long-term bond buybacks, and we saw a loosening in long-term yields. 2- Strong capital inflows returned to BTC and ETH ETFs. 3- The market got caught on the short side, and the short squeeze accelerated the rally significantly. From a technical perspective, the most important change for me is that BTC reclaimed the 200-day EMA and moved above the declining trend that has been in place for months on the weekly chart. These are positive. 🔴 However, the daily RSI is around 80, and there is still a major supply zone ahead like 79K–82K. So let’s not chase here with FOMO! My $BTC plan: 📍 75.6K–76K first support 📍 74K critical support 📍 79K–82K main resistance If I see a strong daily close above 82K, my upside scenario will be significantly strengthened. If a daily close comes below 74K, I would turn more bearish. For now, my short-term outlook: SIDEWAYS. The medium-term outlook, however, is now clearly more positive. After a big rally, instead of chasing price, waiting for confirmation is still, in my opinion, the right move. 👑
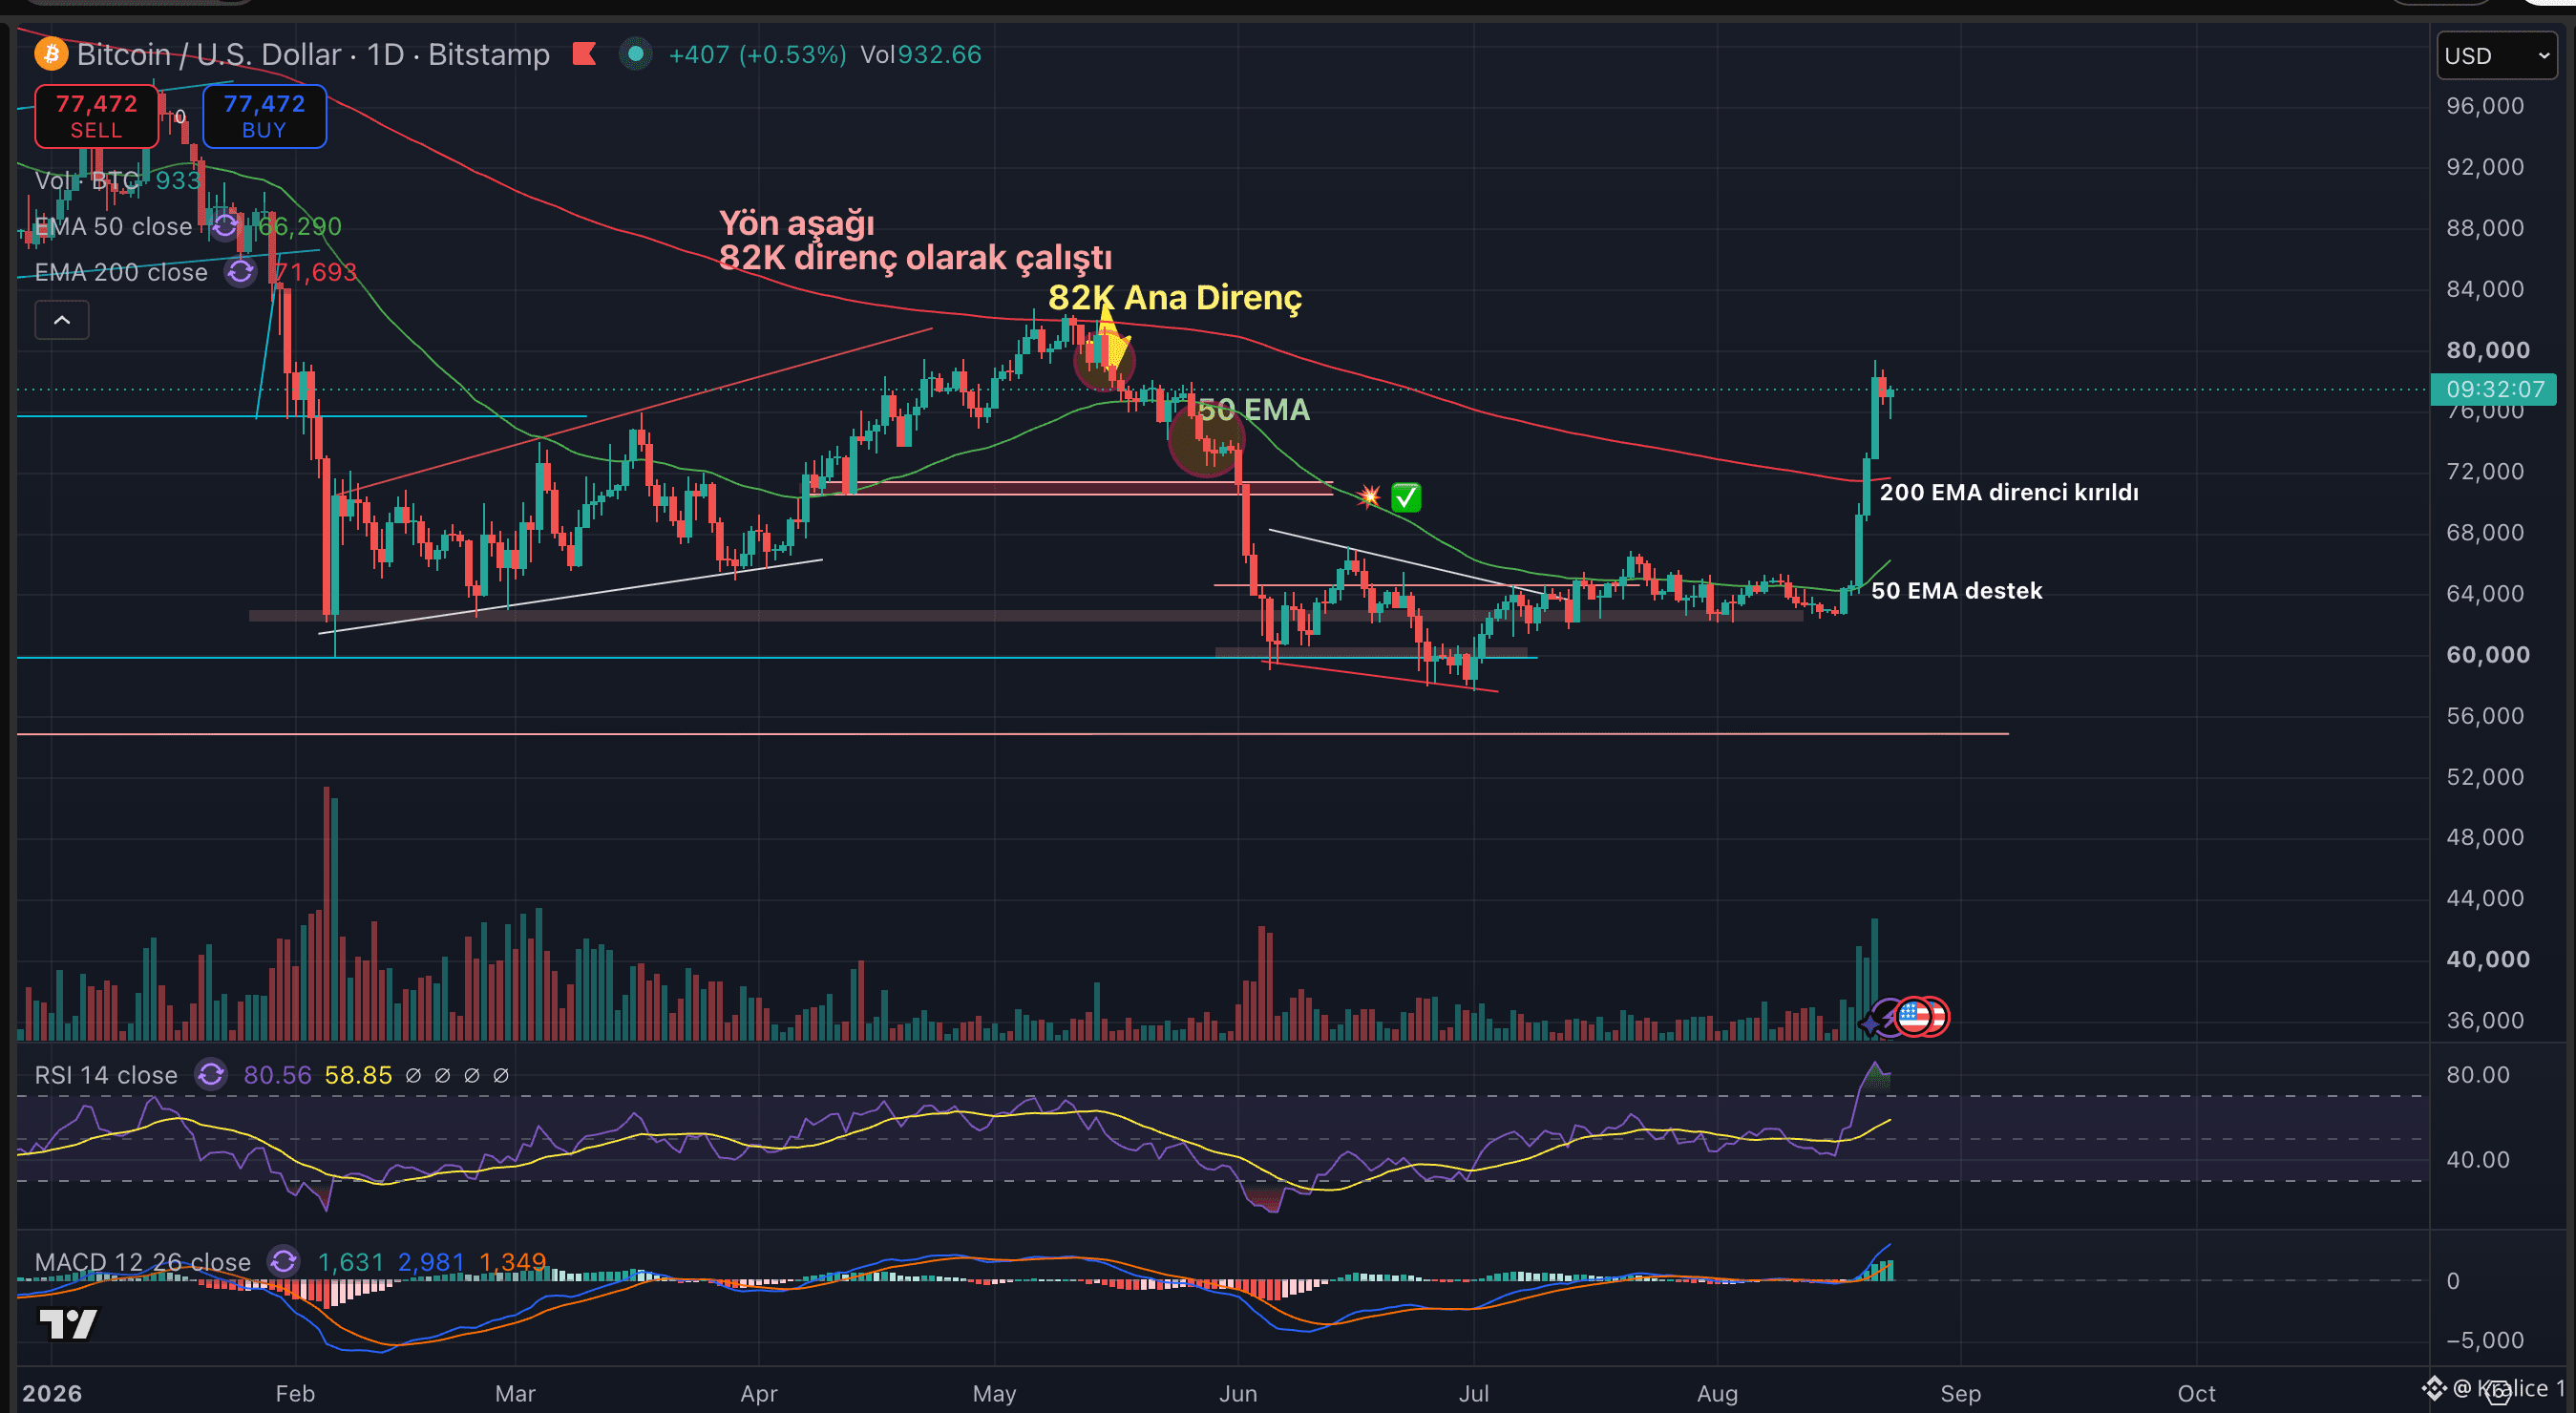
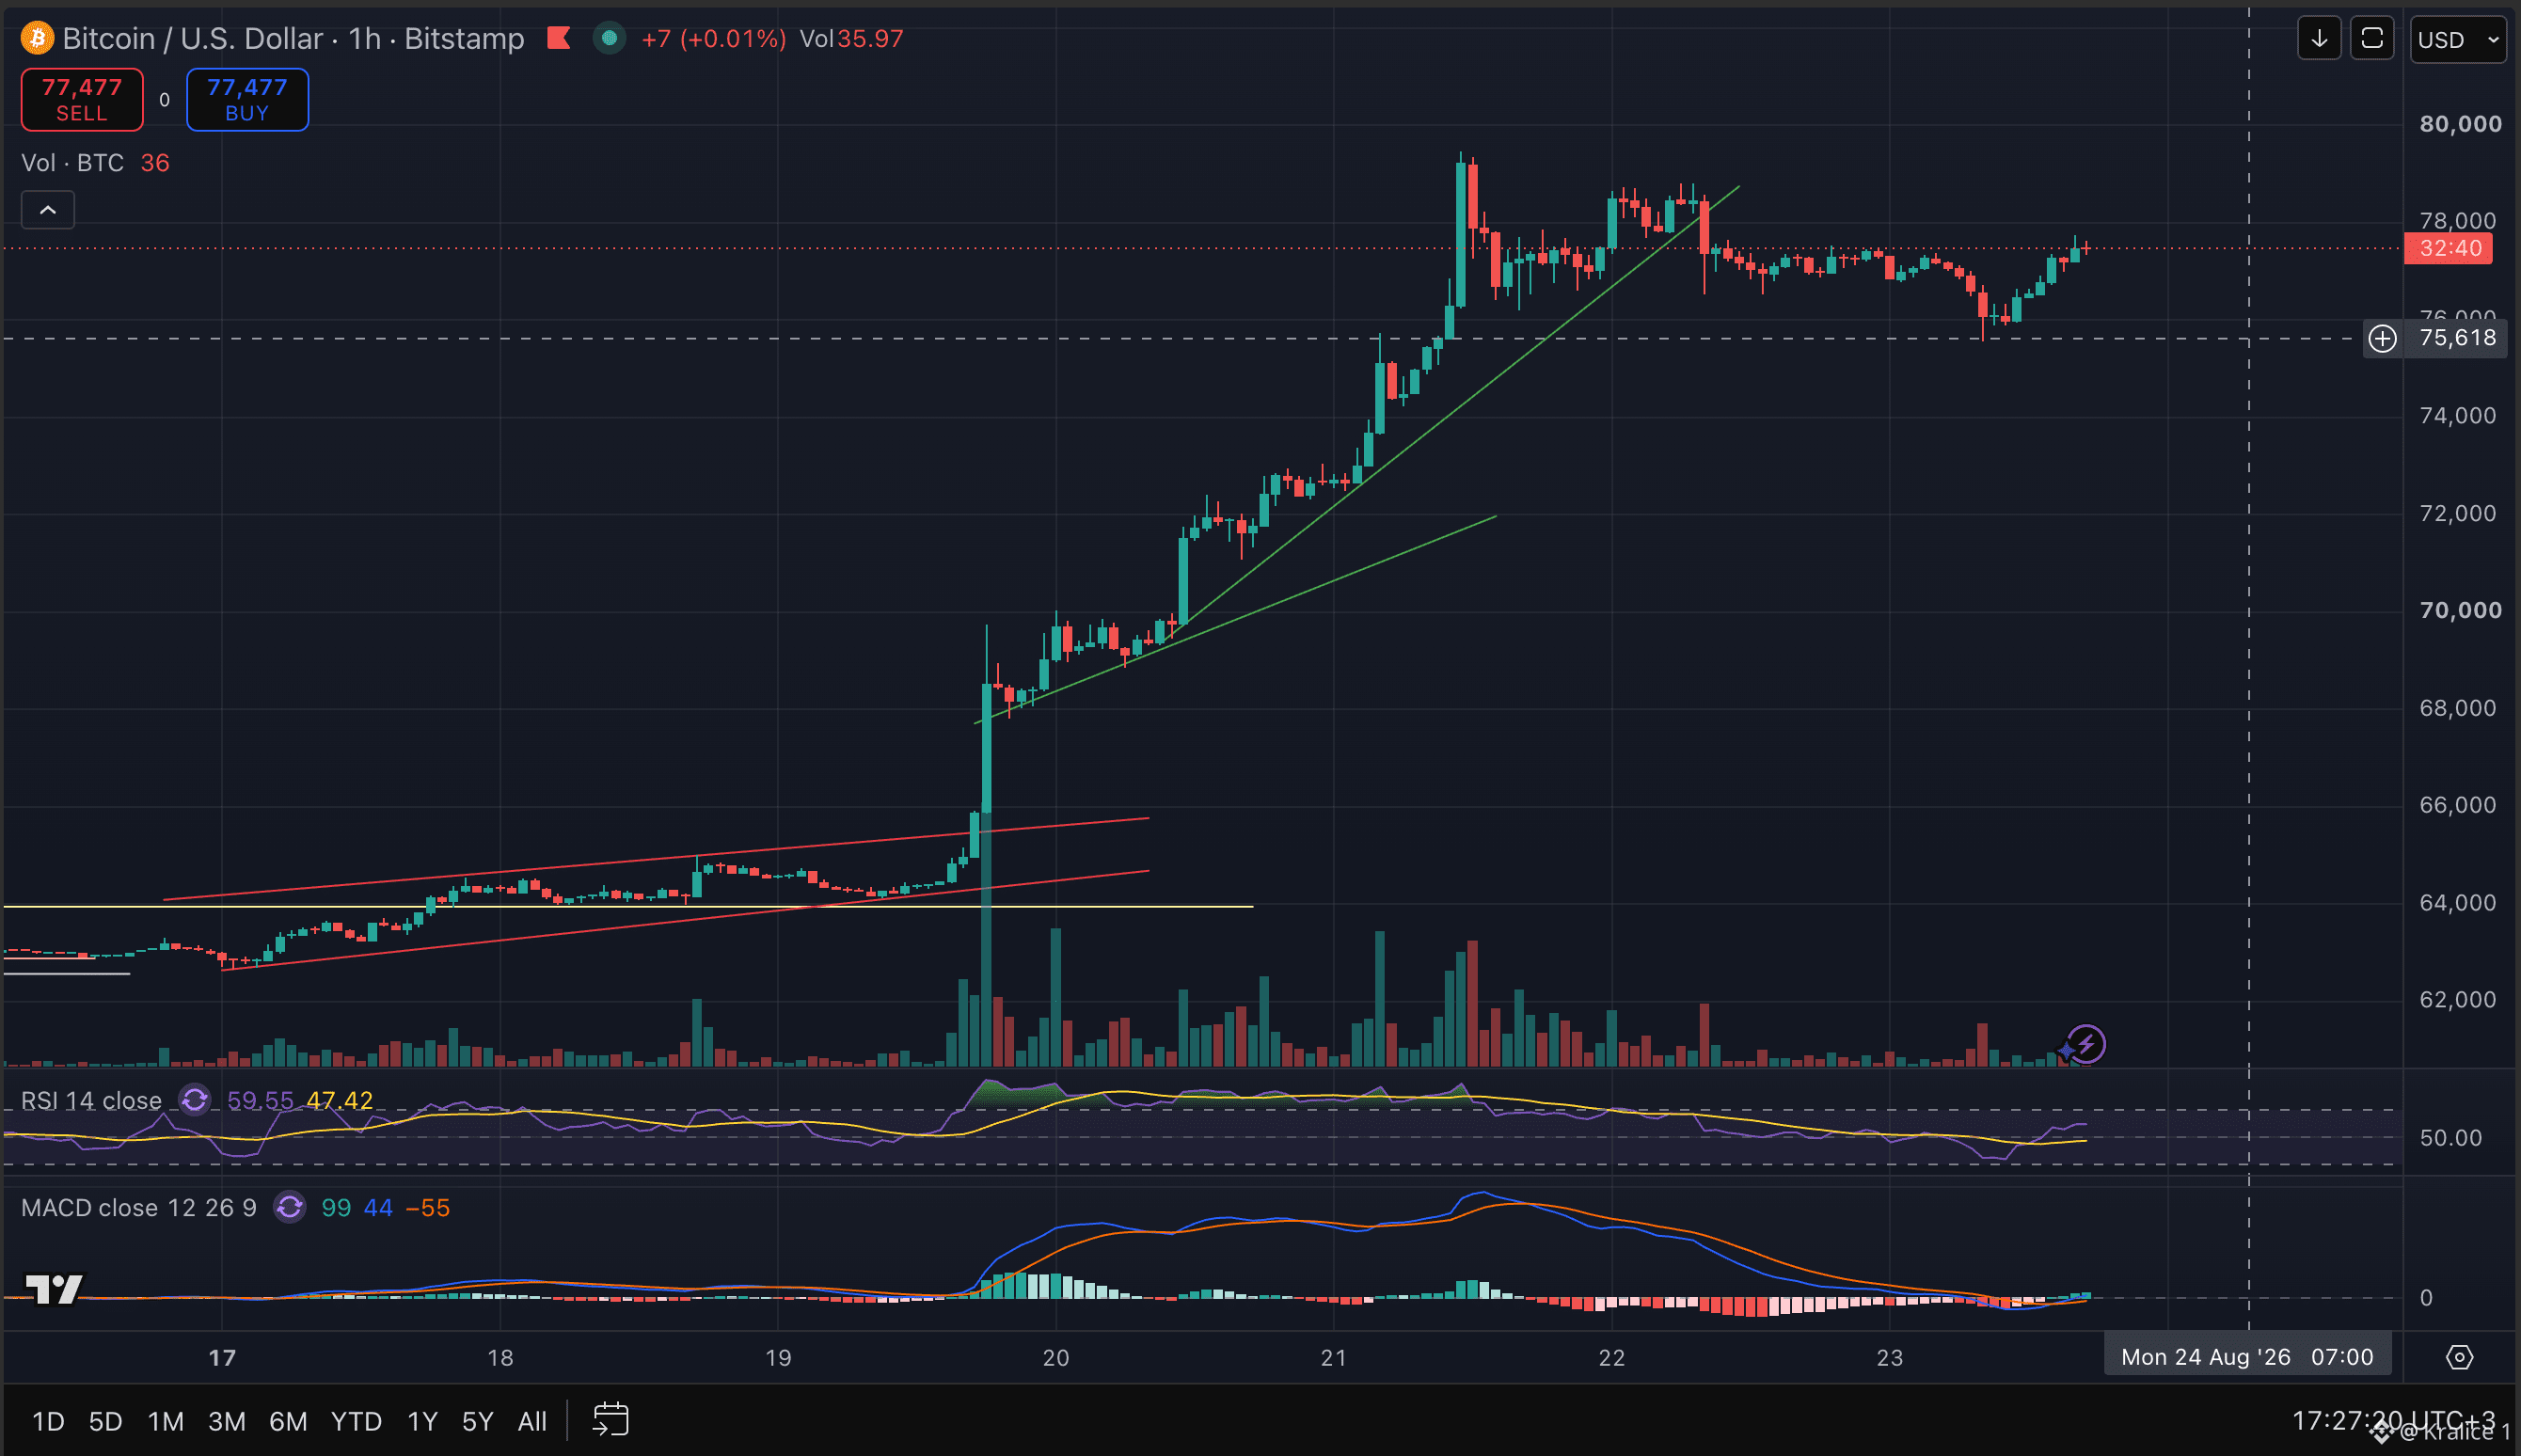
Bitcoin rose by about 25% within a few days, reaching the 78–79K range from the 64K zone. The main reason was a change in the U.S. Treasury buyback program. The U.S. Treasury increased long-term bond buybacks from $2 billion per trade to $4 billion. The 30-year bond yield fell from around 5.34% to 5.19%. The rally’s start was macro-driven, but its magnitude was boosted by a short squeeze. During the two-day move, more than $4 billion in bearish/short crypto positions were liquidated. U.S. spot $BTC and $ETH ETFs saw a total net inflow of approximately $2.61 billion. I don’t see BTC stalling around 77K as bad. On the contrary, after a 20%+ move, letting the market cool off a bit is healthy. On the technical side, BTC has regained the daily 200 EMA. That is the most important development in this chart. My near-term outlook: SIDEWAYS
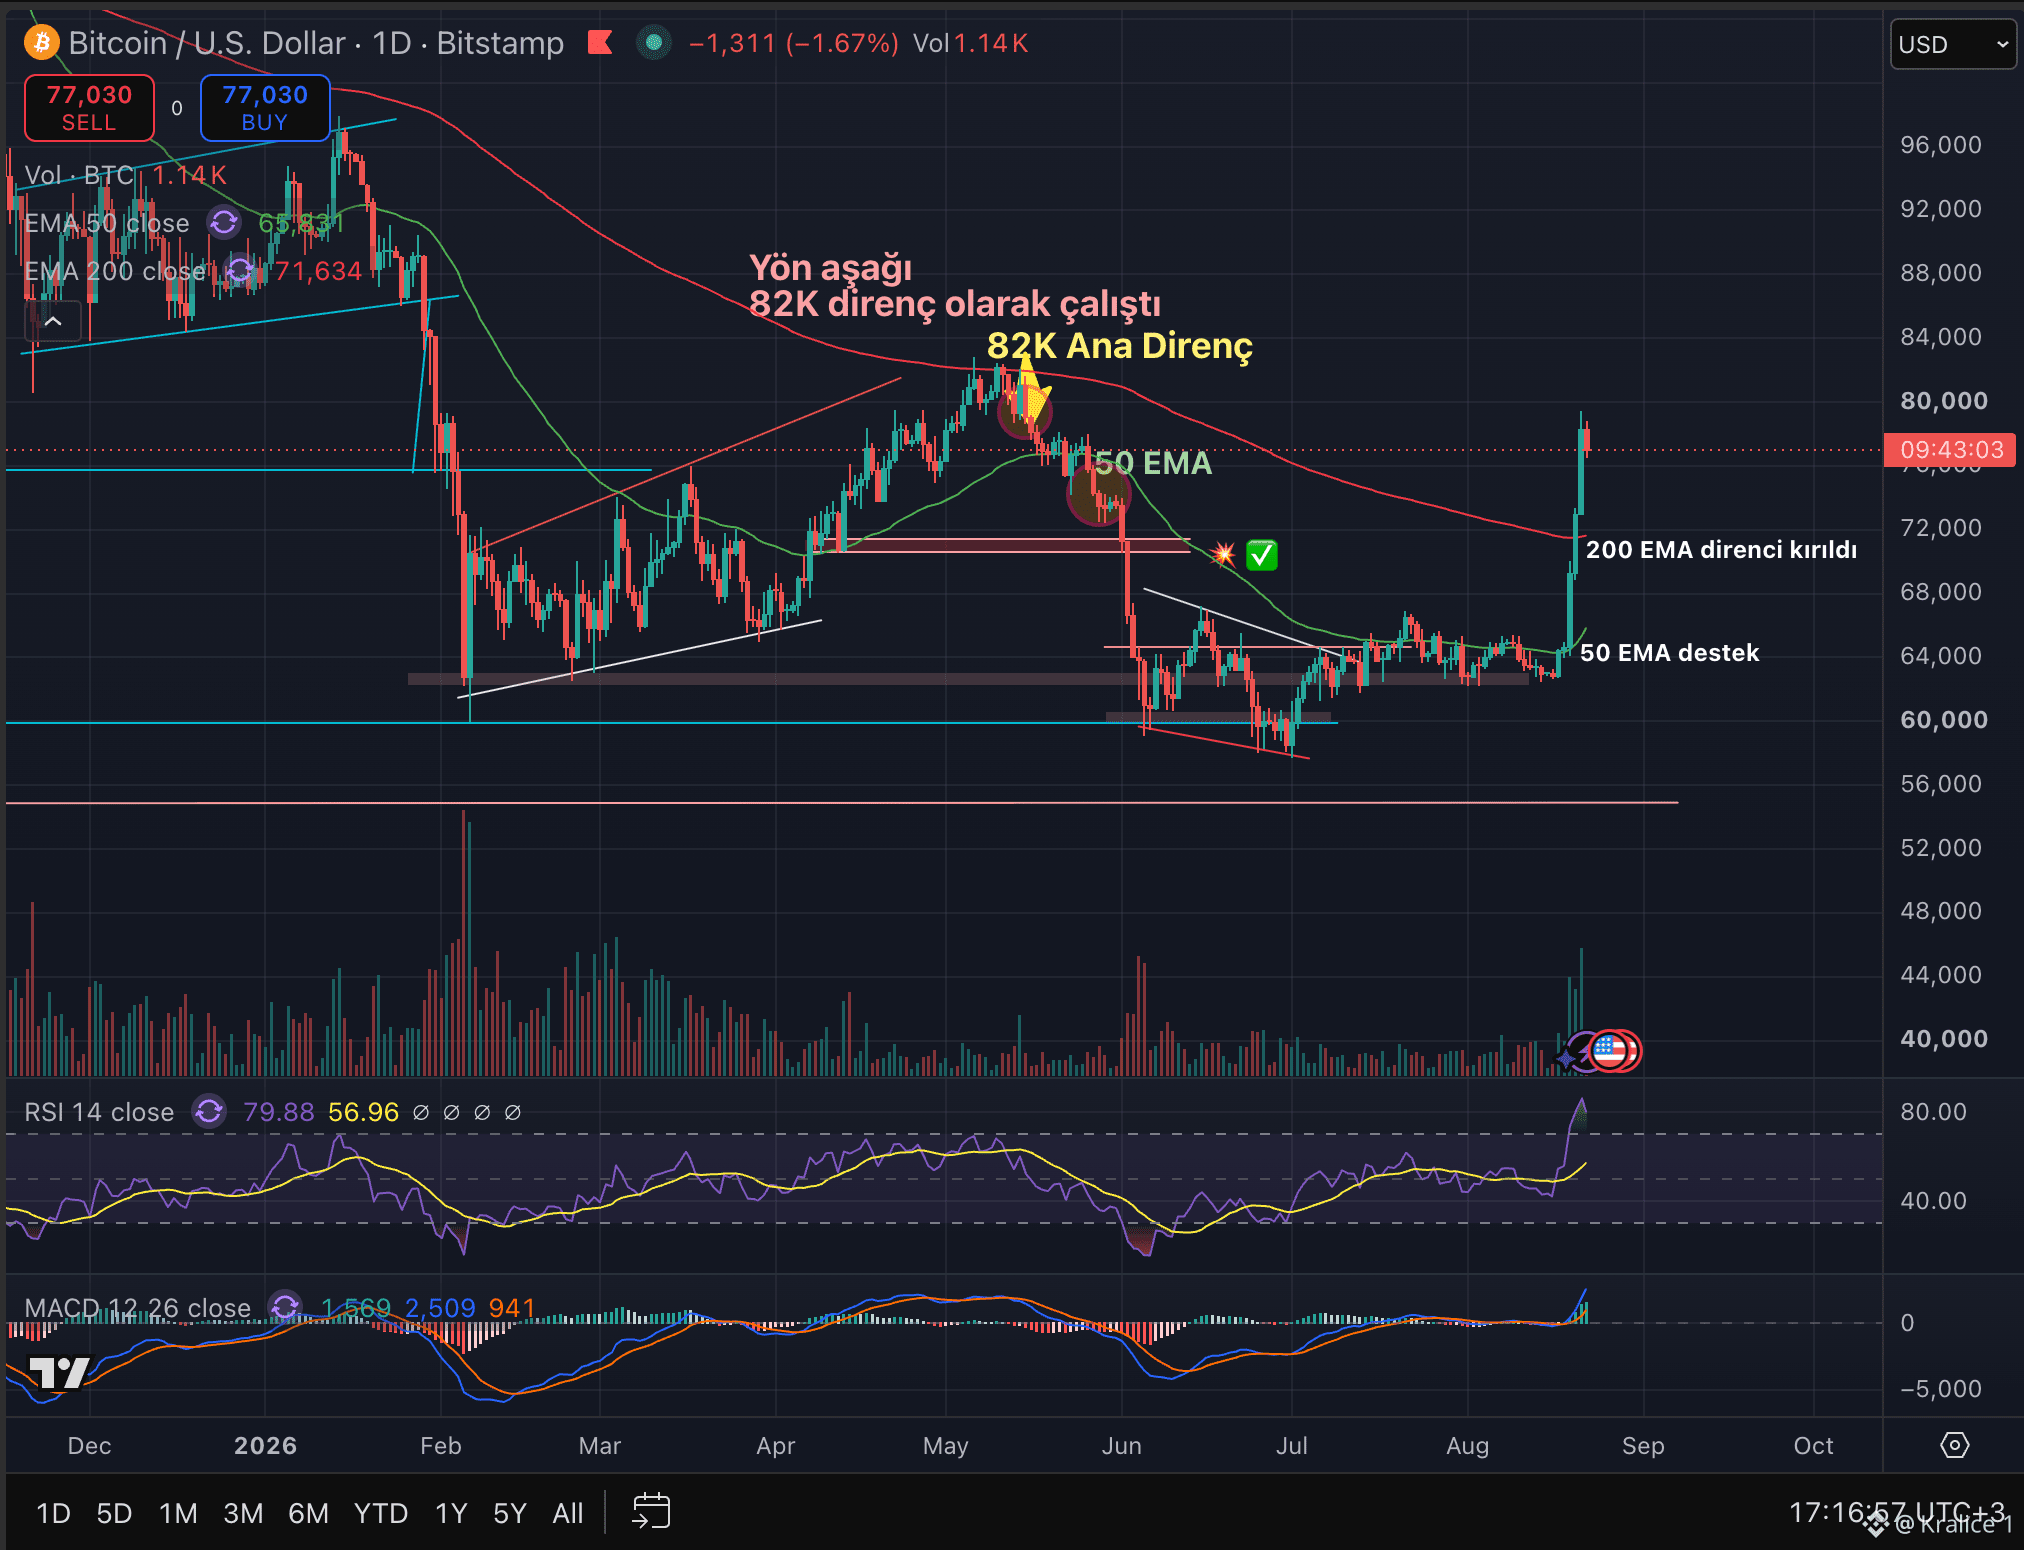
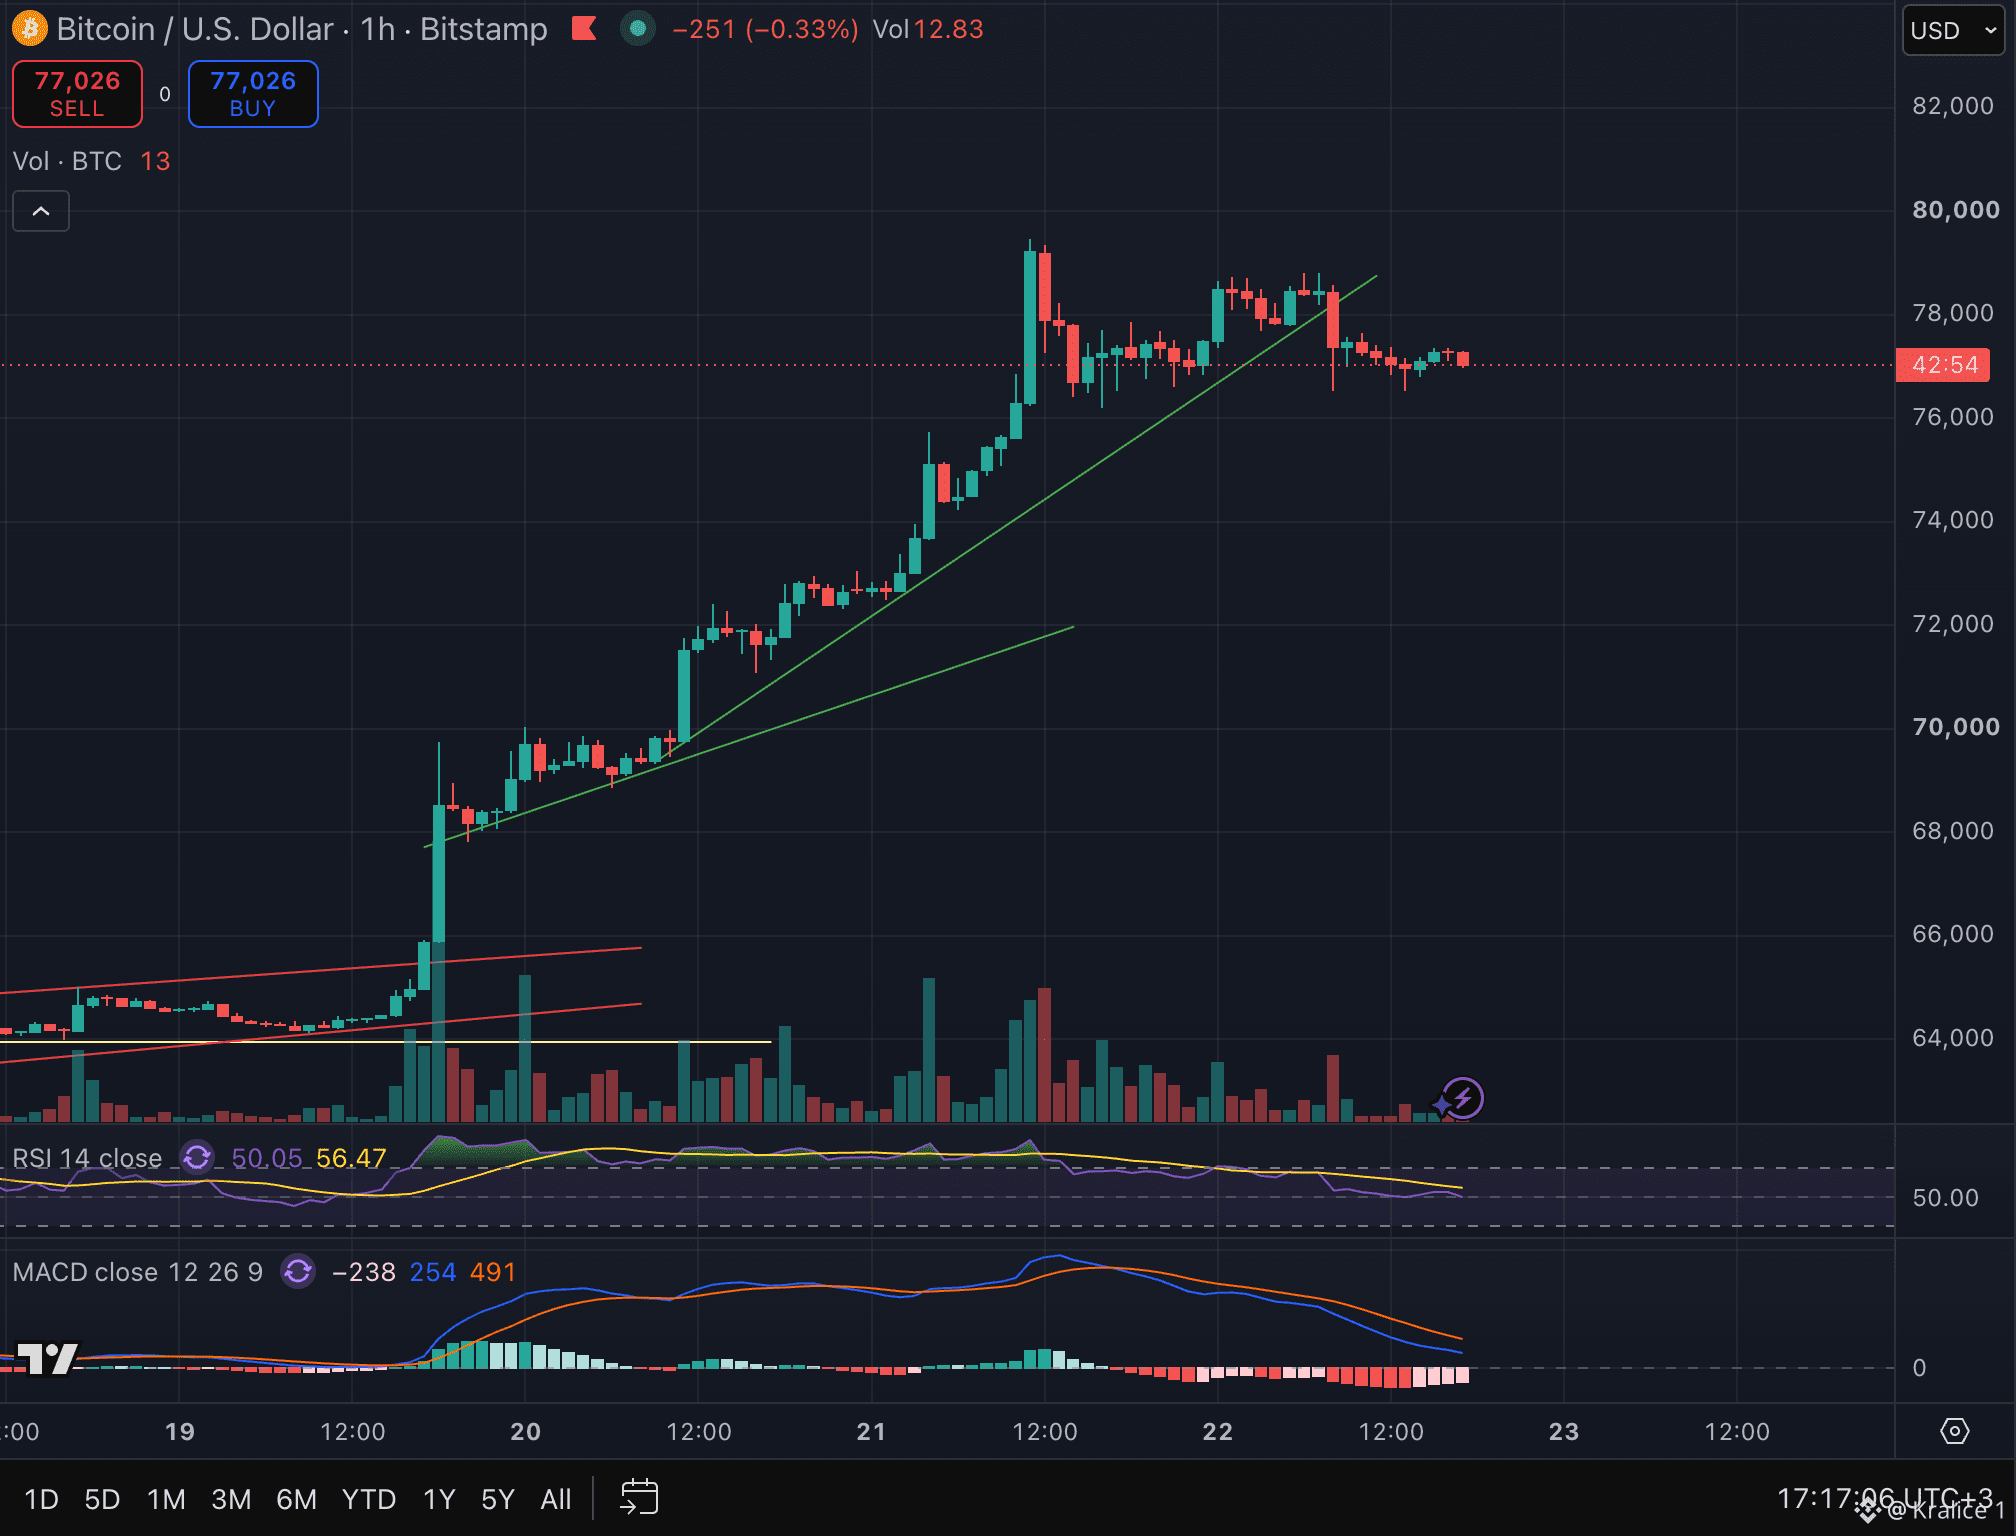
ATTENTION Today I’m Seeing Two Things in the Market at the Same Time: First, there is real demand behind the rally. About $800 million flowed into the $BTC and $ETH ETFs on their second day. The dollar is also weakening. These are seriously supportive for Bitcoin. Second, the market heated up very quickly. BTC broke above the daily and weekly 200 EMA zones with strong volume. The MACD supports the move. However, the daily RSI is around 85 and sentiment is still in the “Greed” zone. Therefore, even though I still see the direction as UP, we should be cautious here. 📈 If we look at US equities, they’re finding support today but are weak in the weekly table. So we can’t say “the money leaving stocks is coming into crypto.” The main forces carrying Bitcoin right now are ETF inflows, a weaker dollar, and the squeeze of previous short positions (short squeeze). $XRP has outperformed BTC and ETH this week. It may have higher upside percentage potential, but this kind of rally also implies a sharper move on the downside. In terms of risk-reward, my preference is still BTC. In summary, my direction is upward, but after such a steep move, a pullback coming in doesn’t invalidate the bullish thesis. Instead of chasing the move, I’ll wait for the support to be confirmed.
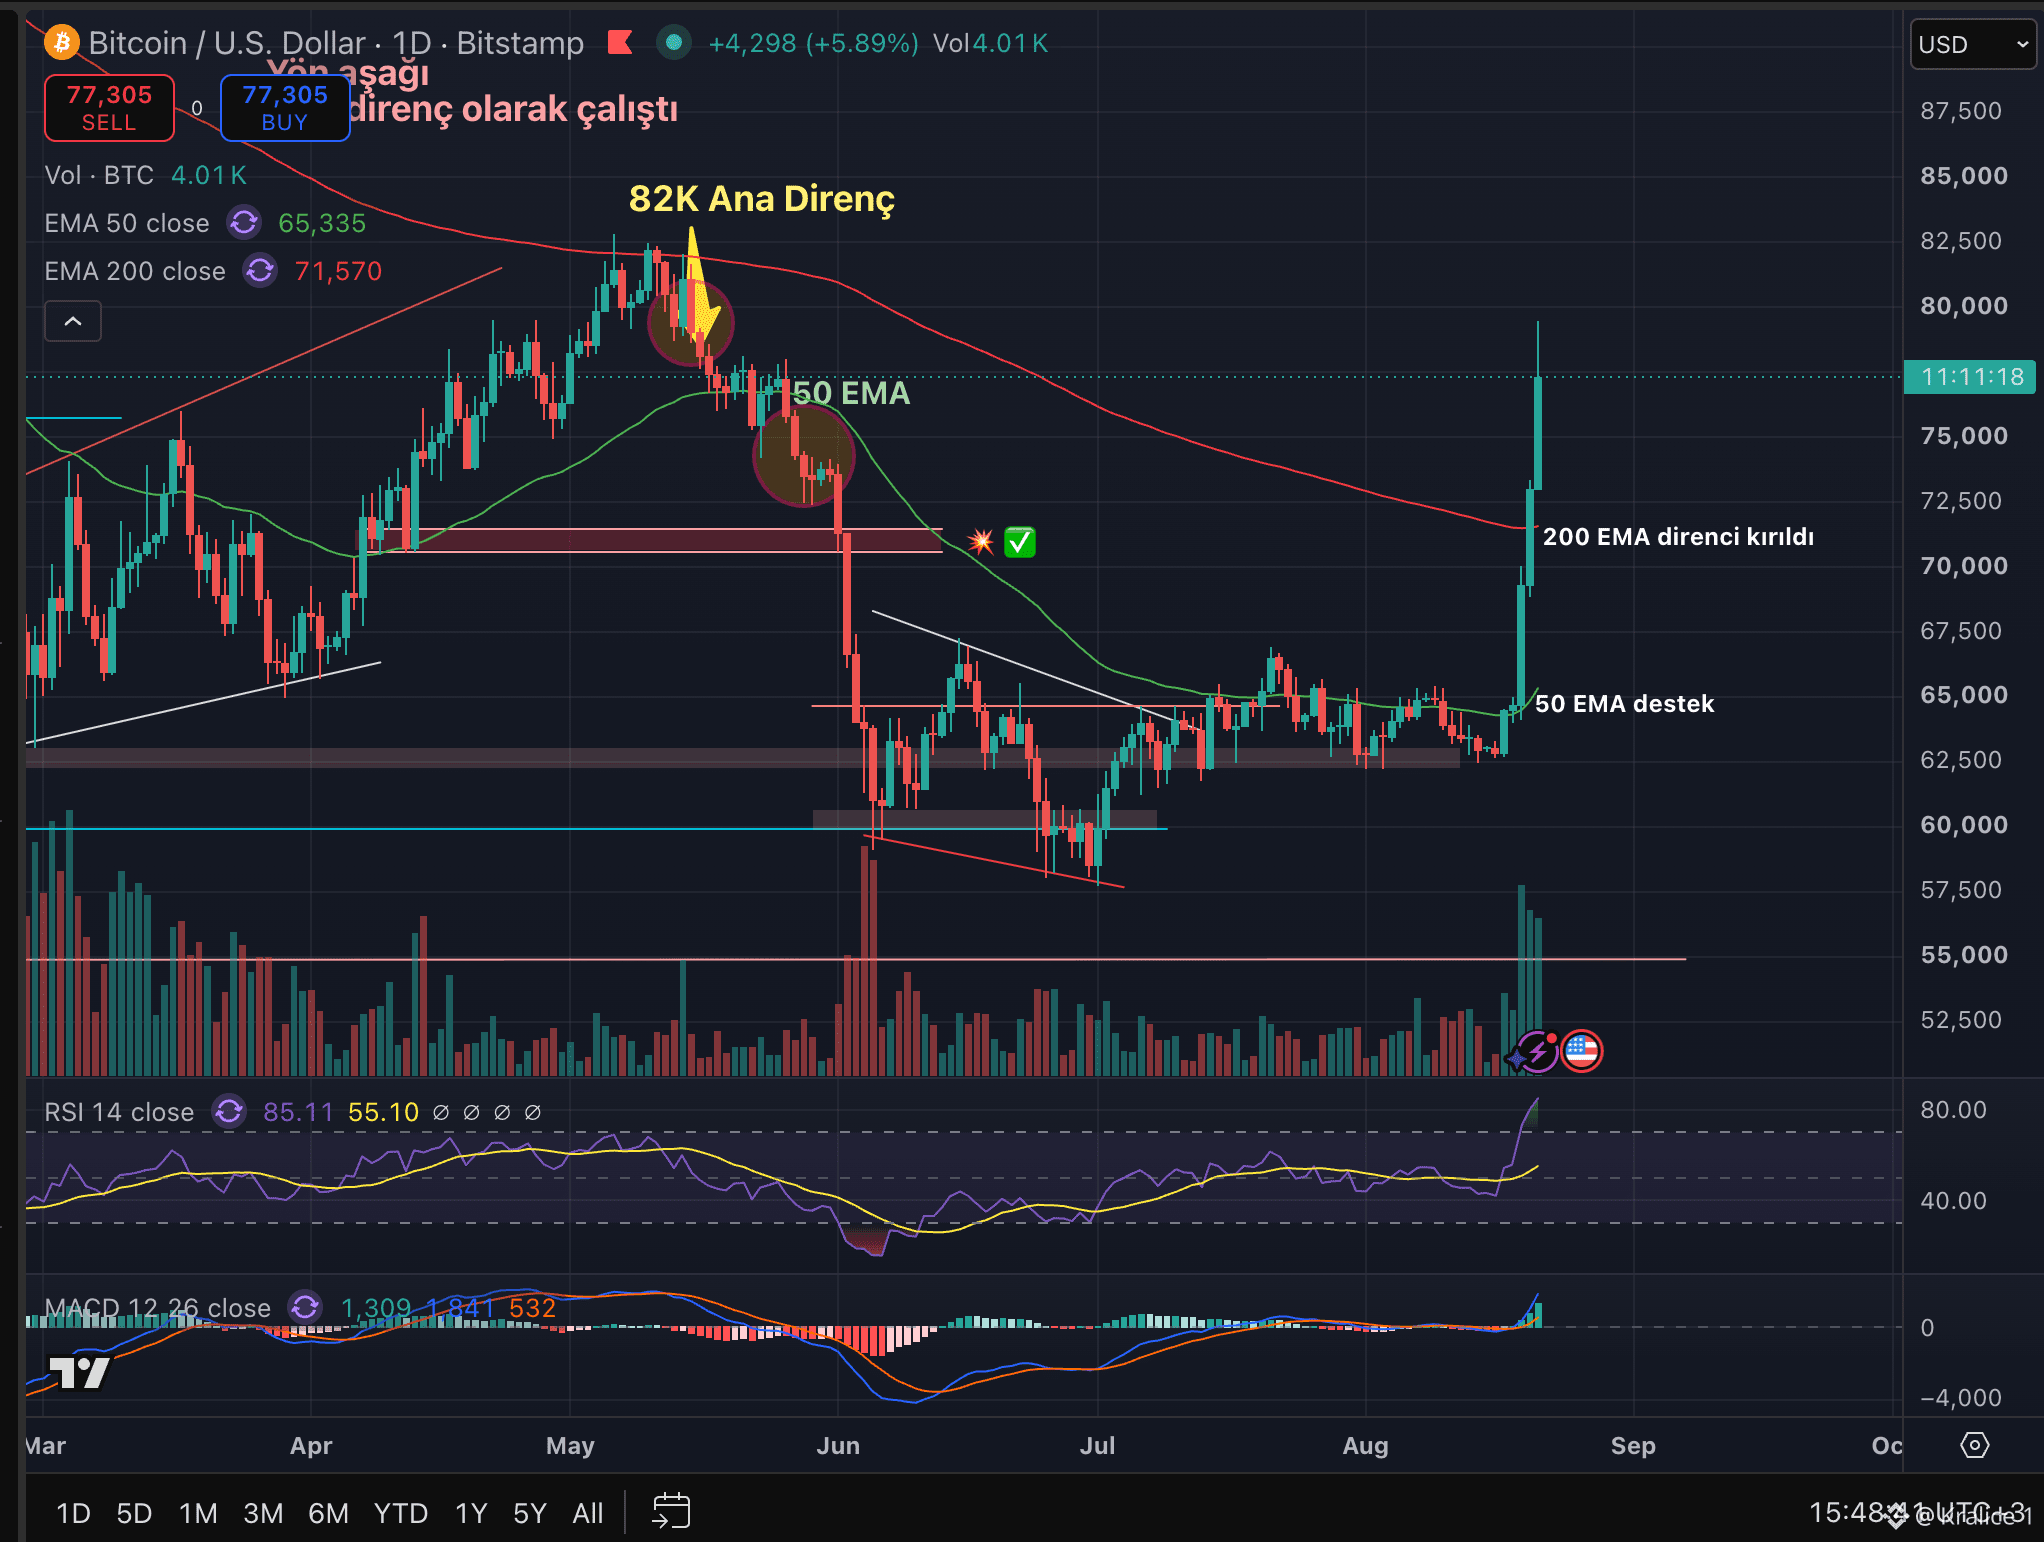
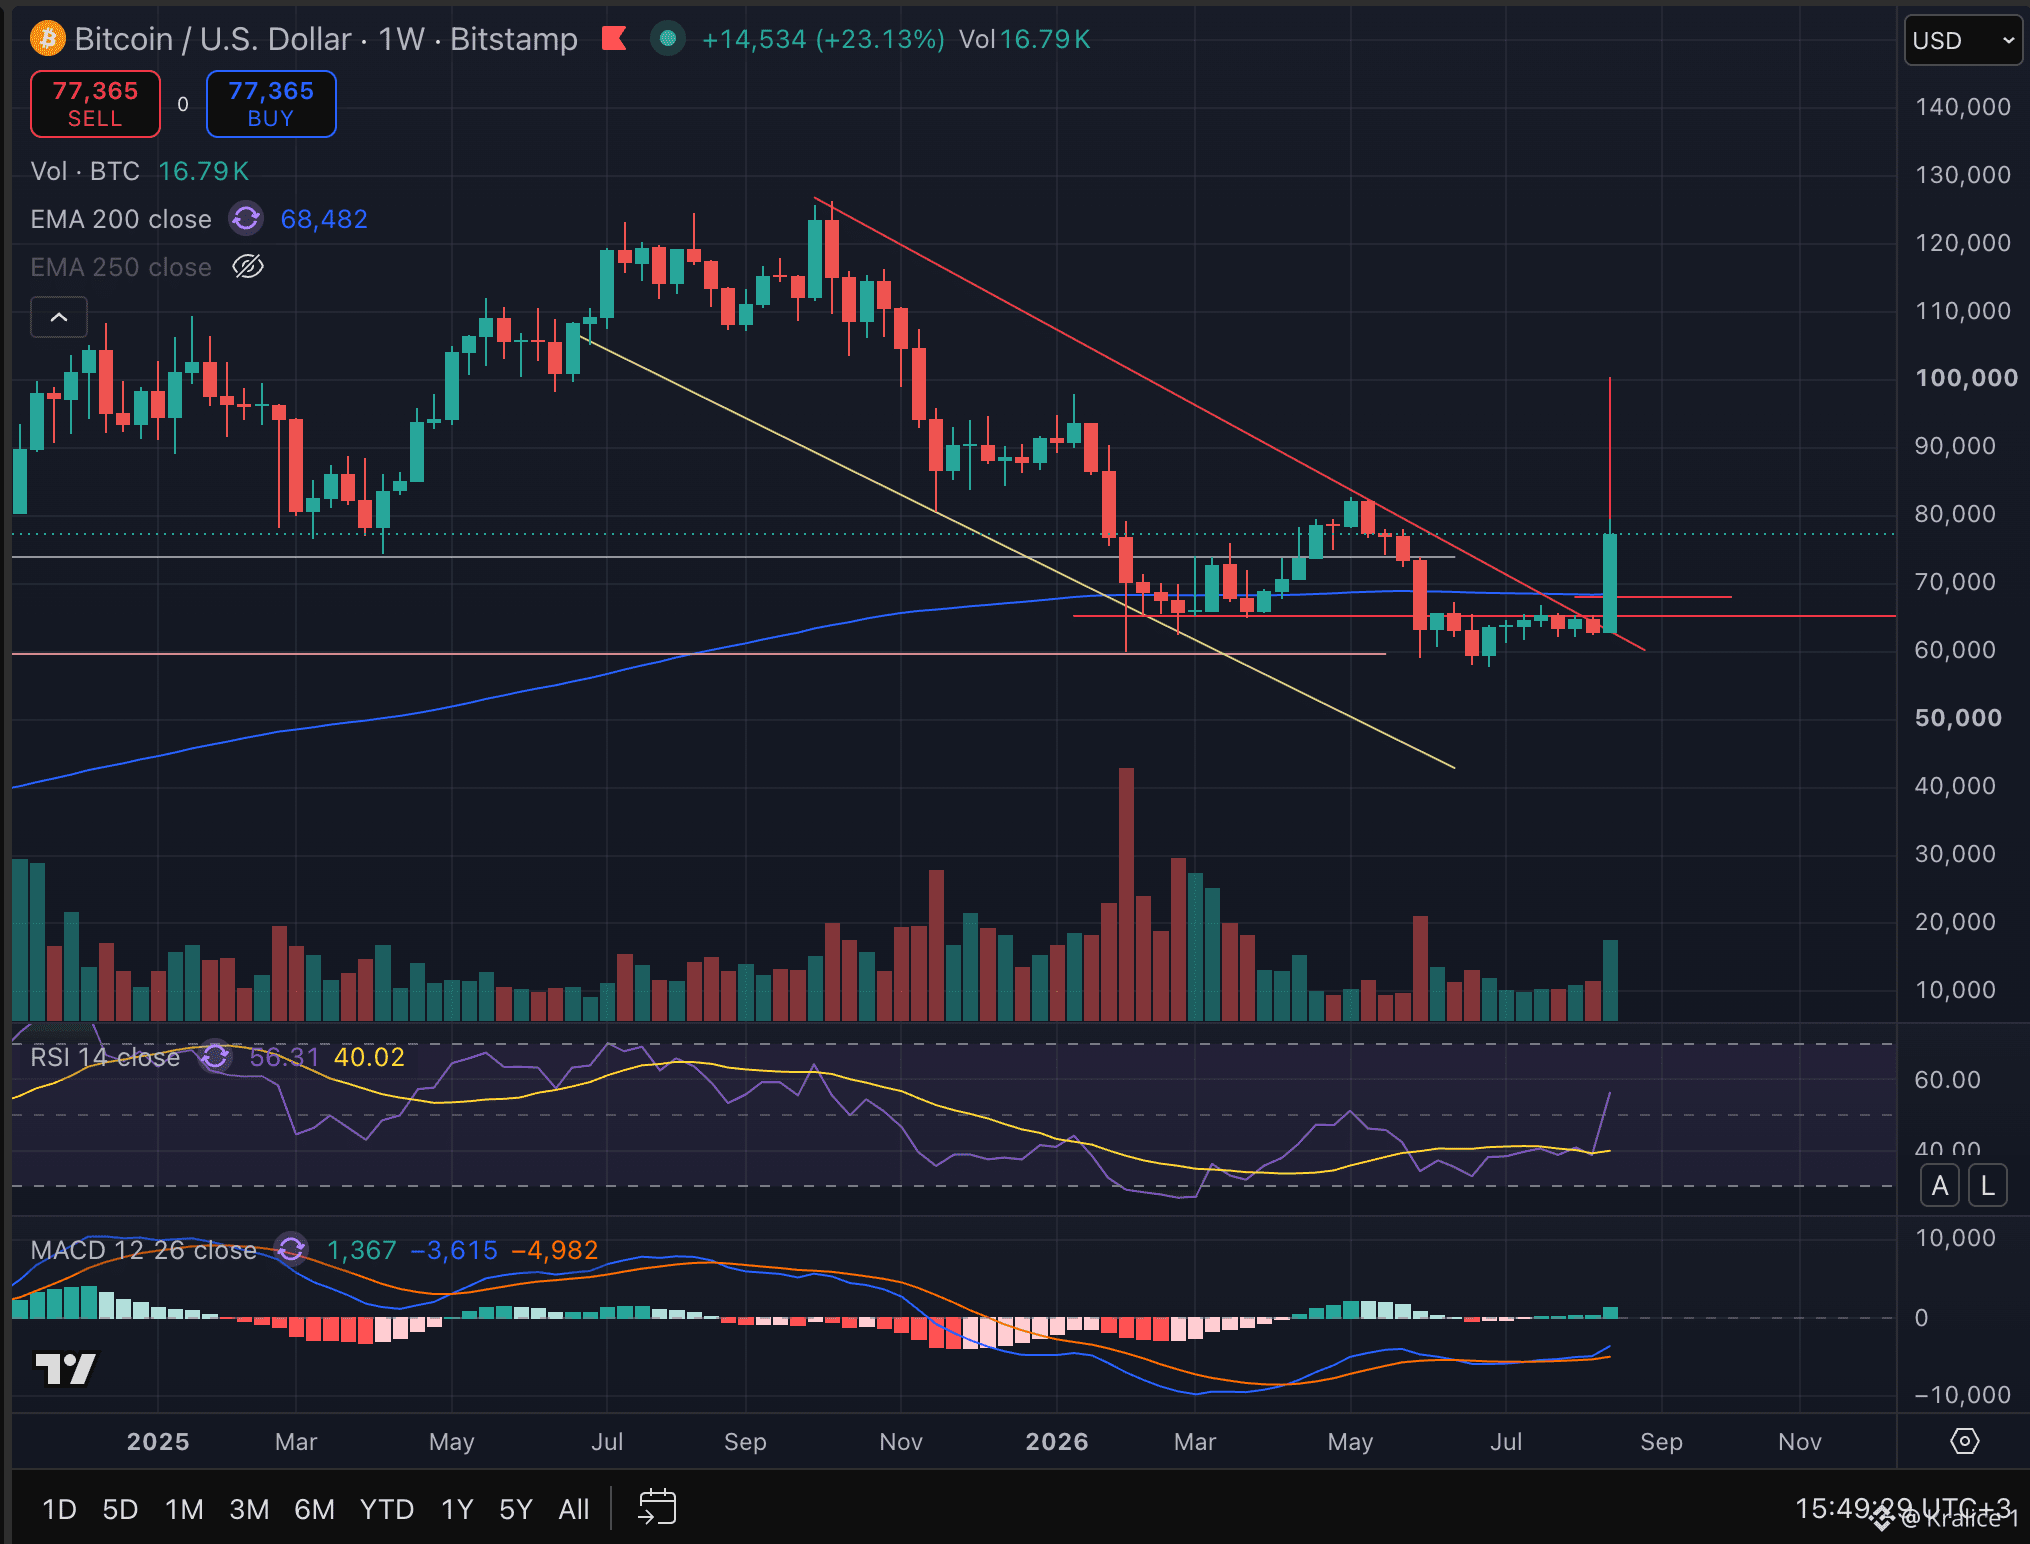
Bitcoin Is Soaring, But Is This Move Real? Several important developments have come together at the same time in the $BTC and altcoin rally—let’s take a look at them. ⤵️ 1⃣ The U.S. Treasury said it may increase bond buybacks. While bond prices rose, yields and the dollar fell. This created some relief on the liquidity side for Bitcoin and gold. 2⃣ $517 million flowed into spot BTC ETFs, and $189 million into ETH ETFs. In other words, it’s not just short covering (a short squeeze) in the market—there’s also real spot demand. 3⃣ Trump opened a political door to the idea that the U.S. could buy Bitcoin. No purchase has happened yet, but the market has started pricing in the possibility. 4⃣ On the weekly chart, the 200 EMA around $68,400 has been reclaimed. For me, this is the most important technical confirmation of today’s move. 💔 The FOMC minutes, however, were not actually positive. Three members wanted interest rate hikes, and if inflation stays high, they signaled renewed tightening. The market bought—instead of the Fed—falling bond yields, Treasury liquidity, and ETF demand. Now the key point is this: the move has gotten very steep, and Fear & Greed is back in the “Greed” zone. If $70,000 holds, I’m keeping my direction UP today as well. $80,000 could come within this month!
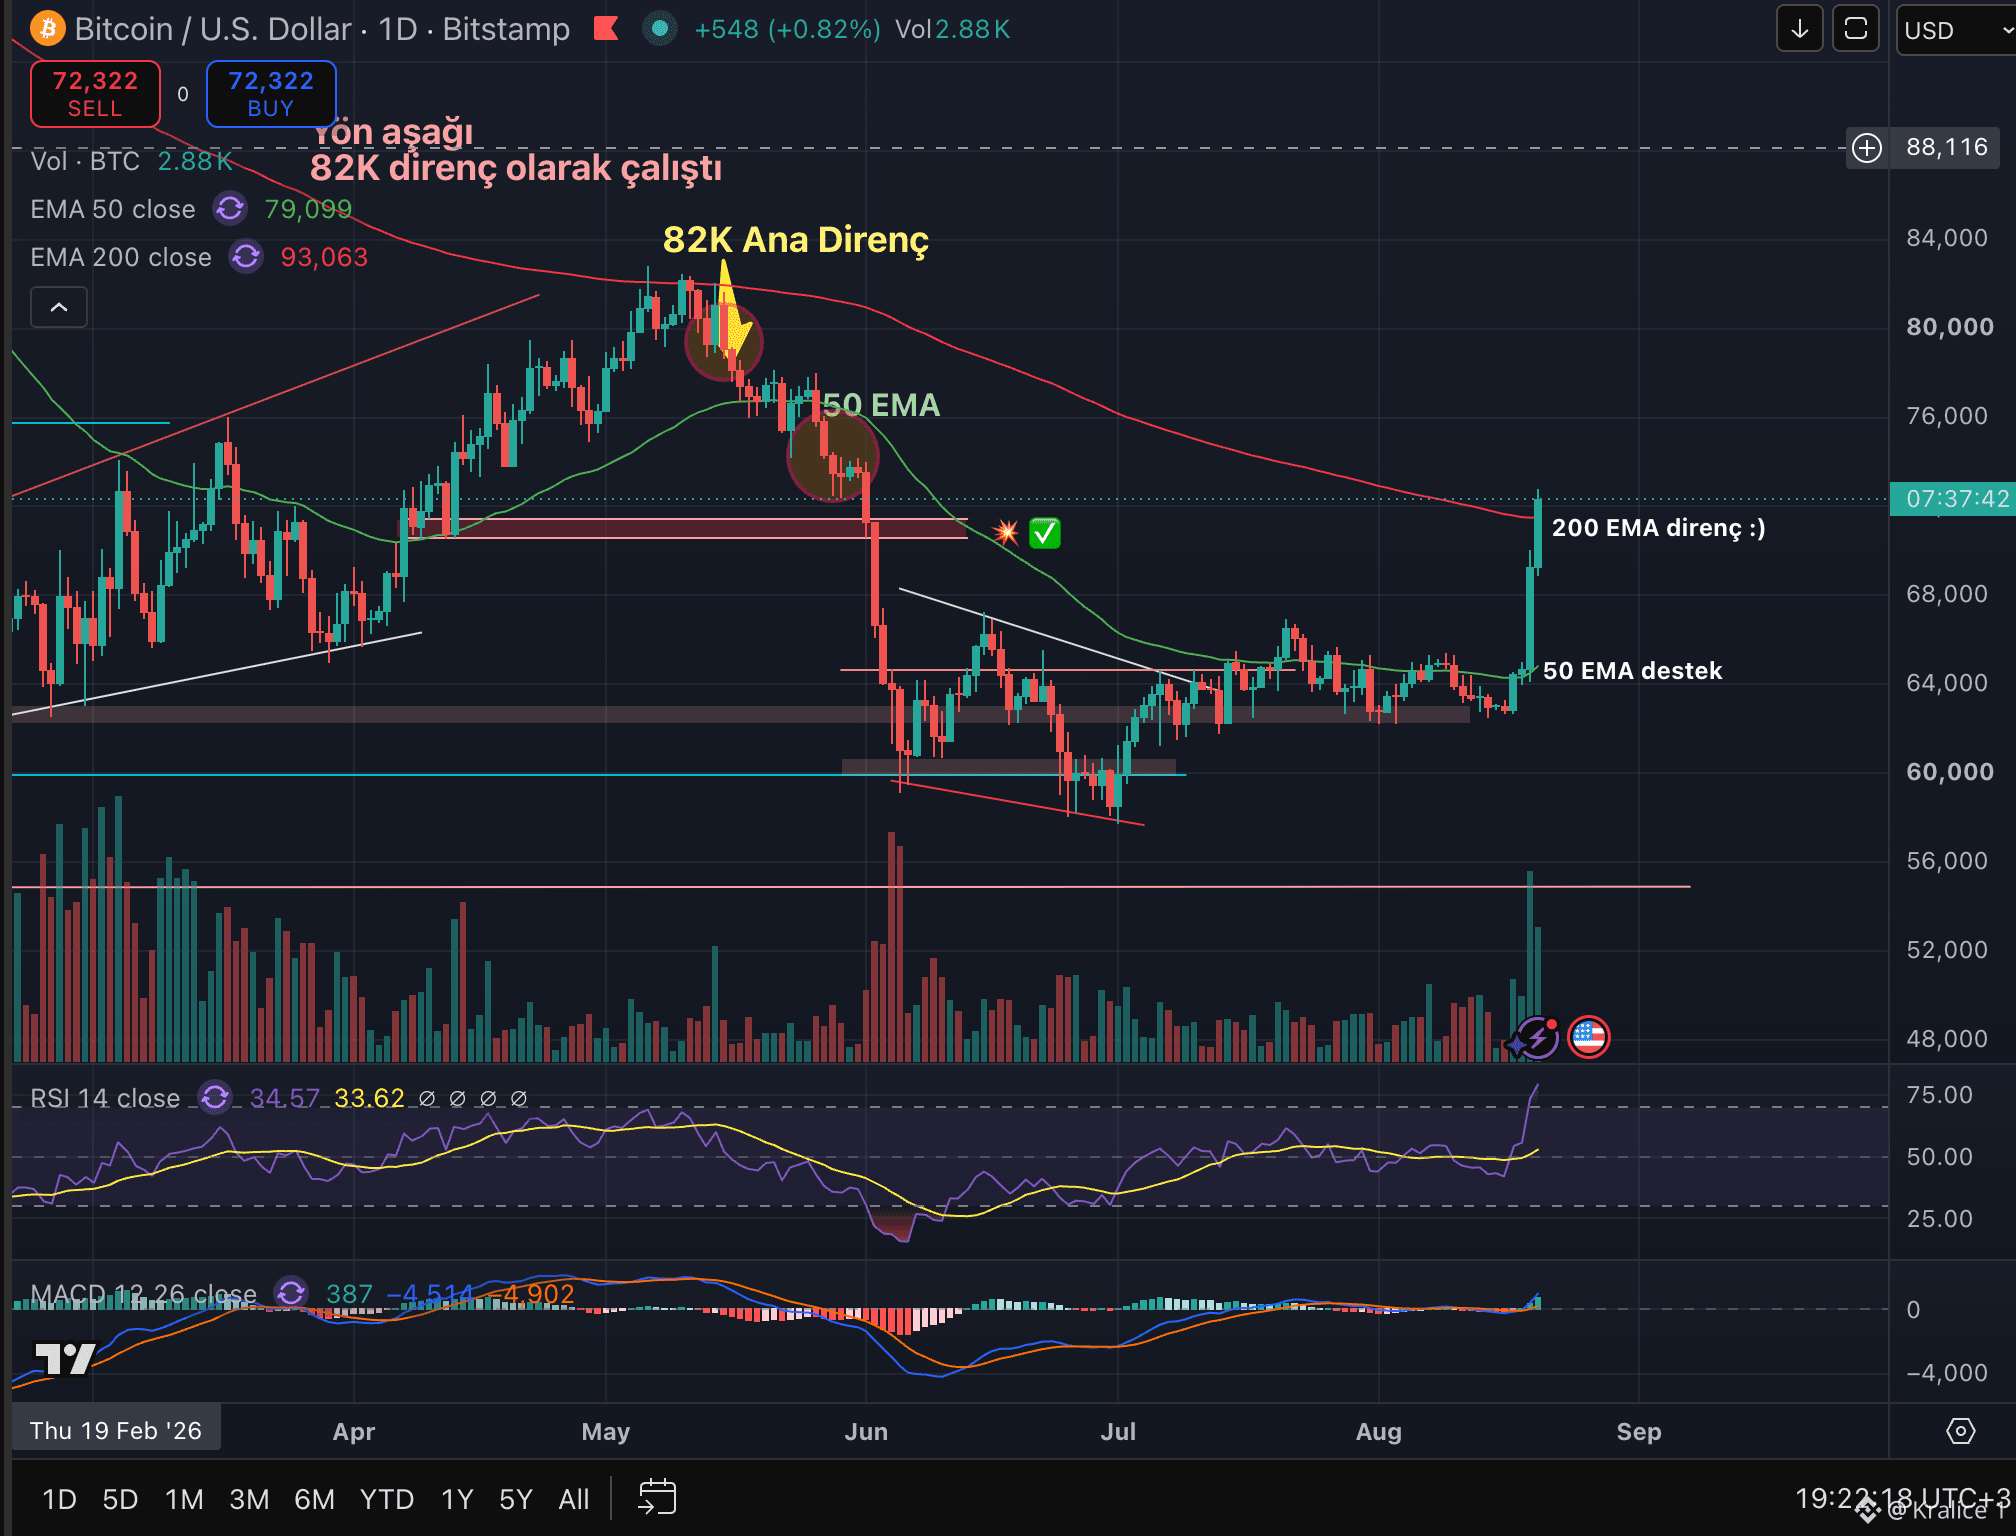
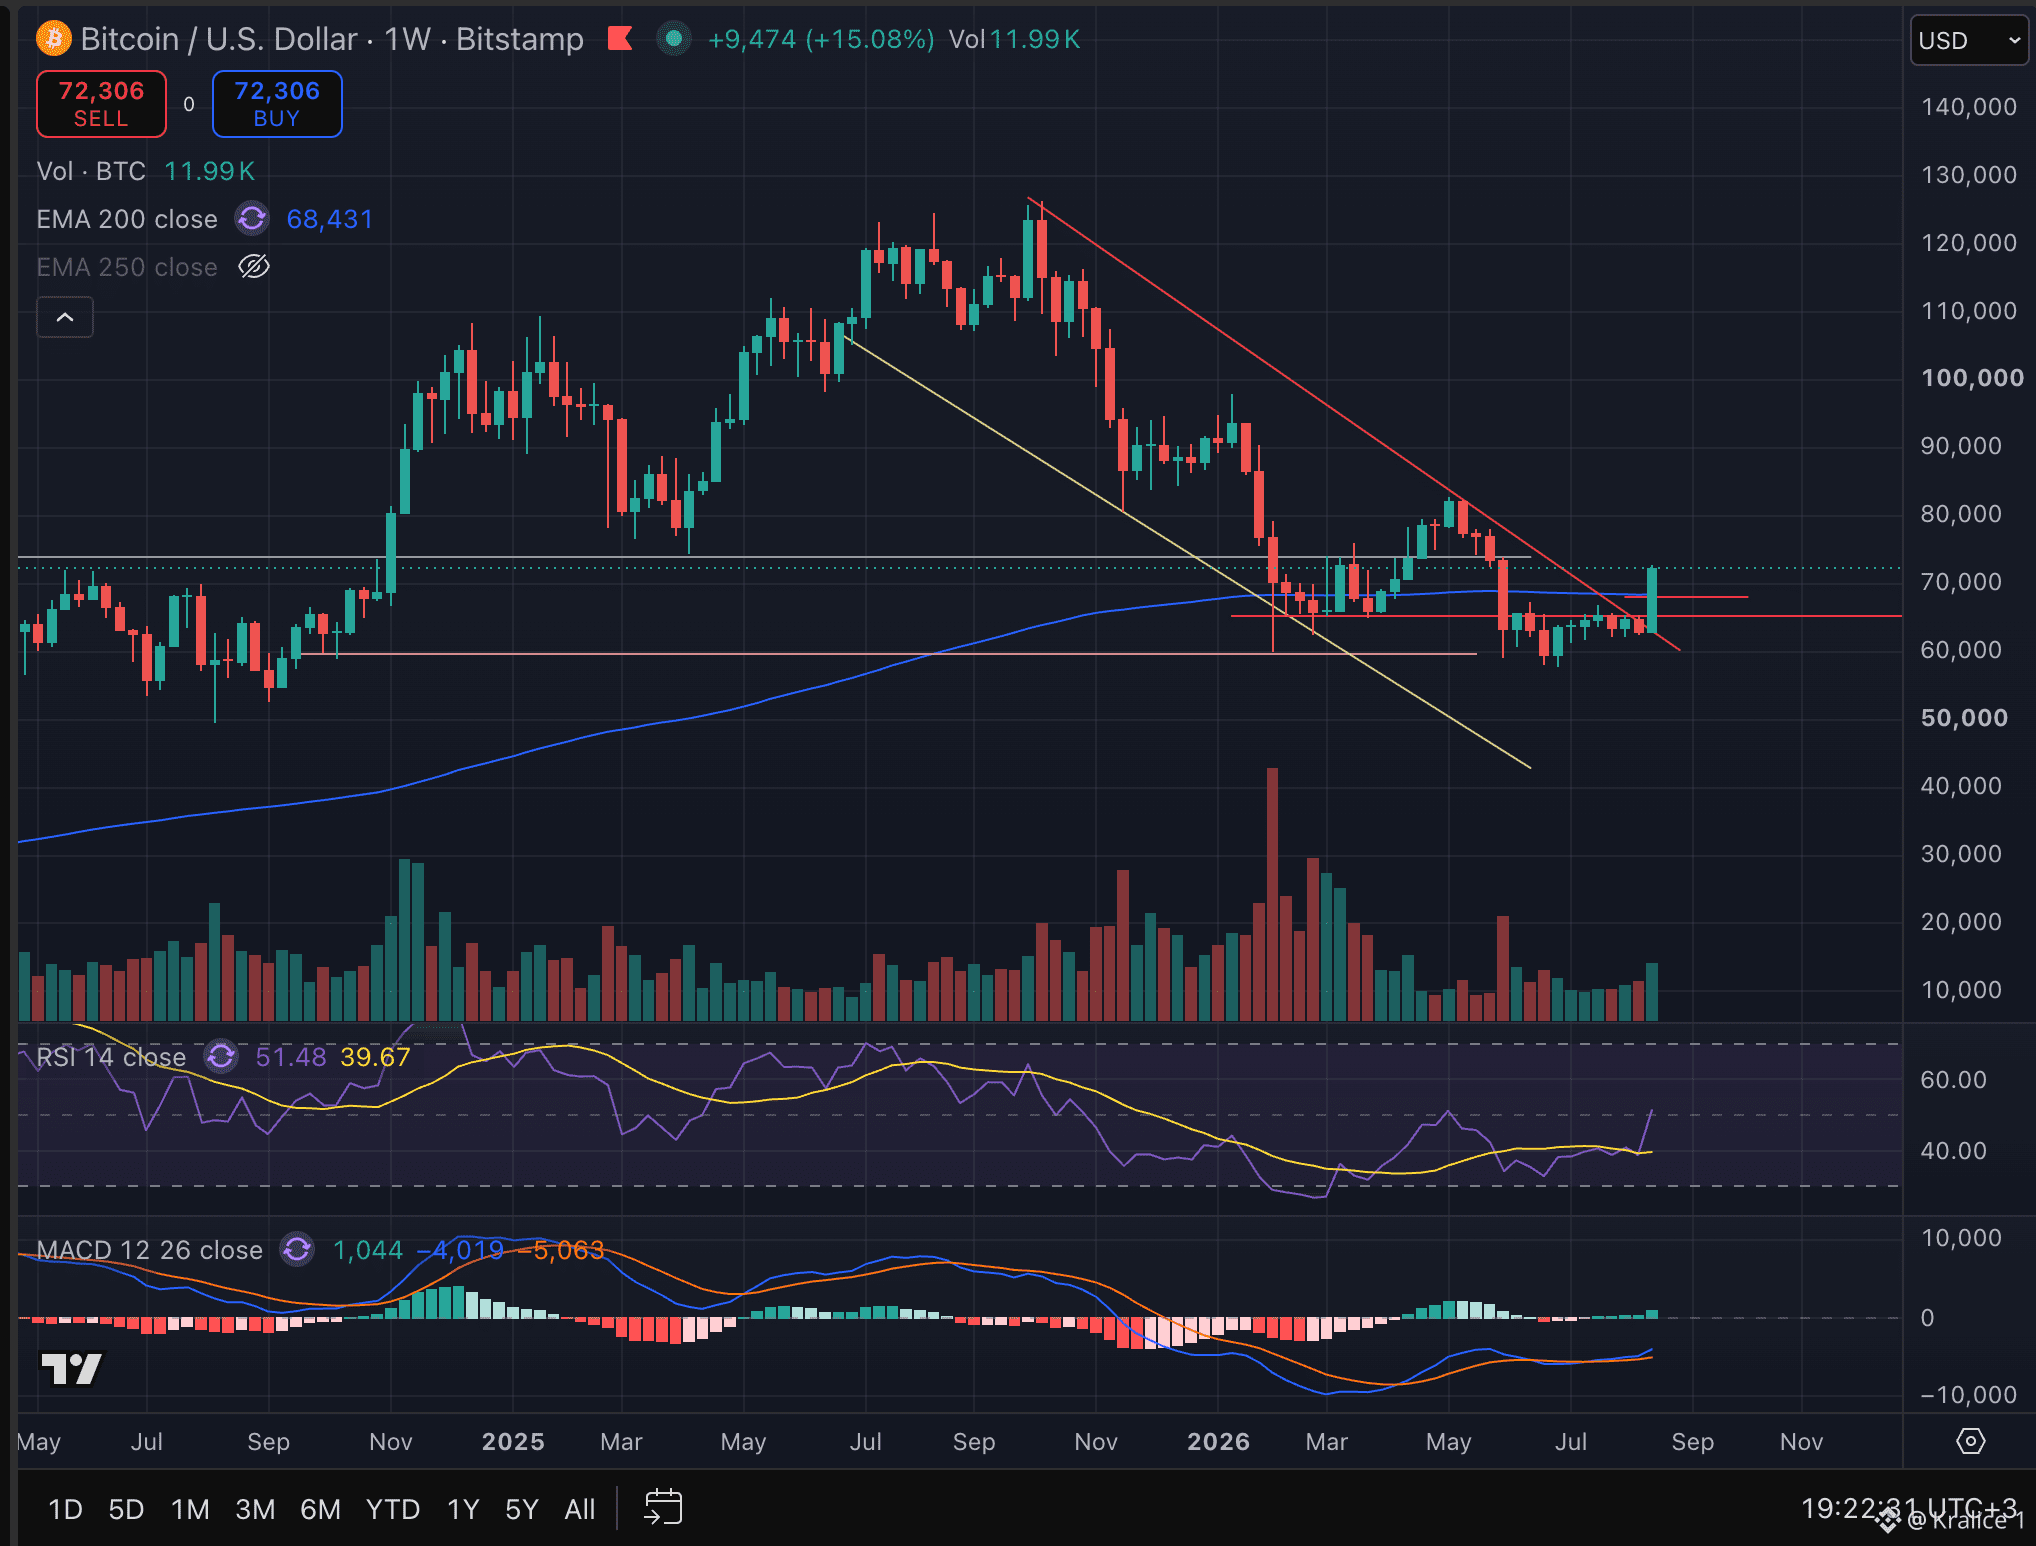
Let’s remember why I chose the direction upward yesterday as Bitcoin approached $70,000: • The daily 50 EMA had been reclaimed. • $BTC ETF flows turned positive. • RSI and MACD were recovering. • Short positions had become overly crowded. Today, this picture was triggered by Treasury buybacks. Risk appetite rose; stocks and Bitcoin were supported by the same liquidity wave. Then came a short liquidation of roughly $1.4 billion, and the forced buying accelerated the move. So the move shouldn’t be read only as “strong demand for Bitcoin.” Spot ETF demand prepared the ground, but the derivatives market amplified the speed of the move. The key level for me on the chart is around $68,400, where the weekly 200 EMA sits. If I see staying above it, I’ll take the $71,500 scenario seriously first, and then the $76,000 scenario. However, the daily RSI has reached about 70. I won’t chase with FOMO at this level. We did see a strong move, but after a short squeeze, profit-taking or a support retest is absolutely normal. My short-term bias is upward. My invalidation condition is the loss of $66,000 and the price turning back toward the daily 50 EMA. Tonight at 21:00, there are the FOMC minutes. The rally happened before the minutes; therefore, the Fed’s tone will either confirm the current move or create the first real test.
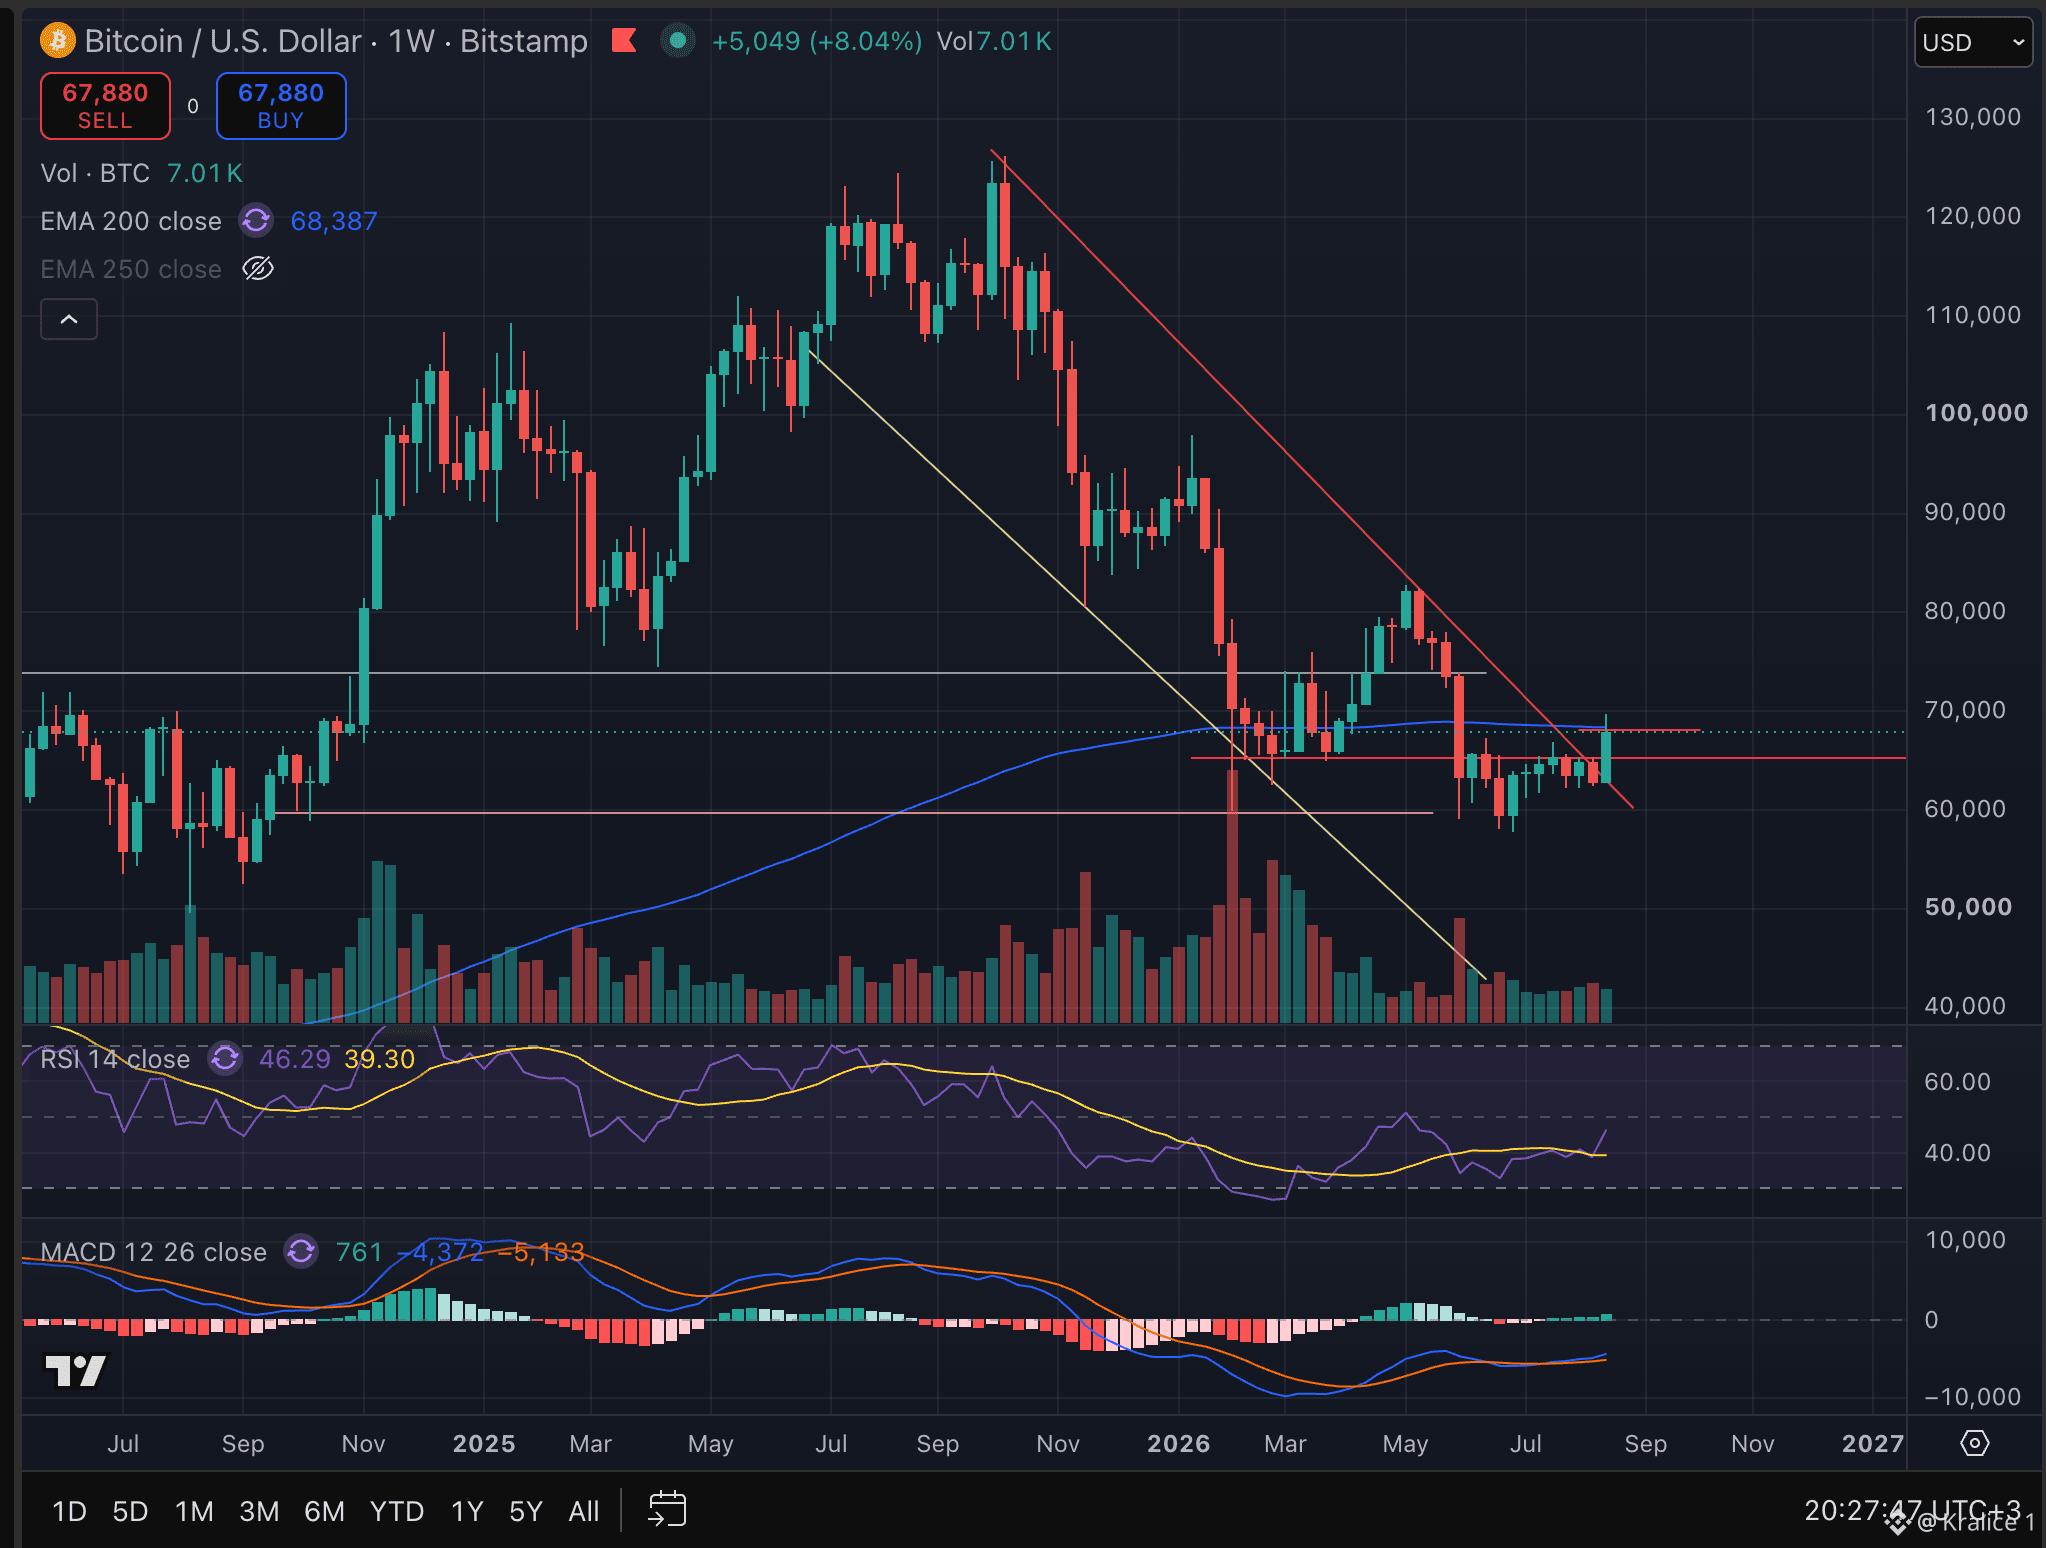
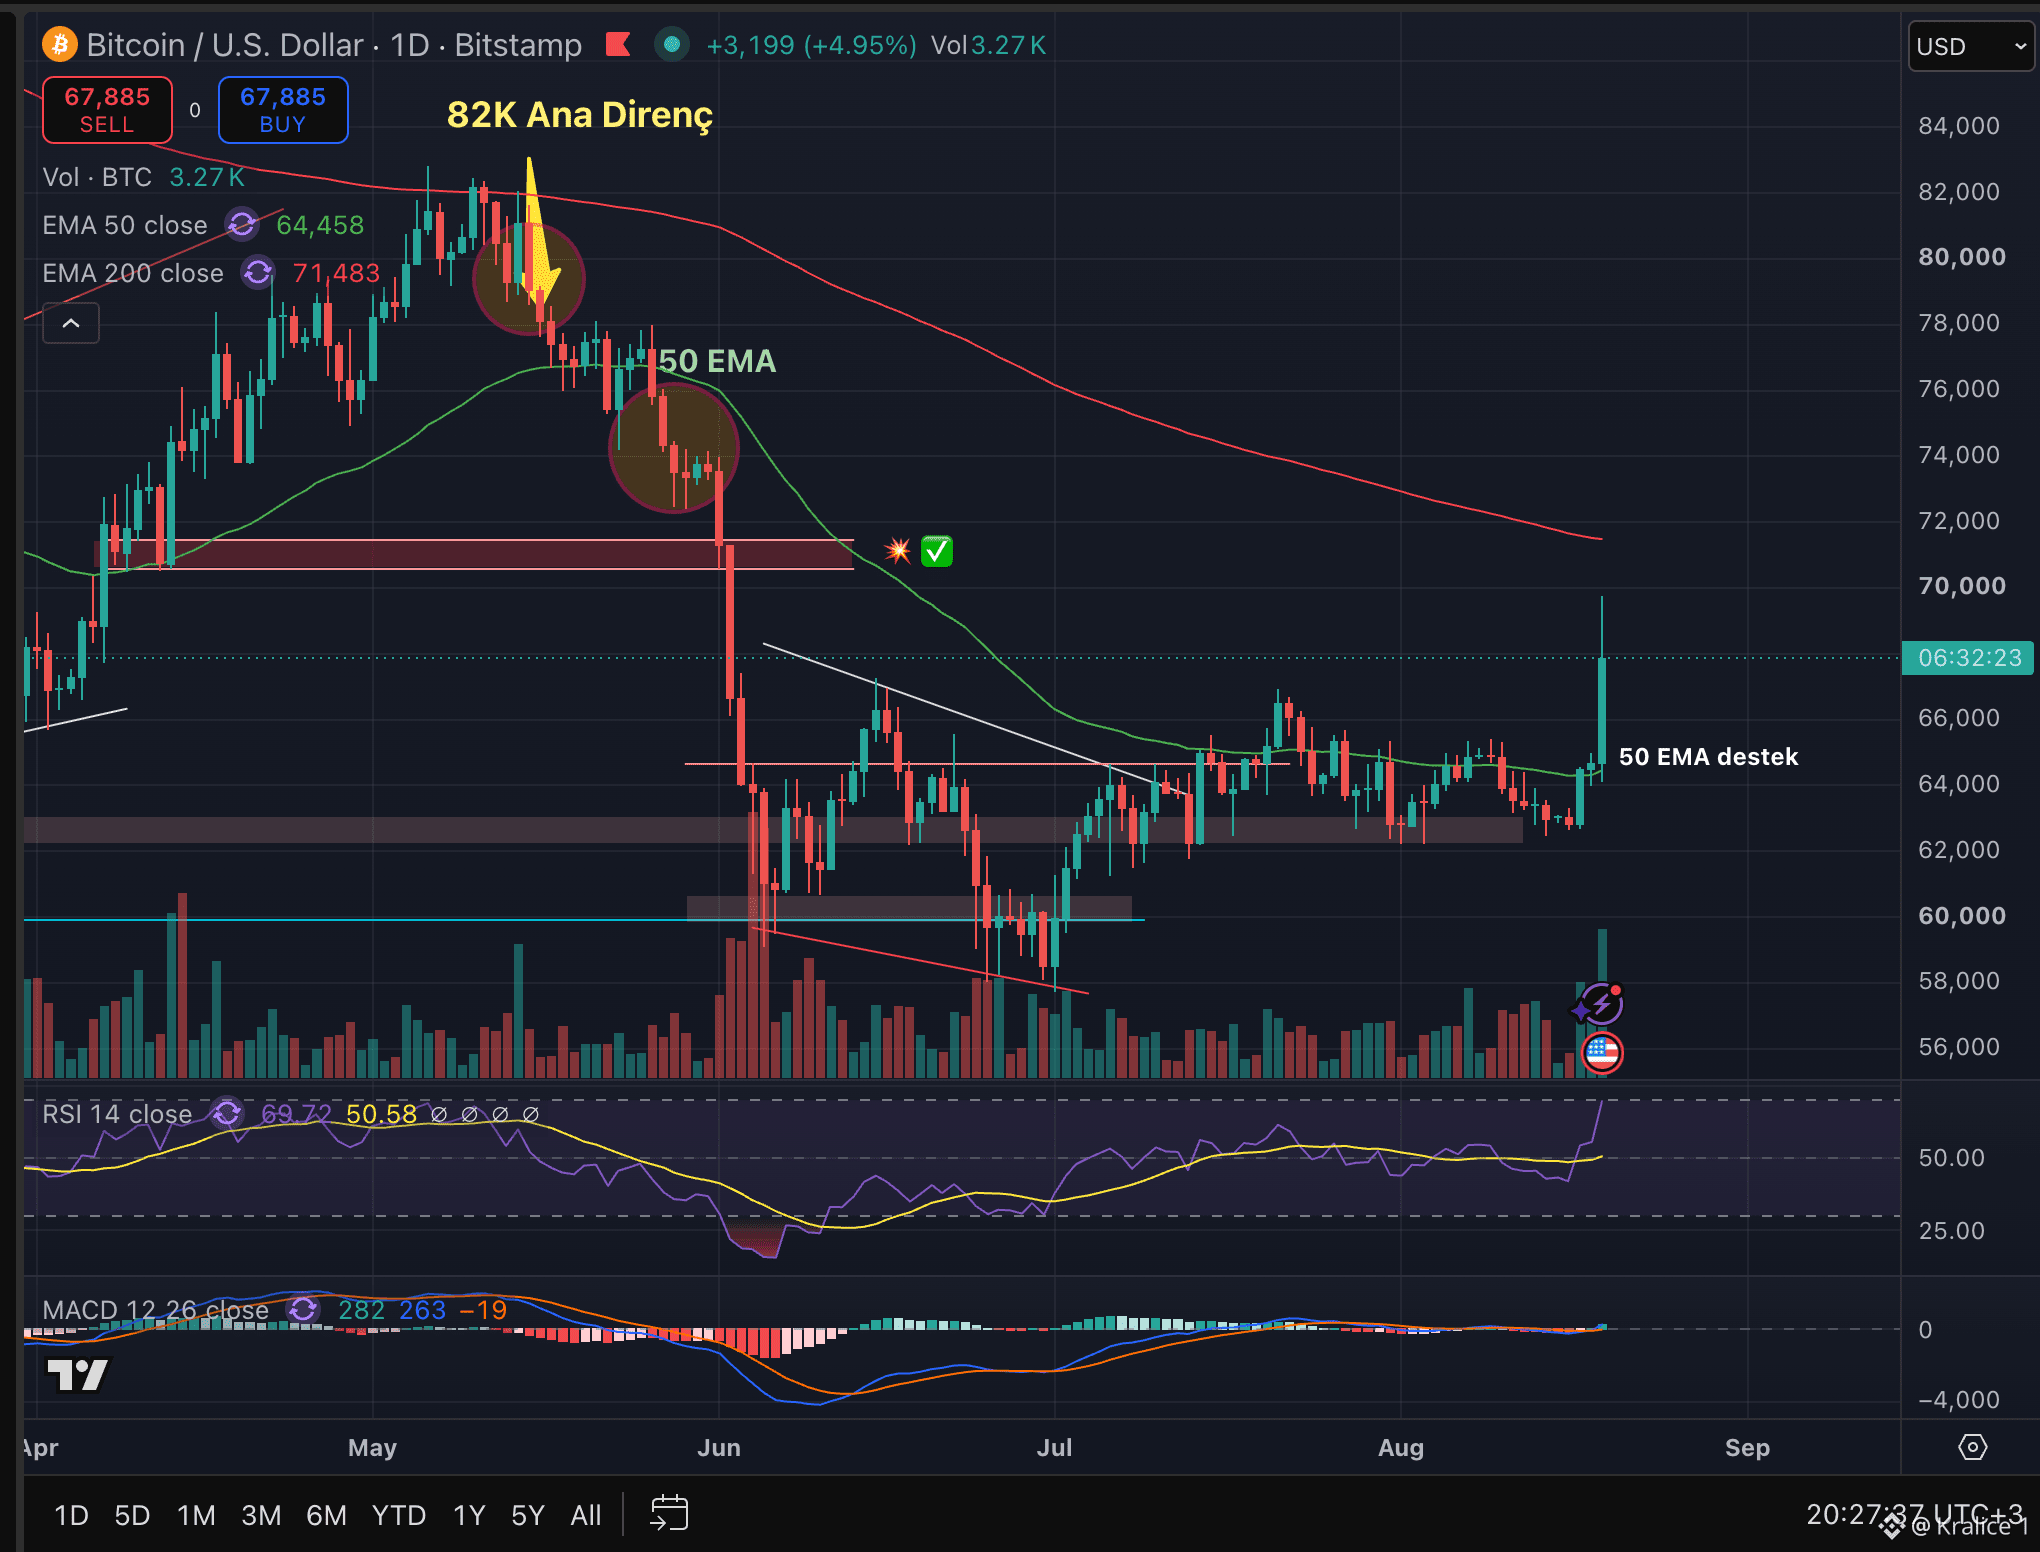
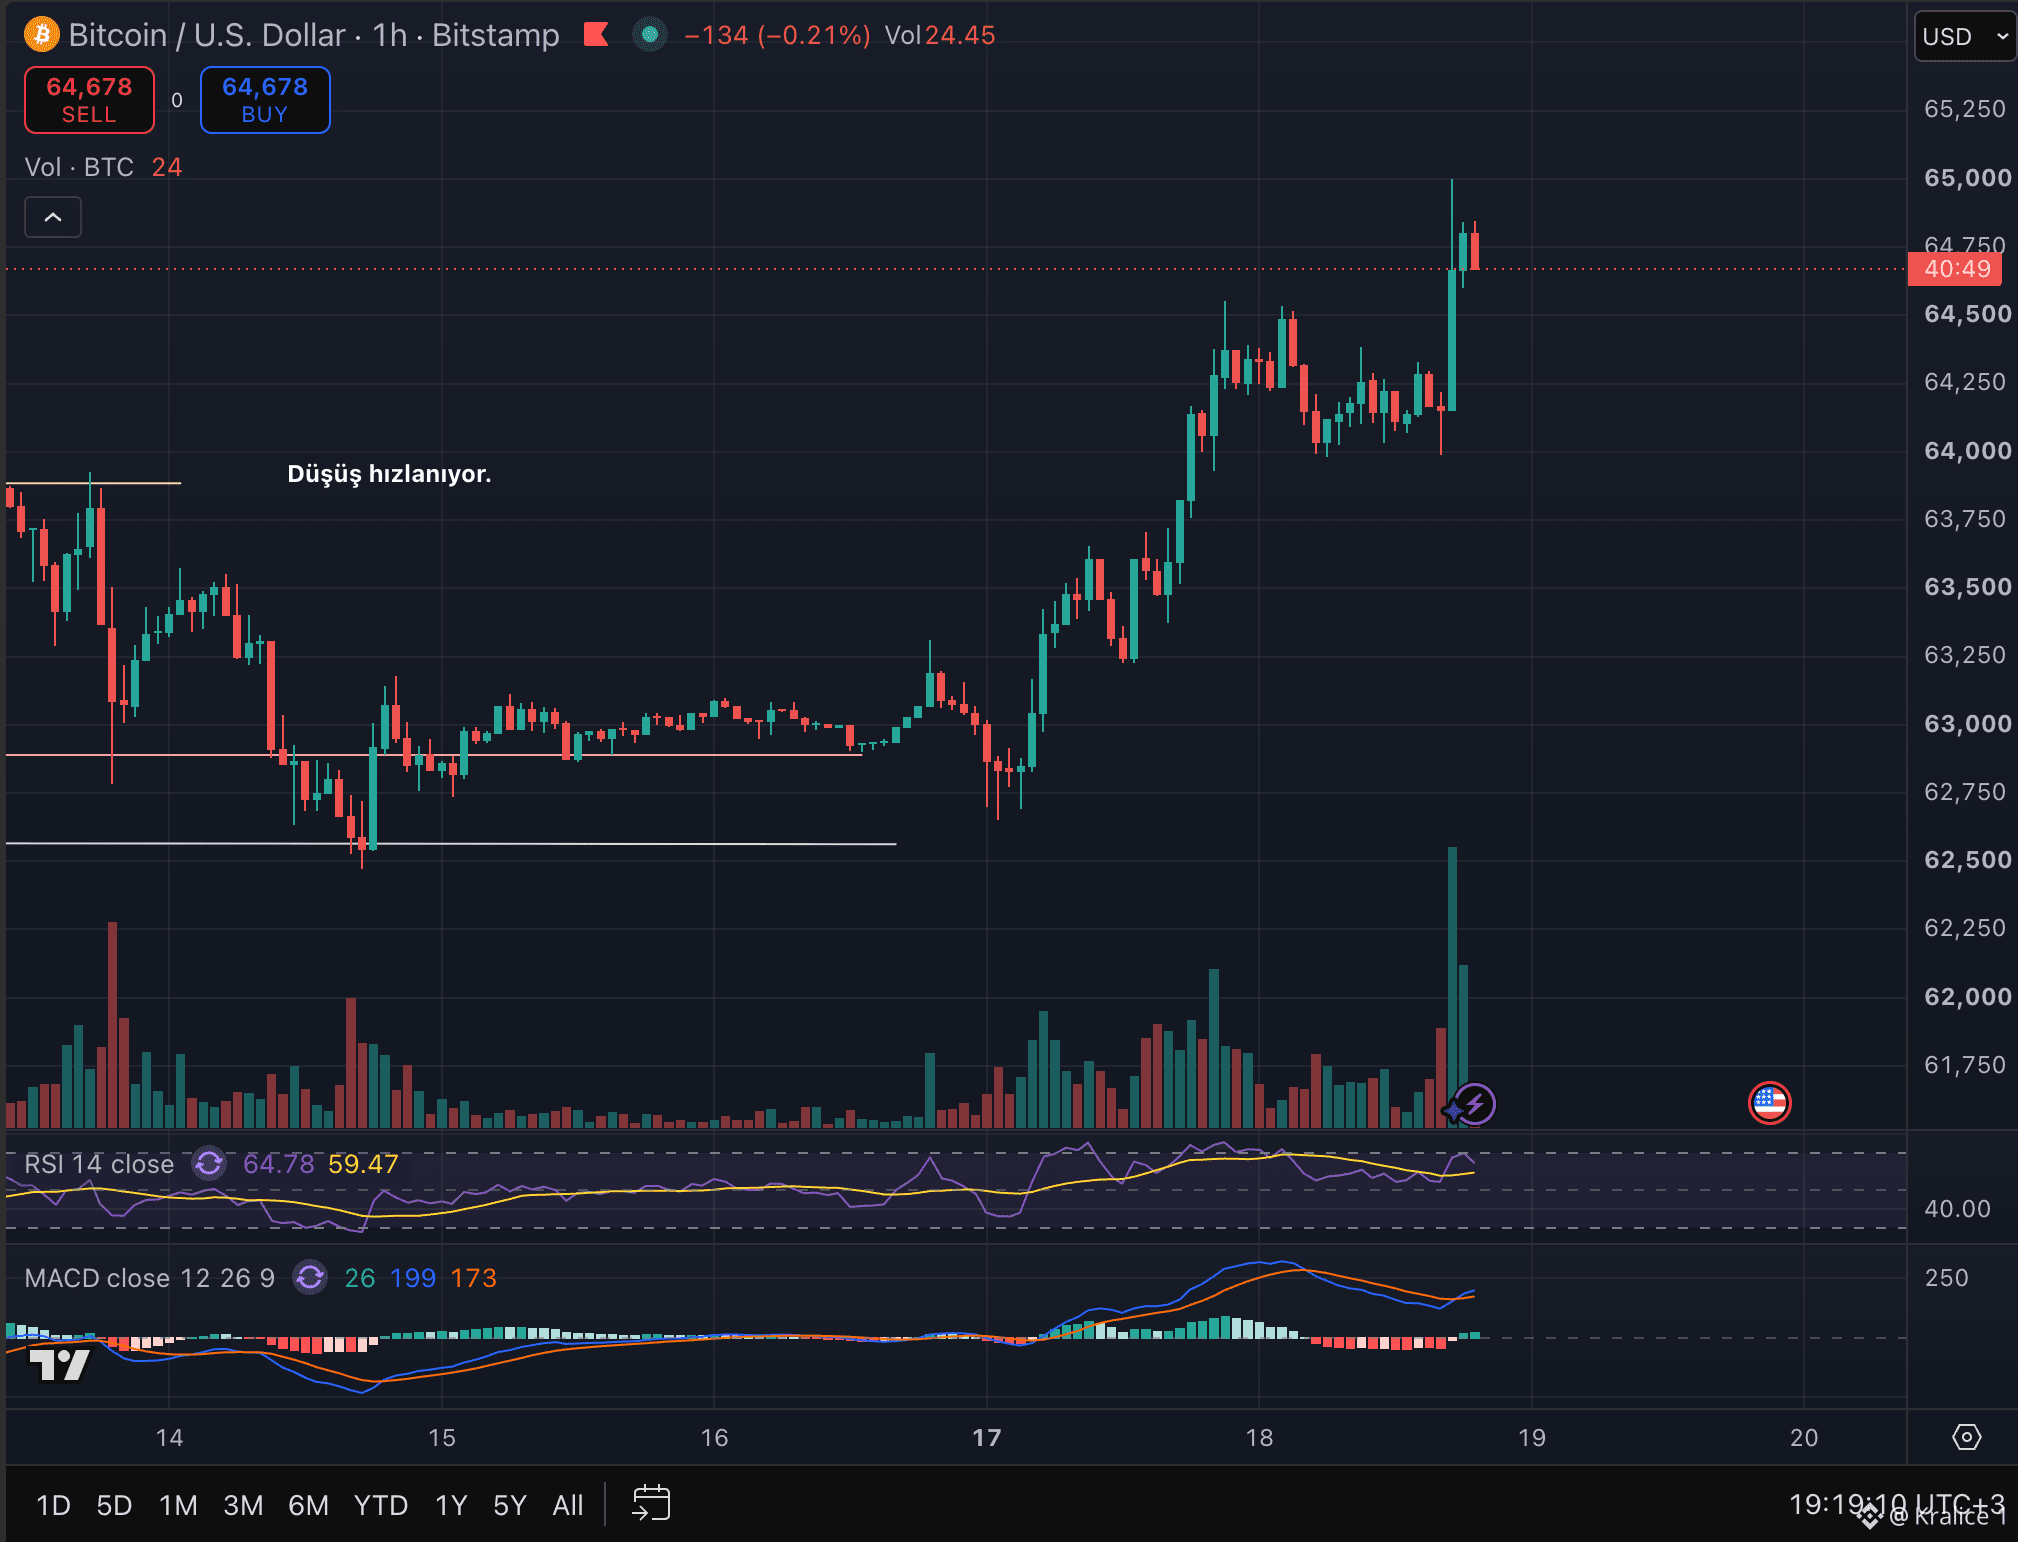
What Changed in Bitcoin Since the Weekend? Since the weekend, $BTC found buyers around the $62,500 mark. The first move started with low weekend liquidity, but the $131.1 million ETF inflow that came in on Monday added real spot demand behind the reaction. That’s why BTC moved back above $64,000 and started testing the daily 50 EMA. However, I can’t just look at green candles. The news flow isn’t positive :/ ⤵️ - Global bond yields are rising. - The U.S. 30-year yield is at a 19-year high. - Strategic oil reserves are at their lowest level since 1982. - Hormuz traffic is being significantly disrupted. - Oil risk could create inflation again and increase pressure from the Fed. So the weekend market priced in a technical rebound, while in the new week it priced in ETF demand. Now, it’s facing macro pressure again. 💚 In the chart, I view maintaining the $64,000–$64,200 zone as positive. If the $65,000–$65,400 range is broken, the next major test would be around $68,300, where the weekly 200 EMA is. 💔 But if $64,000 is lost, $63,200 and then $62,500 come back into focus. It’s important to maintain BlackRock’s long-term thesis, but this isn’t the direct reason for today’s move. A single day of ETF inflows alone can’t prove a trend reversal.
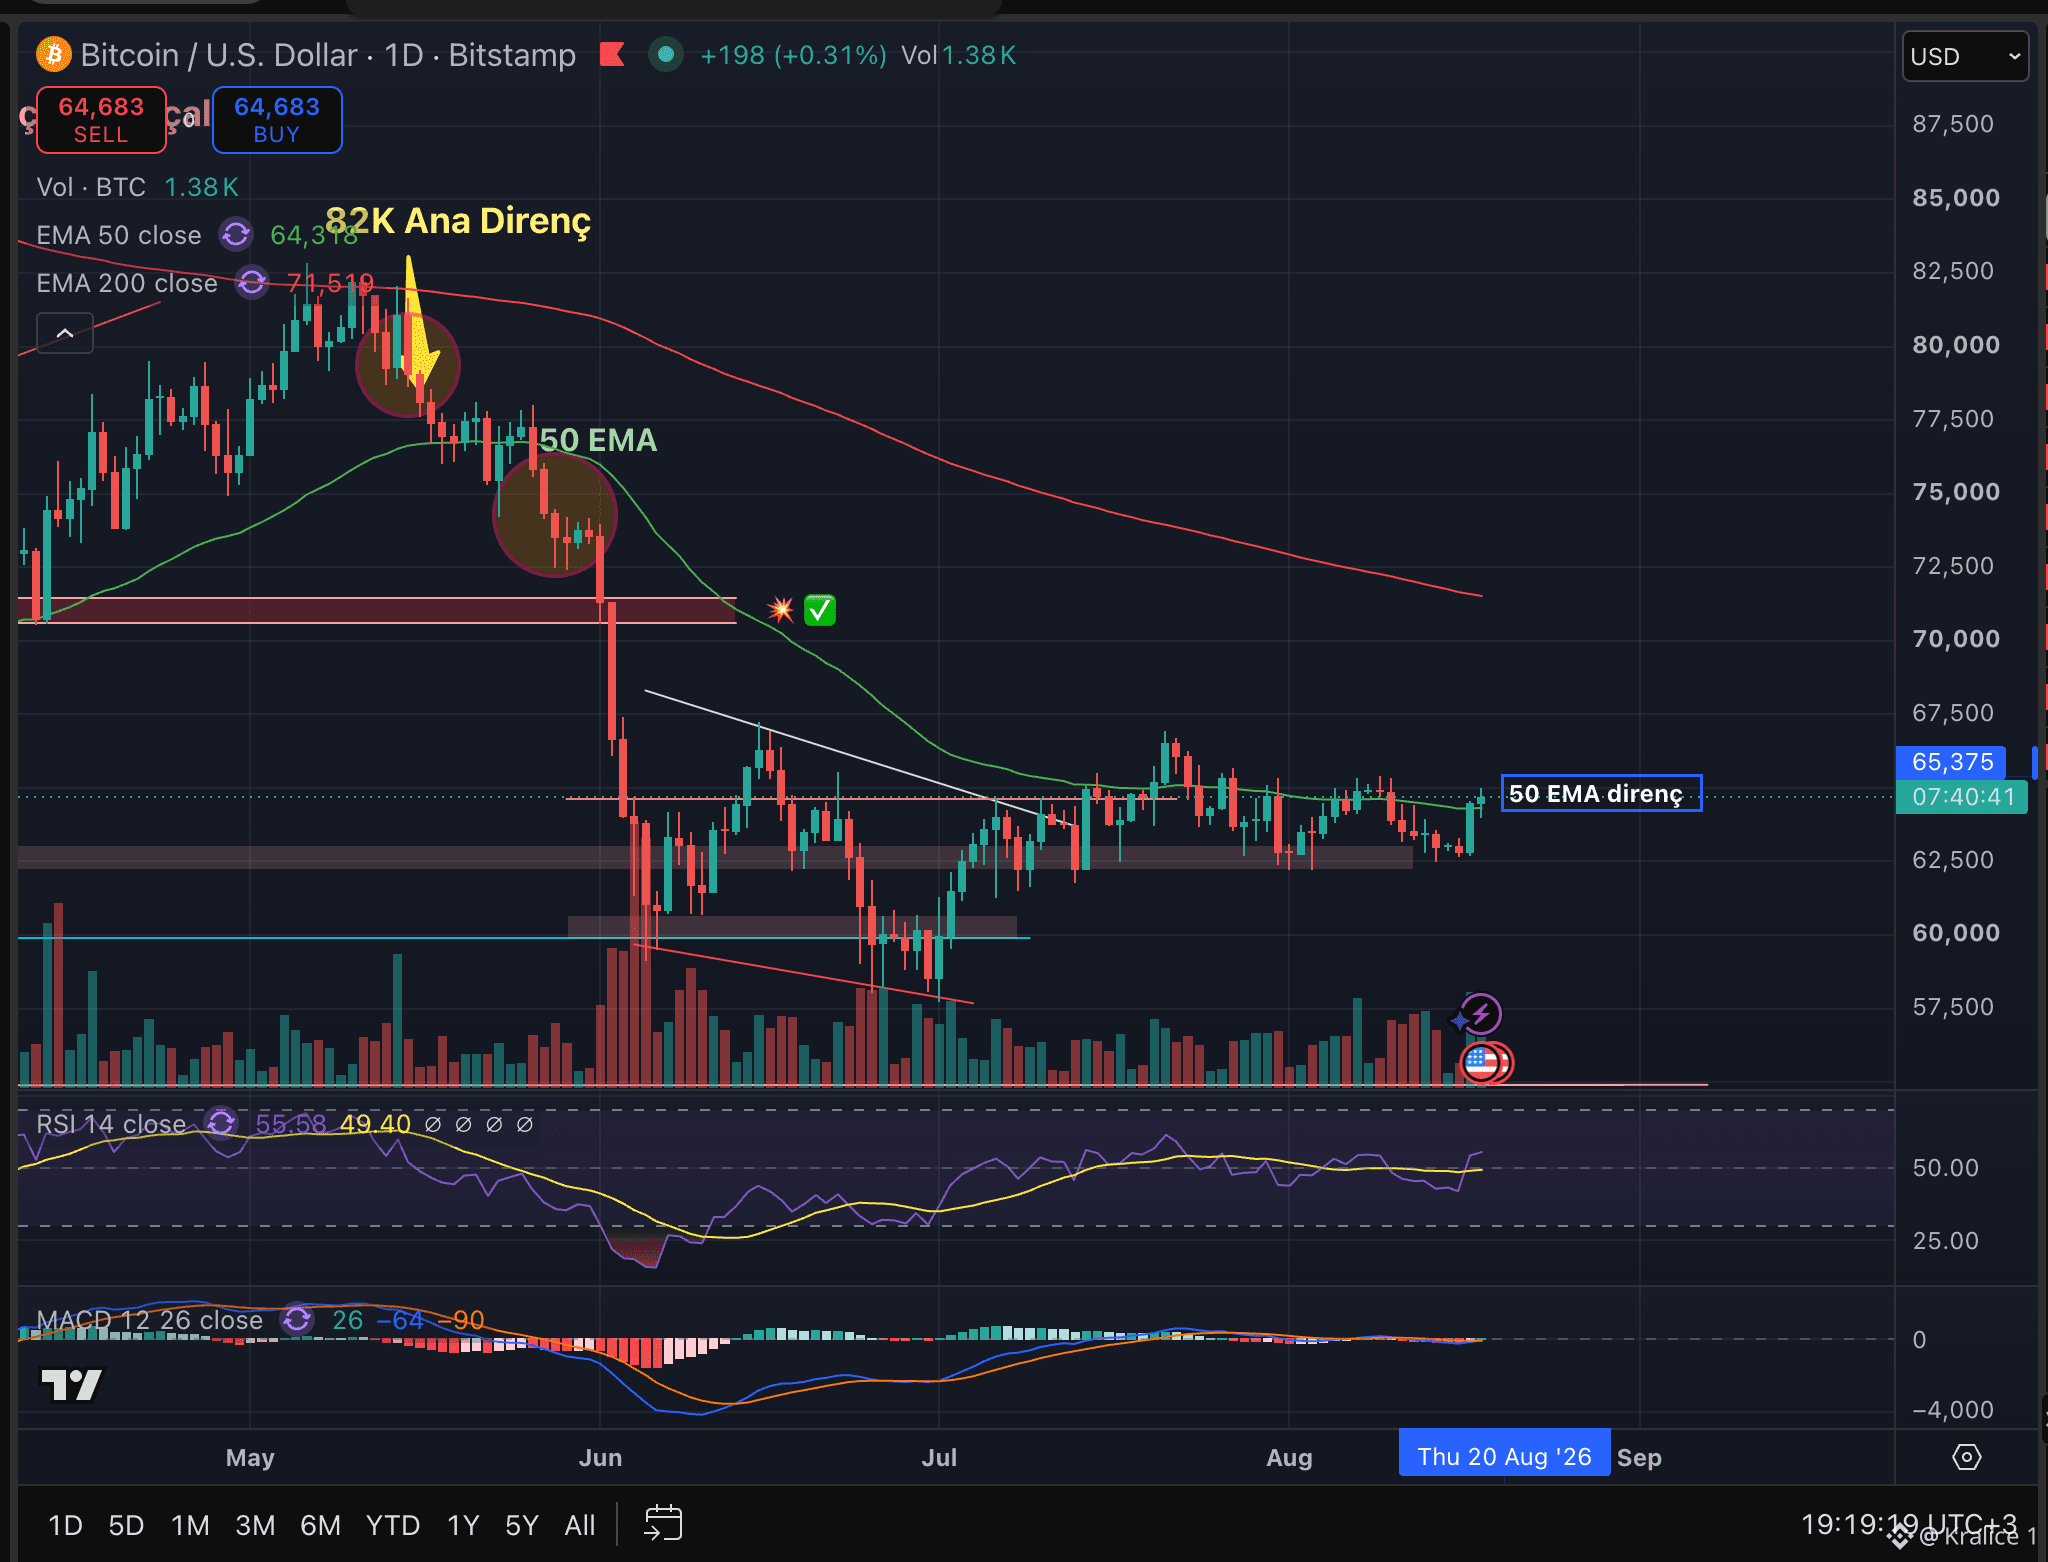
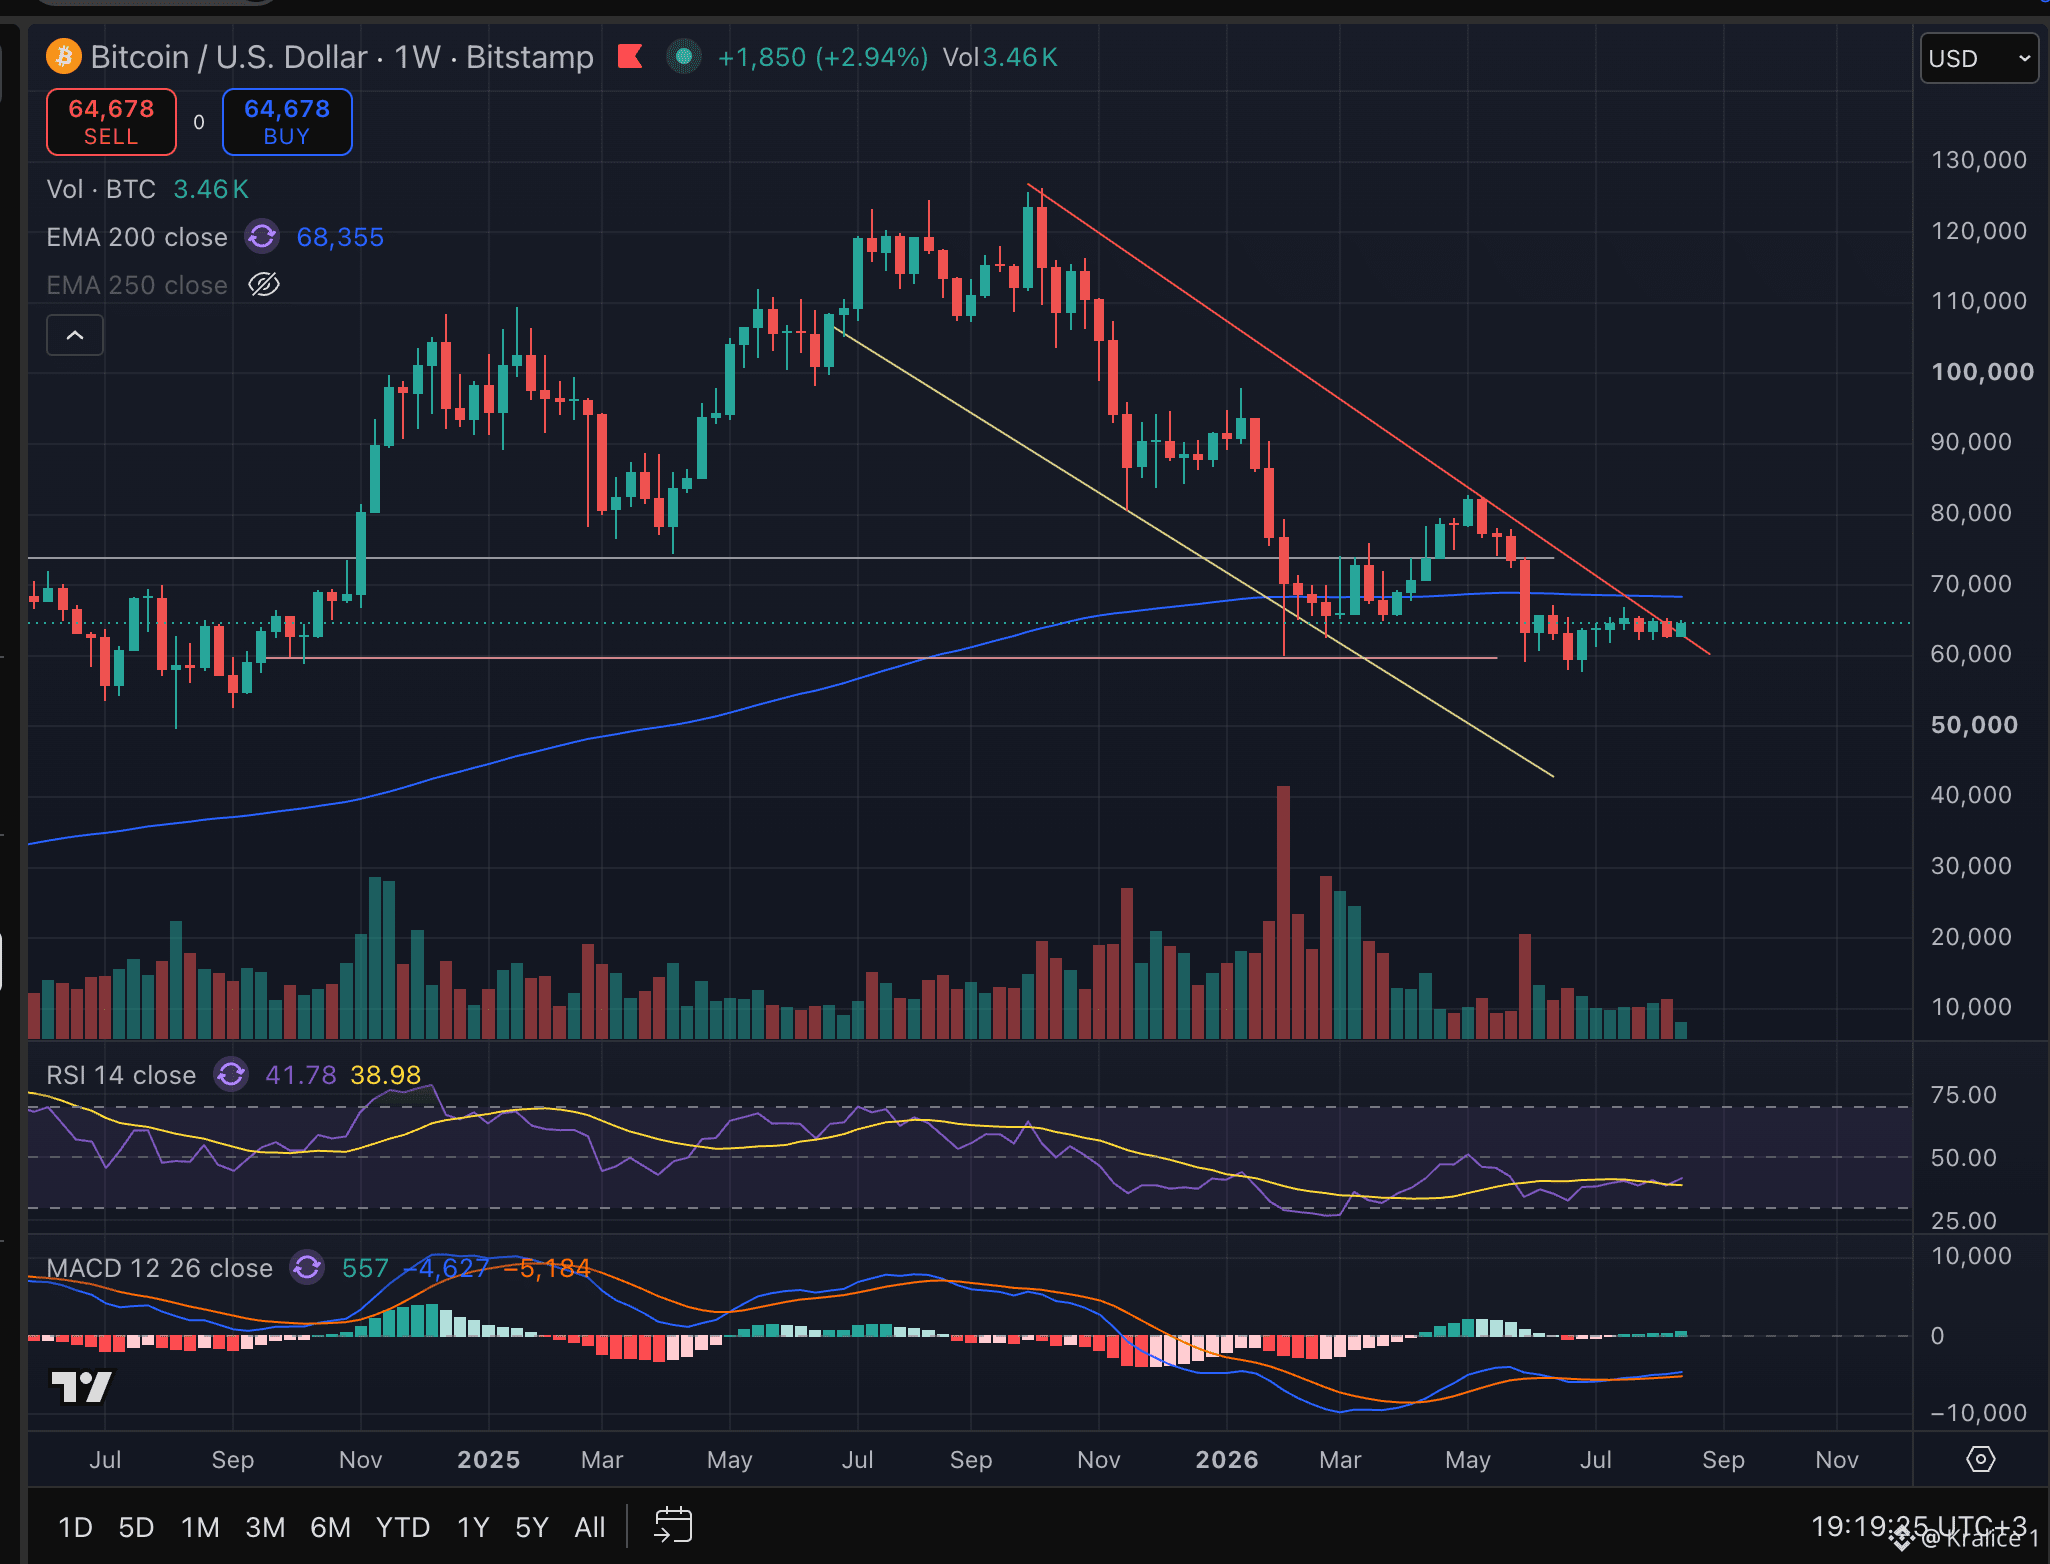
Bitcoin today reached the 62,500.$ level I mentioned. So what’s next? (https://www.youtube.com/shorts/-gyaMg-JZOE ) $BTC reacted from this zone, but we can’t say the bottom is in yet. Several factors are working together behind the decline: - Oil and bond yields rose. This increased concerns that inflation could pick up again and the Fed may stay tighter for longer. - Headline PPI didn’t change on a monthly basis, but core producer inflation rose by 0.4%. So cost pressure hasn’t fully disappeared. - Retail sales fell by 0.6%, and Michigan consumer sentiment came in below expectations. If the inflation risk remains while growth slows, it creates a difficult combination for crypto. - ETF flows turned negative again. When prices are falling, it’s important that institutional demand can’t offset the selling. - The Strategy–MSCI debate created a new risk. Strategy doesn’t necessarily need to sell BTC directly. But being removed from indices could lead to passive fund selling in MSTR and weaken the company’s ability to raise capital. On the chart, 62,500 was our first support—and it worked. If this level is lost on closes, I would expect the $60,000 area. My short-term bias is DOWN. But please pay attention to the reaction that the support (62.5K) may provide.
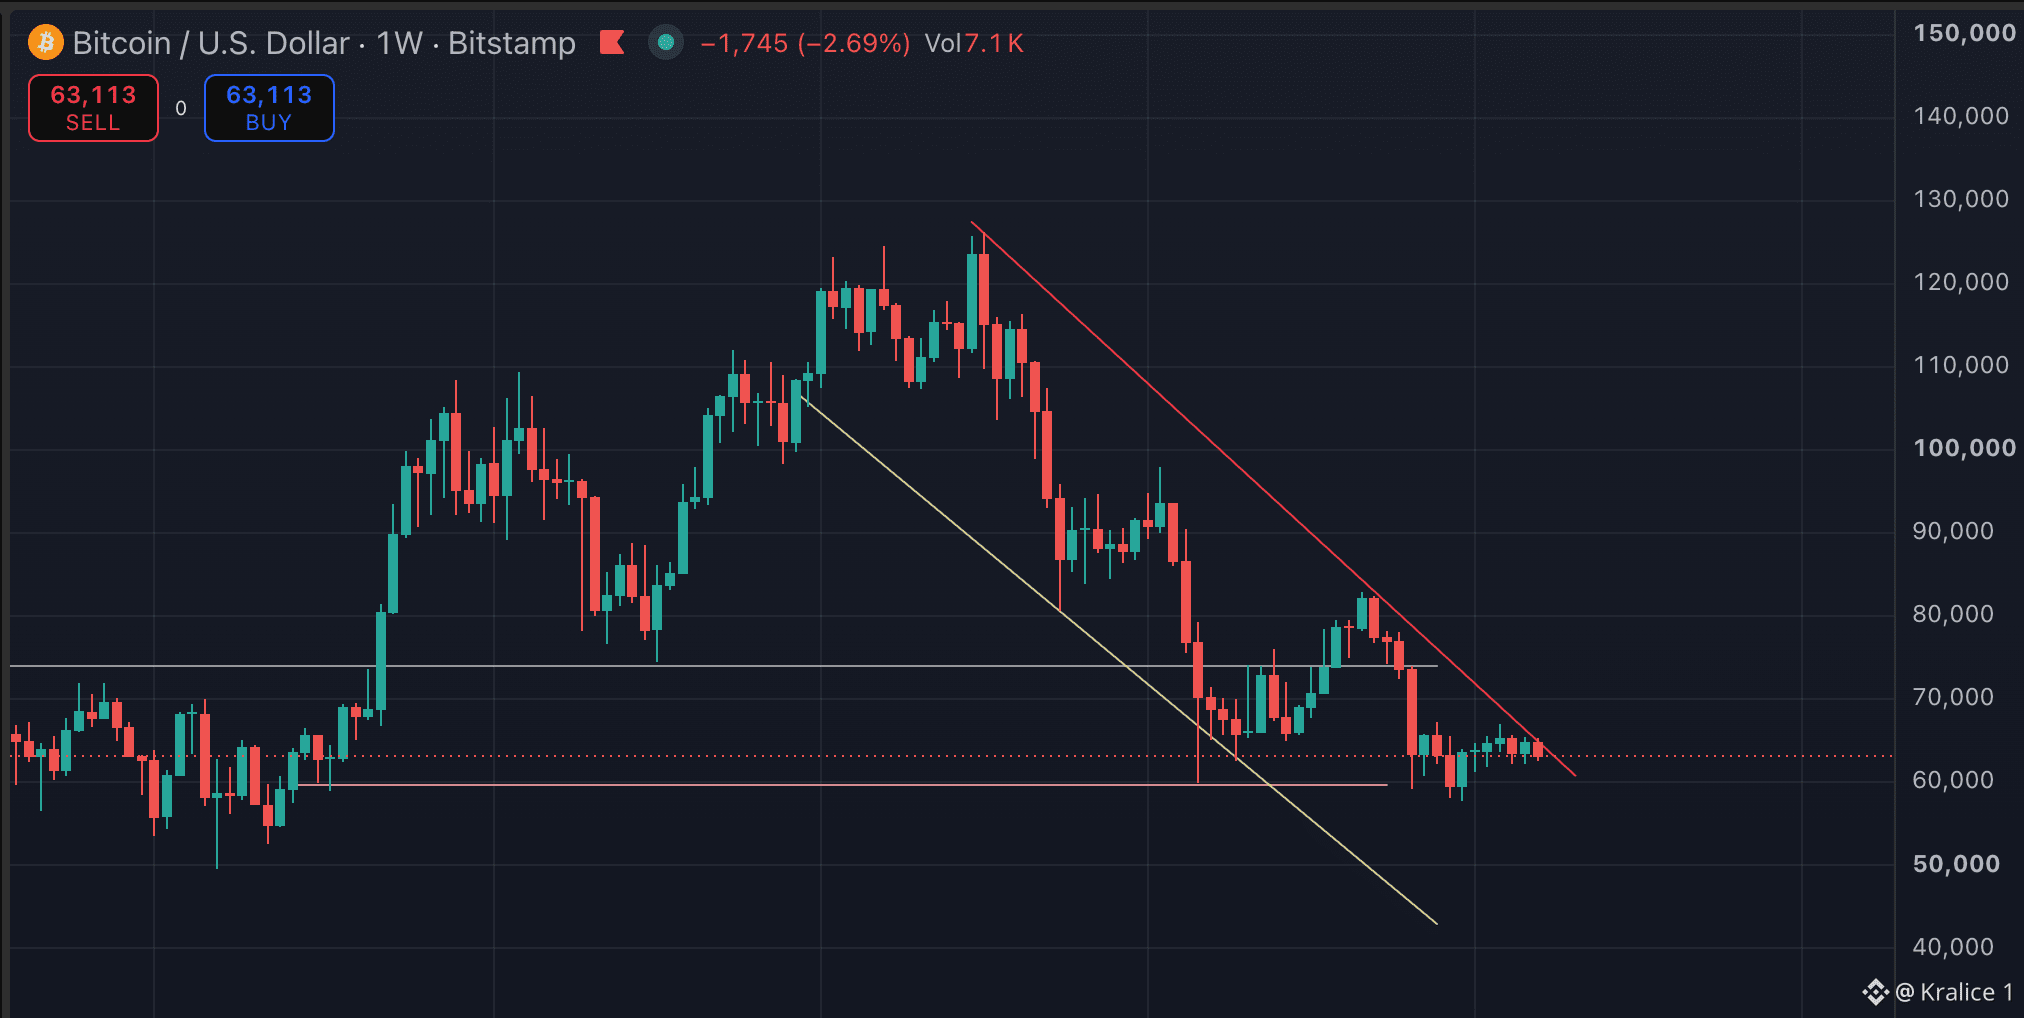
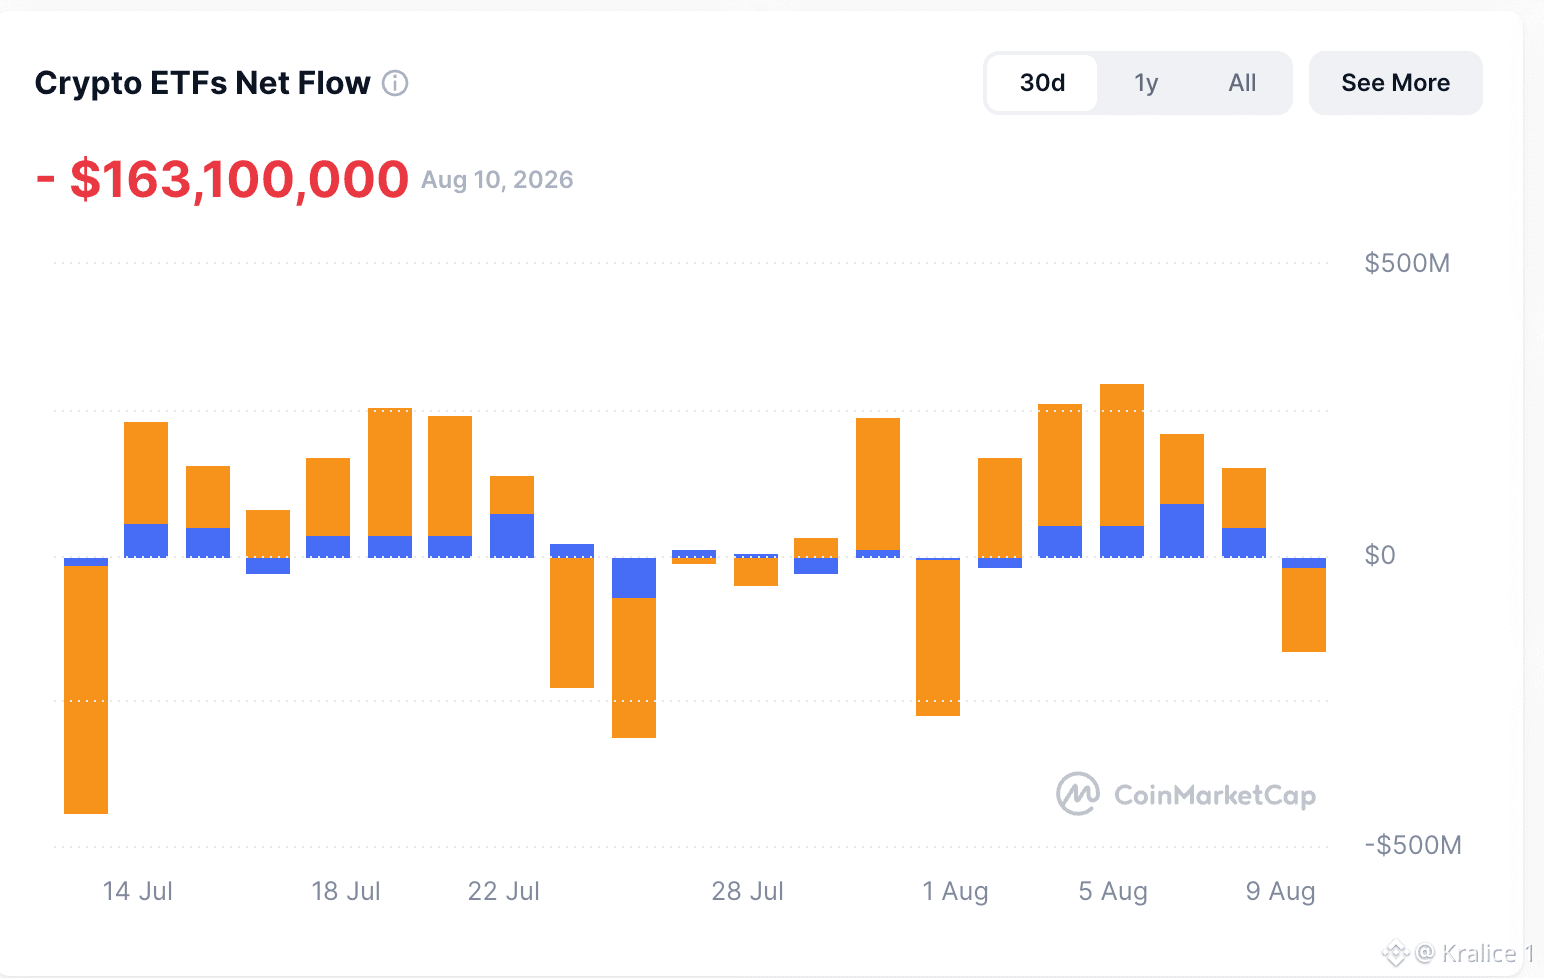
There is a reaction in Bitcoin today, but we cannot yet say “the decline is over.” Let’s recall the reasons behind the selloff that began on Monday: • Strategy sold 1,690 BTC. • BTC was rejected again at $65,150. • $163.1 million flowed out of spot ETFs. • The loss of critical supports triggered stop-outs and leveraged long liquidations. • The market reduced risk ahead of today’s U.S. CPI data. Now, on the hourly chart, the picture is improving. BTC received a reaction around $63,200 and regained the $63,900 level. The RSI is rising and the MACD is improving in the short term. However, on the daily chart, the 50 EMA around $64,500 is still resistance. Without seeing a daily close above this level, I consider any move not a trend reversal but an upswing reaction. Metaplanet holding 3,881 $BTC also does not mean selling. This is, for now, a transfer between the company’s own wallets. Don’t manufacture fear without seeing an exchange entry or an official statement of sales. At 15:30 today, the U.S. CPI will be released: • If inflation comes in low, $64,500 and then $65,000–$65,200 could be retested. • If core inflation is especially high, pressure on interest rates could increase; below $63,900, the $63,200 and $62,500 areas may come back into focus. My short-term outlook is sideways, with high volatility expected.
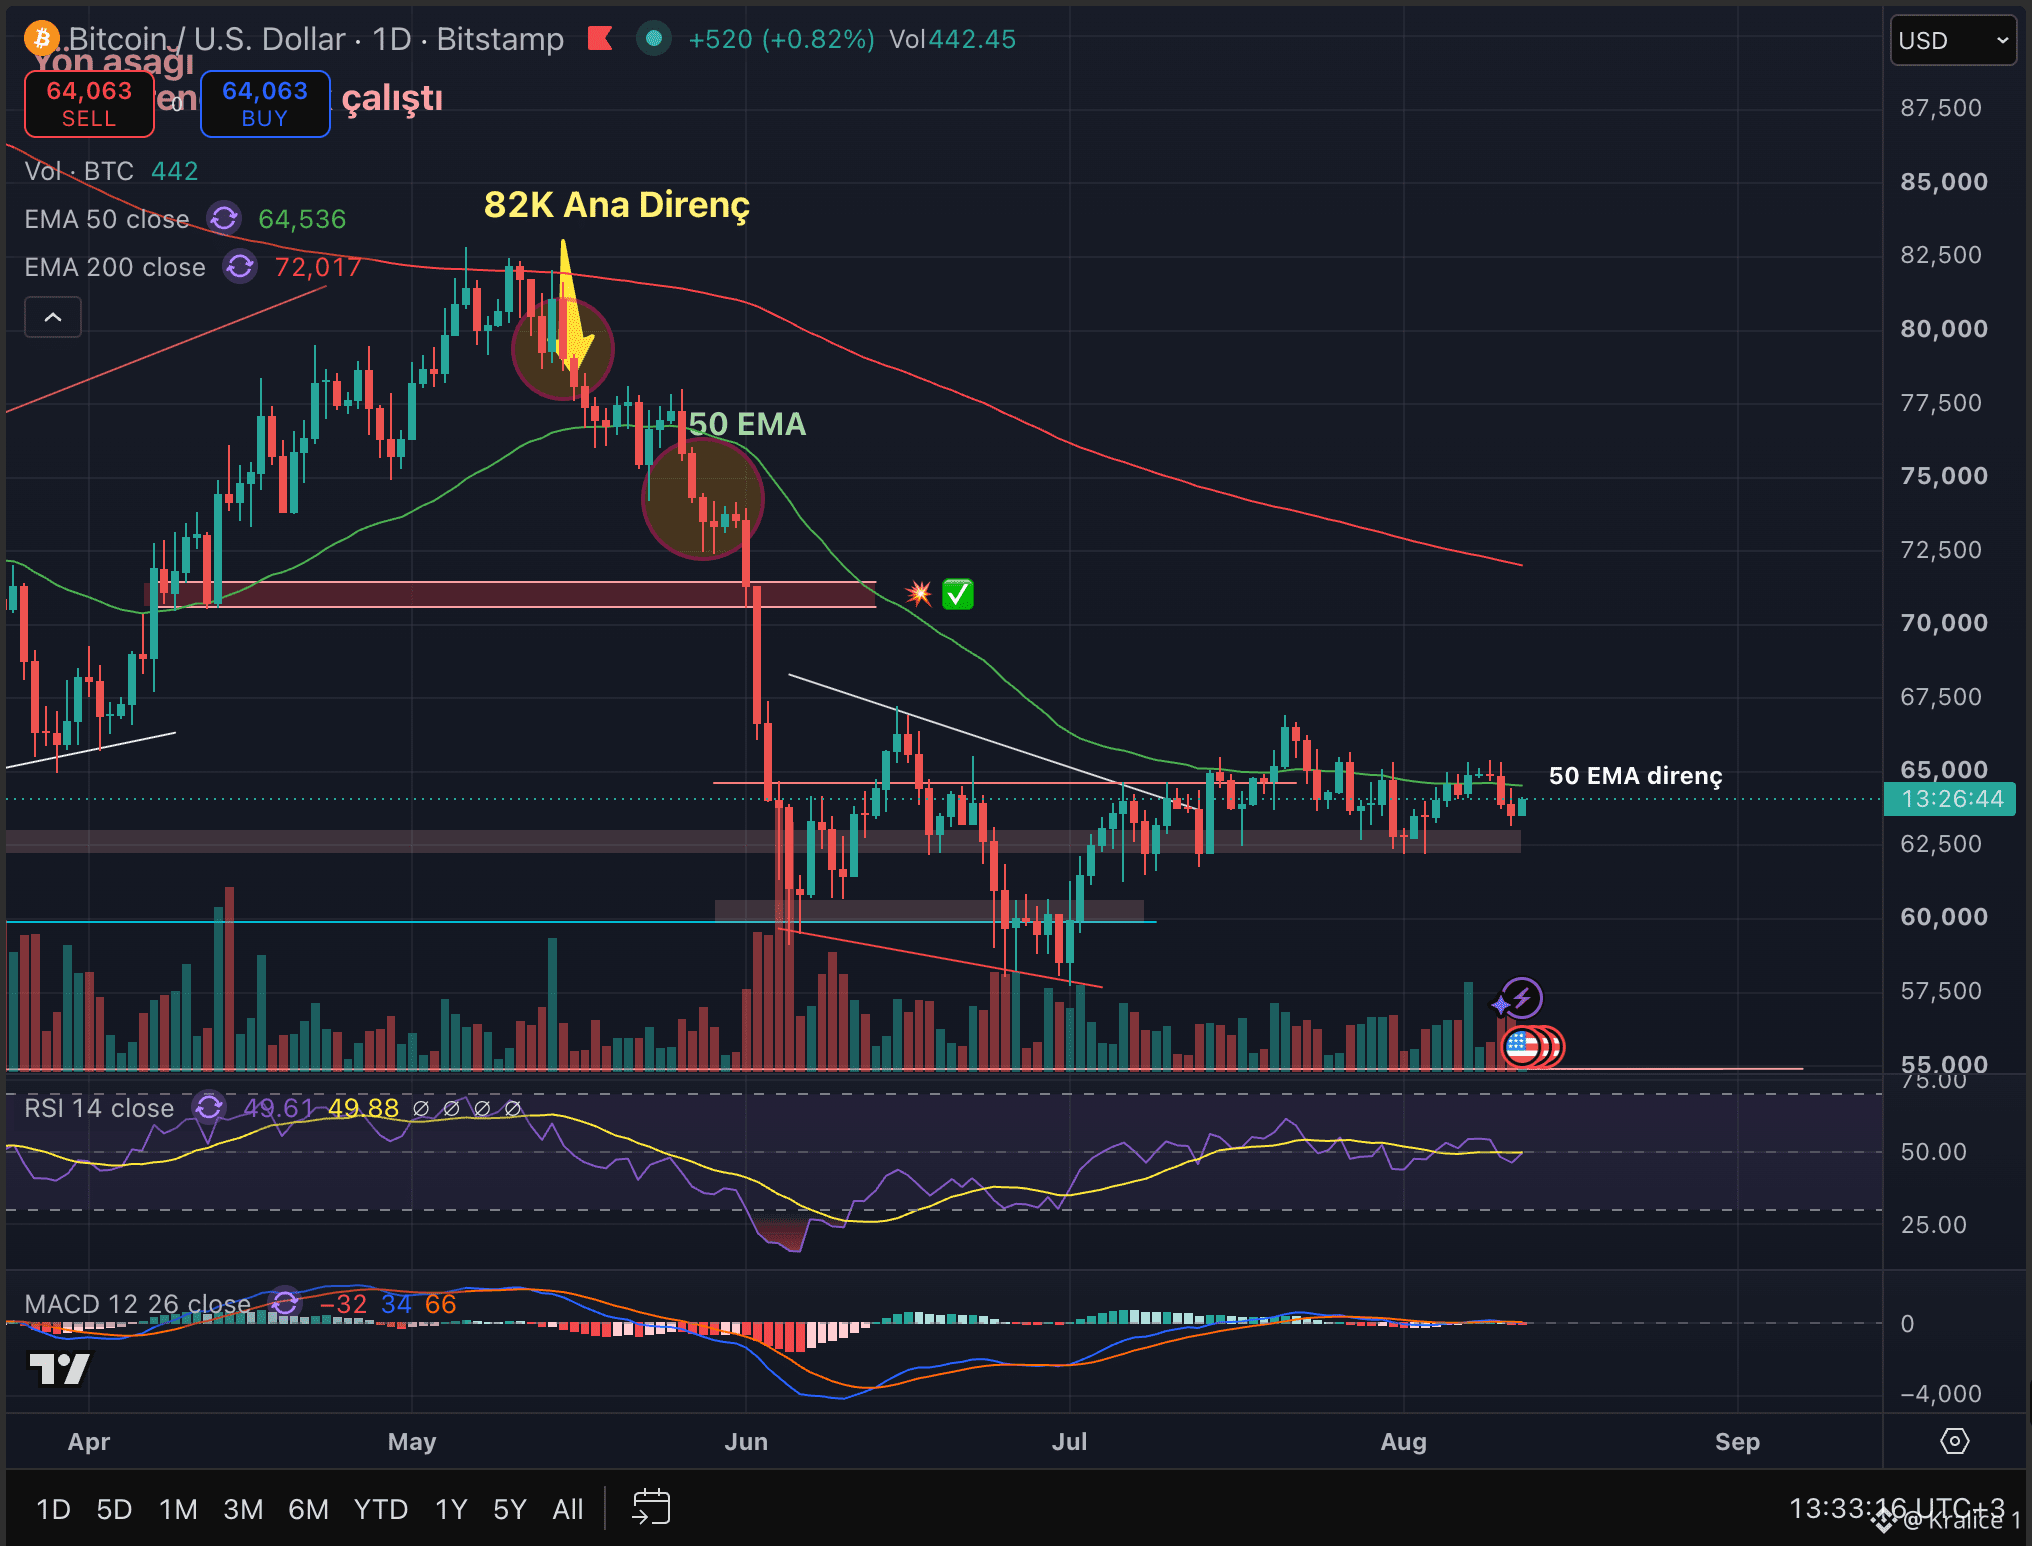
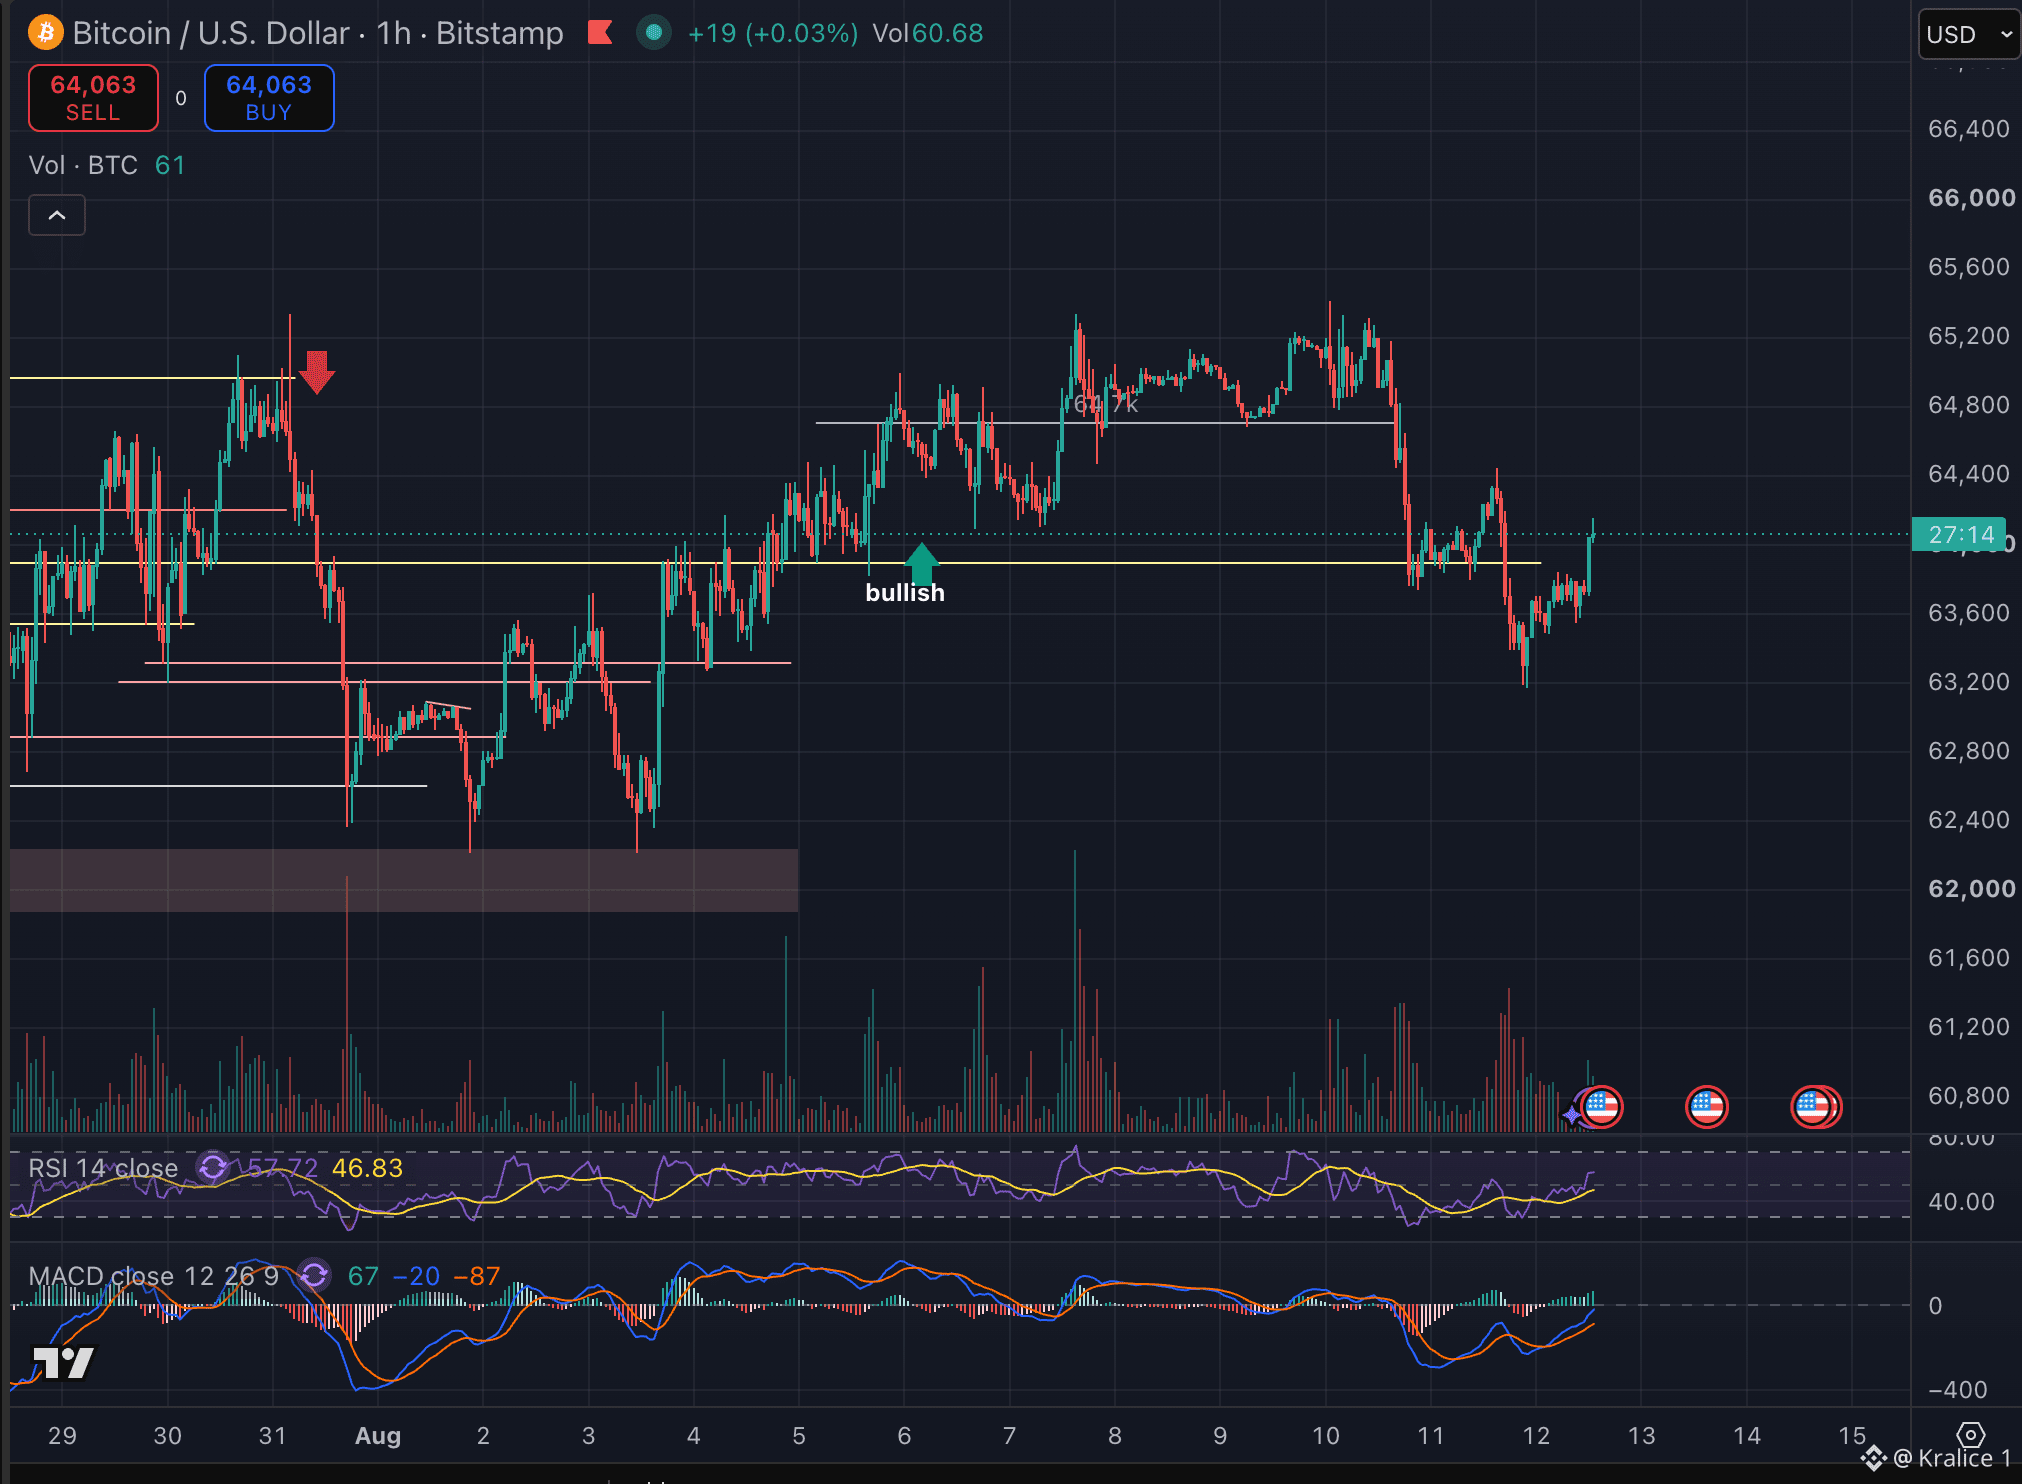
Why Is Bitcoin Falling Again Today? ⤵️ I’m not only linking this move to tomorrow’s CPI data release. The selling streak that started yesterday is continuing today: - Strategy 1.690 $BTC sold. This sale sparked concerns: “Will more follow?” - Bitcoin was rejected again around $65,150. Buyers failed to break through resistance. Stop orders and leveraged long liquidations kicked in, accelerating the drop. But the RSI on the chart is nearing the oversold zone; a short-term bounce could happen. - On Monday, $163.1 million flowed out of spot crypto ETFs. As the price fell, institutional demand wasn’t able to absorb the selling pressure. - It appears that companies’ interest is shifting from Bitcoin to AI investment. BTC’s marginal institutional buyer is weakening for now. - Tomorrow, U.S. CPI data will be released. Ahead of the report, we’re seeing position reduction and risk trimming. - There’s also a longer-term risk on the geopolitical side that we shouldn’t overlook: it’s being assessed that Tehran believes time is working in its favor and is trying to increase pressure on Washington ahead of the U.S. midterm elections in November by keeping energy prices high via the Strait of Hormuz. The chain of effects here is quite clear: - If Hormuz is closed or restricted, oil stays high. - If oil rises, U.S. inflation re-accelerates. - If inflation rises, the Fed keeps rates higher for longer and may even consider a new hike. - In that case, the dollar and bond yields strengthen while Bitcoin and other risk assets come under pressure. If tensions between Iran and the U.S. drag on, the risk to crypto shouldn’t be underestimated. On the other hand, reaching an agreement and fully reopening Hormuz could quickly reverse the entire scenario. My short-term bias is DOWN. I’m waiting for confirmation from the price action after tomorrow’s CPI at 15:30.
Log in to explore more content
Join global crypto users on Binance Square
⚡️ Get latest and useful information about crypto.
💬 Trusted by the world’s largest crypto exchange.
👍 Discover real insights from verified creators.
Email / Phone number
Sitemap
Cookie Preferences
Platform T&Cs