Four years ago today, I took screenshots during the historic $LUNC collapse — right as the market searched for a bottom near $0.0002700.
Back then, few believed the ecosystem could ever recover after such extreme destruction. But before the collapse, the original $LUNC went from roughly $0.27–$0.37 all the way to an unbelievable $119.55 in just 2.5 years.
Then, in less than 30 days, everything was wiped out. 📉
Now in 2026, $LUNC is once again trading near that same historical zone around $0.0002693 — a level many long-term holders consider psychologically important.
What makes this interesting is that the current price structure mirrors the earliest trading ranges from 2019. That’s why when people say “LUNC TO $0.37,” they’re not talking about a random number. They’re referring to the exact range where the asset originally started its journey years ago.
The images and historical screenshots align with long-term community projections targeting higher valuation zones by late 2026. Whether those predictions become reality or not, one fact remains undeniable:
History leaves clues.
And sometimes, old screenshots become proof that conviction existed long before the crowd arrived. 🔥
#LUNC✅ 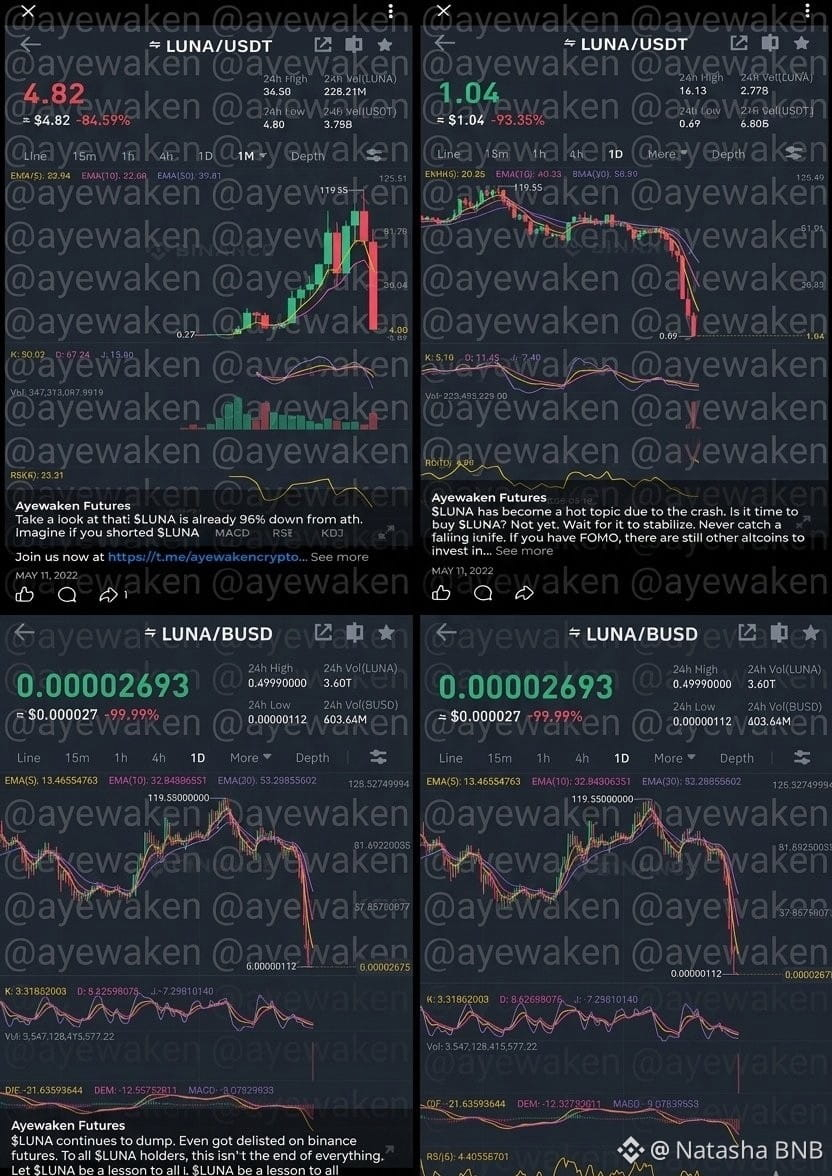 #TerraLunaClassic #Crypto #Altcoins #Bitcoin