
Bhatti 2007
27 පෝස්ටු

Bhatti 2007
වාර්තා කරන්න
පරිශීලක අවහිර කරන්න
විවෘත වෙළෙඳාම
නිතර වෙළෙන්දා
{වේලාව} මාස
1 හඹා යමින්
3 හඹා යන්නන්
17 කැමති විය
පෝස්ටු
ආයෝජන කළඹ
·
--
උසබ තත්ත්වය
🚀 AMD (ADVANCED MICRO DEVICES) — BULLISH MOMENTUM
AMD is showing strong bullish momentum after a significant price surge. 📈
A breakout above $448 could open the door for a potential move toward $460, while $446.25 remains an important support level.
Traders should watch volume, resistance, and market sentiment closely. A pullback or trend reversal is still possible.
Trend Outlook: Potentially Bullish
Key Resistance: $448.14
Support Level: $446.25
Next Focus: $460 — Speculative Target
⚠️ This is a technical market observation, not financial advice. Always manage risk.$AMD.US
{stock_us}(AMD.US)
🤑🤑🤑🤑🤑🤑🤑🤑🤑
🚀 AMD (ADVANCED MICRO DEVICES) — BULLISH MOMENTUM
AMD is showing strong bullish momentum after a significant price surge. 📈
A breakout above $448 could open the door for a potential move toward $460, while $446.25 remains an important support level.
Traders should watch volume, resistance, and market sentiment closely. A pullback or trend reversal is still possible.
Trend Outlook: Potentially Bullish
Key Resistance: $448.14
Support Level: $446.25
Next Focus: $460 — Speculative Target
⚠️ This is a technical market observation, not financial advice. Always manage risk.$AMD.US
🤑🤑🤑🤑🤑🤑🤑🤑🤑
AMD is showing strong bullish momentum after a significant price surge. 📈
A breakout above $448 could open the door for a potential move toward $460, while $446.25 remains an important support level.
Traders should watch volume, resistance, and market sentiment closely. A pullback or trend reversal is still possible.
Trend Outlook: Potentially Bullish
Key Resistance: $448.14
Support Level: $446.25
Next Focus: $460 — Speculative Target
⚠️ This is a technical market observation, not financial advice. Always manage risk.$AMD.US
🤑🤑🤑🤑🤑🤑🤑🤑🤑


AMDUS+10.64%
96
·
--
{spot}(AMDBUSDT)
🚀 AMD (Advanced Micro Devices) — Bullish Momentum
AMD is showing strong bullish momentum after a significant price increase. The short-term trend remains positive, with traders watching key resistance levels for a potential breakout.
📊 Trend Outlook: Potential Bullish Momentum
⏳ Timeframe: Next 24–72 Hours
🎯 Resistance: $460–$470
🛡️ Support: $440–$445
A sustained move above resistance could strengthen the bullish outlook. Watch volume and price action carefully — market direction is never guaranteed. Always manage risk.
🚀 AMD (Advanced Micro Devices) — Bullish Momentum
AMD is showing strong bullish momentum after a significant price increase. The short-term trend remains positive, with traders watching key resistance levels for a potential breakout.
📊 Trend Outlook: Potential Bullish Momentum
⏳ Timeframe: Next 24–72 Hours
🎯 Resistance: $460–$470
🛡️ Support: $440–$445
A sustained move above resistance could strengthen the bullish outlook. Watch volume and price action carefully — market direction is never guaranteed. Always manage risk.
AMD is showing strong bullish momentum after a significant price increase. The short-term trend remains positive, with traders watching key resistance levels for a potential breakout.
📊 Trend Outlook: Potential Bullish Momentum
⏳ Timeframe: Next 24–72 Hours
🎯 Resistance: $460–$470
🛡️ Support: $440–$445
A sustained move above resistance could strengthen the bullish outlook. Watch volume and price action carefully — market direction is never guaranteed. Always manage risk.

57
·
--
උසබ තත්ත්වය
🚀 COHR (COHERENT CORP.) — BULLISH MOMENTUM
COHR is showing strong upward momentum after a significant price surge. A sustained move above the $195 resistance level could open the door for further upside.
📊 Current Price: $192.83
🎯 Key Resistance: $195.00
📈 Trend Outlook: Potential Bullish Continuation
⏳ Timeframe: Next 24–72 Hours
Watch the price action and trading volume closely. A breakout is possible, but market volatility remains high. This is a technical outlook, not a guaranteed prediction.
Stay focused. Trade smart.$COHRB
{future}(COHRUSDT)
🚀 COHR (COHERENT CORP.) — BULLISH MOMENTUM
COHR is showing strong upward momentum after a significant price surge. A sustained move above the $195 resistance level could open the door for further upside.
📊 Current Price: $192.83
🎯 Key Resistance: $195.00
📈 Trend Outlook: Potential Bullish Continuation
⏳ Timeframe: Next 24–72 Hours
Watch the price action and trading volume closely. A breakout is possible, but market volatility remains high. This is a technical outlook, not a guaranteed prediction.
Stay focused. Trade smart.$COHRB
COHR is showing strong upward momentum after a significant price surge. A sustained move above the $195 resistance level could open the door for further upside.
📊 Current Price: $192.83
🎯 Key Resistance: $195.00
📈 Trend Outlook: Potential Bullish Continuation
⏳ Timeframe: Next 24–72 Hours
Watch the price action and trading volume closely. A breakout is possible, but market volatility remains high. This is a technical outlook, not a guaranteed prediction.
Stay focused. Trade smart.$COHRB

85
·
--
උසබ තත්ත්වය
आपके TRUMP/USDT के 5 मिनट वाले चार्ट के हिसाब से एक शानदार Binance-स्टाइल ग्राफ तैयार कर रहा हूँ।
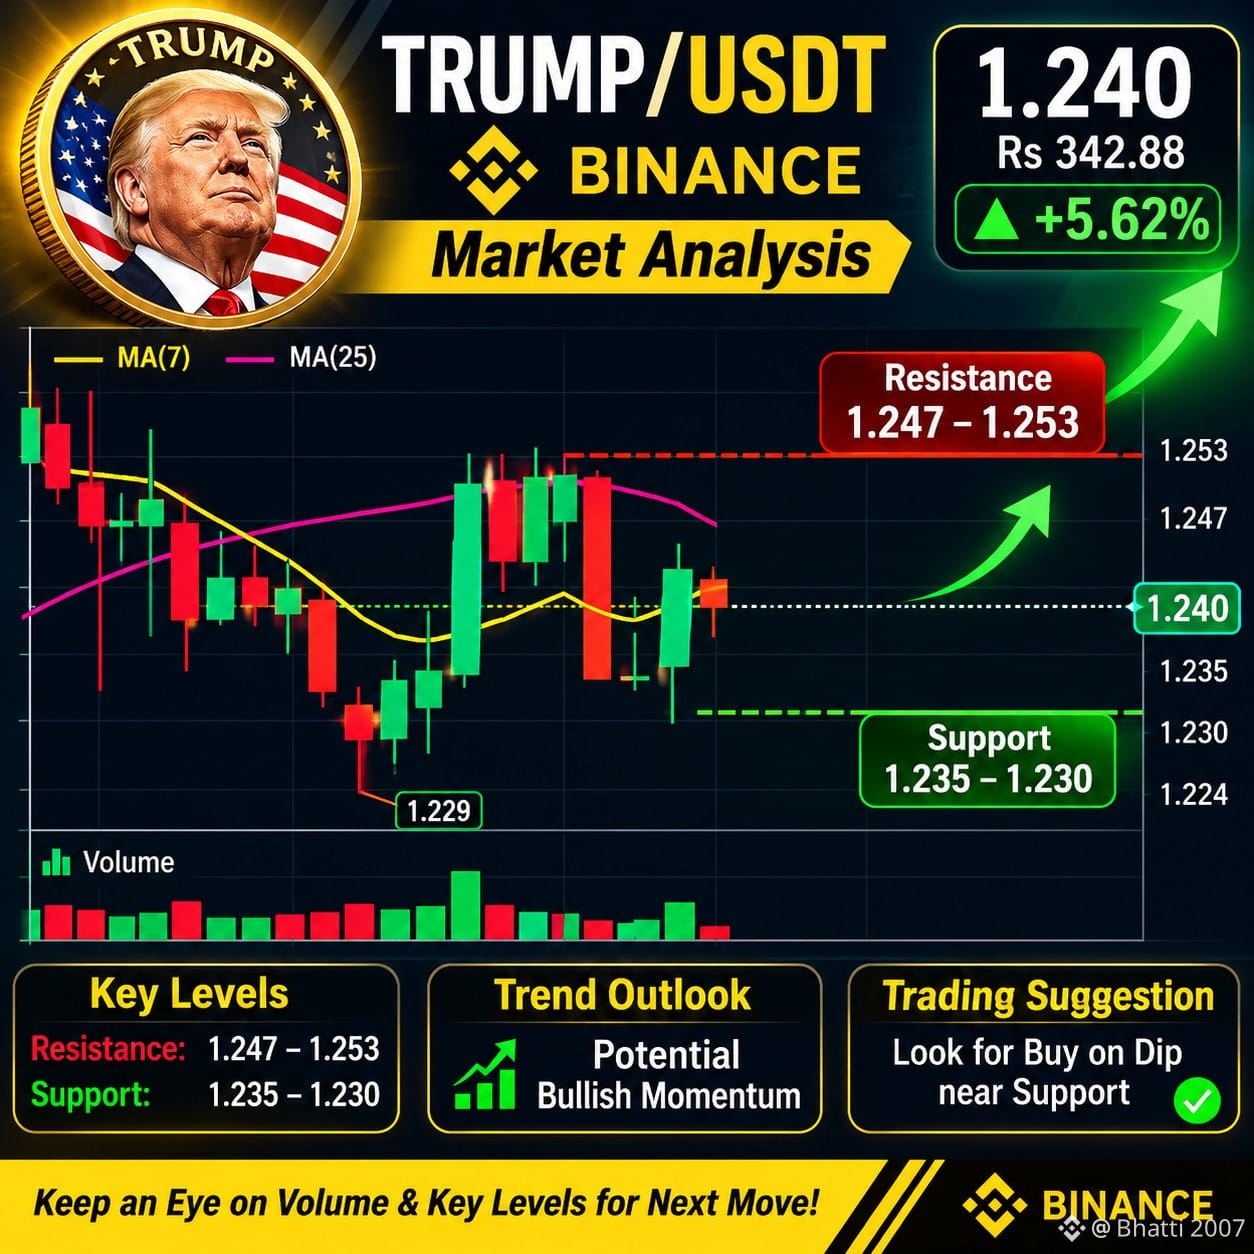
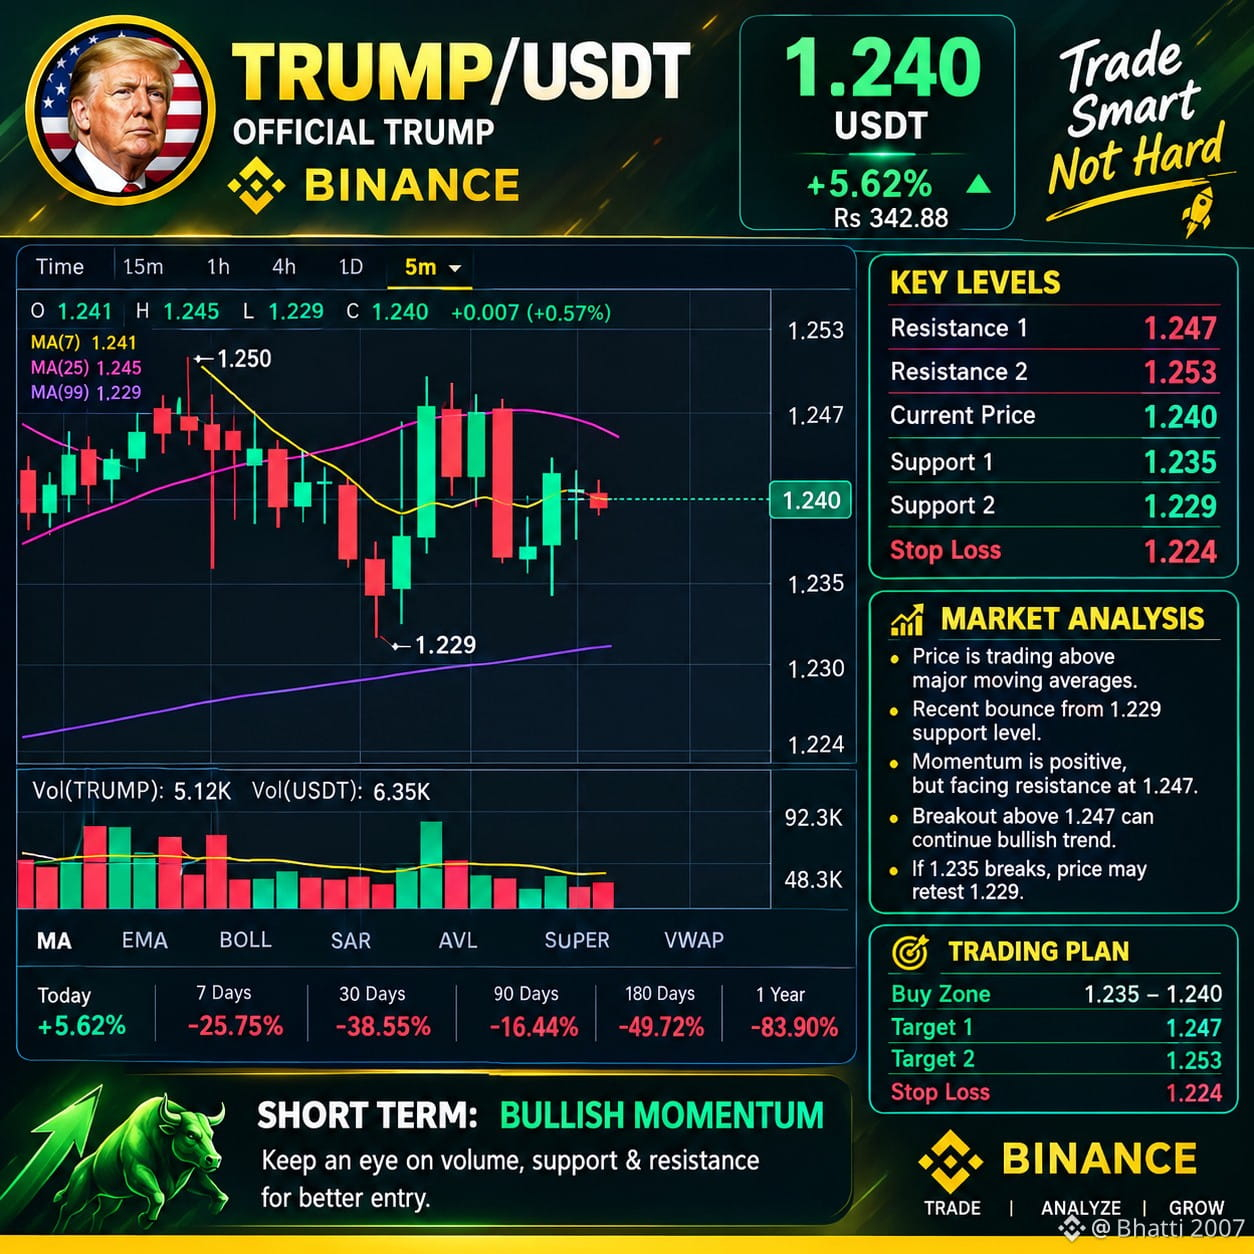
### 📊 TRUMP/USDT — Technical Analysis
* Current Price: 1.240 USDT
* 24H Change: +5.62%
* Resistance: 1.245 – 1.250
* Support: 1.235 – 1.229
* Short-Term Outlook: Neutral to Slightly Bearish
कीमत अभी MA(25) के नीचे है। अगर 1.245 के ऊपर मजबूत ब्रेकआउट मिलता है, तो तेजी की संभावना बन सकती है। 1.235 के नीचे जाने पर कमजोरी बढ़ सकती है।
यह स्क्रीनशॉट के आधार पर विश्लेषण है, निश्चित भविष्यवाणी नहीं।
### 📈 TRUMP/USDT Graph
```text
Price: 1.240 USDT
1.253 ───── Resistance 2
1.247 ───── Resistance 1
1.245 ───── Breakout Level
1.240 ───── Current Price
1.235 ───── Support 1
1.229 ───── Support 2
Outlook: Neutral / Volatile
```
English Post:
TRUMP/USDT is showing short-term volatility after a recent recovery from the 1.229 support zone. A breakout above 1.245–1.247 could open the door for further upside toward 1.253. However, a drop below 1.235 may increase selling pressure. Traders should monitor volume and key support levels before making any decisions.
The generated image is an illustrative chart, not a live trading signal.
{future}(TRUMPUSDT)
आपके TRUMP/USDT के 5 मिनट वाले चार्ट के हिसाब से एक शानदार Binance-स्टाइल ग्राफ तैयार कर रहा हूँ।
### 📊 TRUMP/USDT — Technical Analysis
* Current Price: 1.240 USDT
* 24H Change: +5.62%
* Resistance: 1.245 – 1.250
* Support: 1.235 – 1.229
* Short-Term Outlook: Neutral to Slightly Bearish
कीमत अभी MA(25) के नीचे है। अगर 1.245 के ऊपर मजबूत ब्रेकआउट मिलता है, तो तेजी की संभावना बन सकती है। 1.235 के नीचे जाने पर कमजोरी बढ़ सकती है।
यह स्क्रीनशॉट के आधार पर विश्लेषण है, निश्चित भविष्यवाणी नहीं।
### 📈 TRUMP/USDT Graph
```text
Price: 1.240 USDT
1.253 ───── Resistance 2
1.247 ───── Resistance 1
1.245 ───── Breakout Level
1.240 ───── Current Price
1.235 ───── Support 1
1.229 ───── Support 2
Outlook: Neutral / Volatile
```
English Post:
TRUMP/USDT is showing short-term volatility after a recent recovery from the 1.229 support zone. A breakout above 1.245–1.247 could open the door for further upside toward 1.253. However, a drop below 1.235 may increase selling pressure. Traders should monitor volume and key support levels before making any decisions.
The generated image is an illustrative chart, not a live trading signal.
### 📊 TRUMP/USDT — Technical Analysis
* Current Price: 1.240 USDT
* 24H Change: +5.62%
* Resistance: 1.245 – 1.250
* Support: 1.235 – 1.229
* Short-Term Outlook: Neutral to Slightly Bearish
कीमत अभी MA(25) के नीचे है। अगर 1.245 के ऊपर मजबूत ब्रेकआउट मिलता है, तो तेजी की संभावना बन सकती है। 1.235 के नीचे जाने पर कमजोरी बढ़ सकती है।
यह स्क्रीनशॉट के आधार पर विश्लेषण है, निश्चित भविष्यवाणी नहीं।
### 📈 TRUMP/USDT Graph
```text
Price: 1.240 USDT
1.253 ───── Resistance 2
1.247 ───── Resistance 1
1.245 ───── Breakout Level
1.240 ───── Current Price
1.235 ───── Support 1
1.229 ───── Support 2
Outlook: Neutral / Volatile
```
English Post:
TRUMP/USDT is showing short-term volatility after a recent recovery from the 1.229 support zone. A breakout above 1.245–1.247 could open the door for further upside toward 1.253. However, a drop below 1.235 may increase selling pressure. Traders should monitor volume and key support levels before making any decisions.
The generated image is an illustrative chart, not a live trading signal.
47
·
--
බෙයාරිෂ්
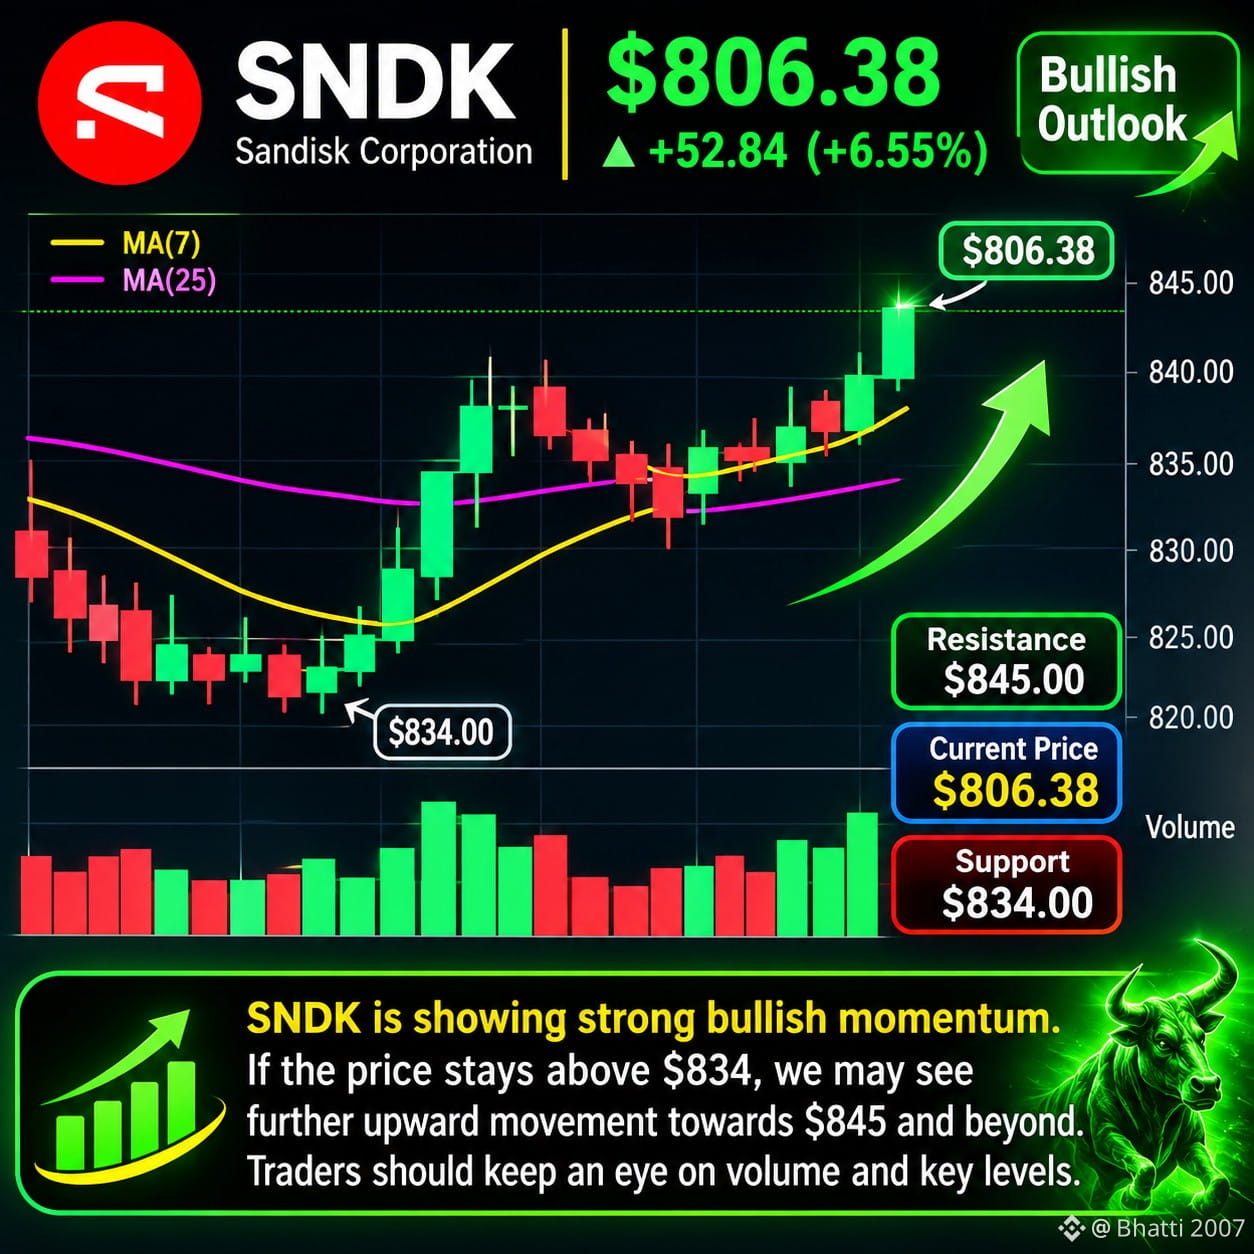
🚀 SNDK is showing a potential short-term recovery after a sharp market decline.
📈 A breakout above $845 could signal further bullish momentum.
🎯 Traders should closely monitor support, resistance, and trading volume.
⚠️ Market direction remains uncertain — always confirm with live price action.
{stock_us}(SNDK.US)
🚀 SNDK is showing a potential short-term recovery after a sharp market decline.
📈 A breakout above $845 could signal further bullish momentum.
🎯 Traders should closely monitor support, resistance, and trading volume.
⚠️ Market direction remains uncertain — always confirm with live price action.
📈 A breakout above $845 could signal further bullish momentum.
🎯 Traders should closely monitor support, resistance, and trading volume.
⚠️ Market direction remains uncertain — always confirm with live price action.
SNDKUS+4.14%
1.4k
·
--
උසබ තත්ත්වය
🚀 JCTUSDT — BULLISH MOMENTUM
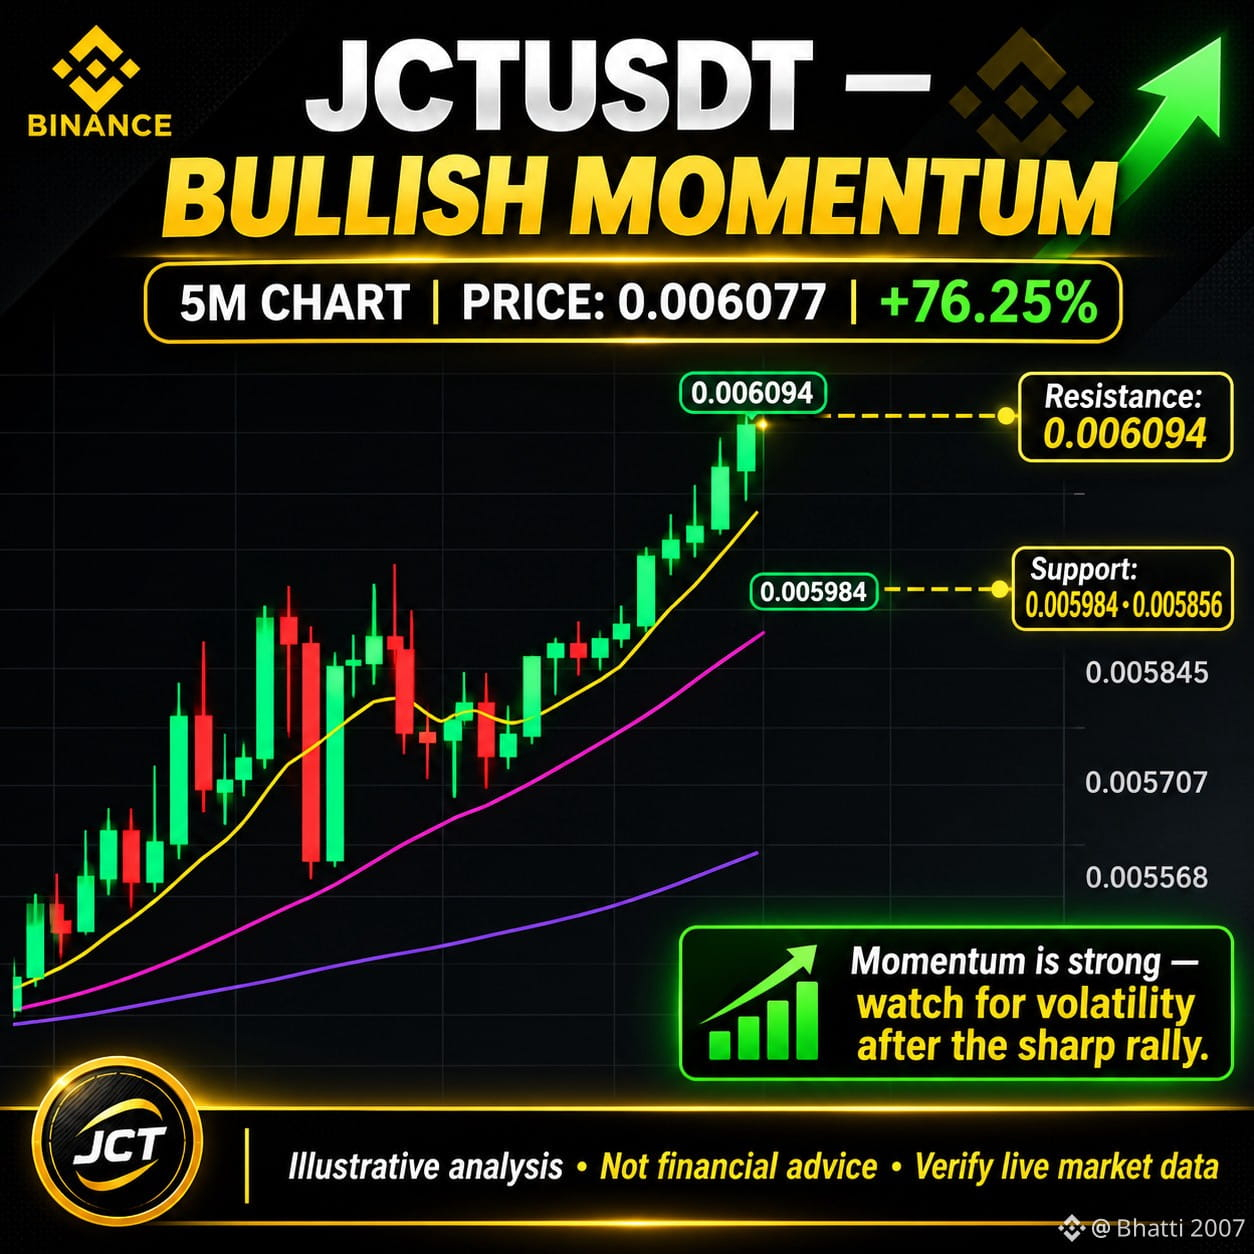
📊 Strong upward momentum is visible on the 5-minute chart.
🟢 Current Price: 0.006077
📈 24H Change: +76.25%
🎯 Resistance: 0.006094
🔍 Key Support: 0.005984 – 0.005856
⚠️ After a sharp rally, volatility may increase. Watch for a confirmed breakout and monitor live market conditions.
JCT JCTUSDT CryptoAnalysis Binance BullishMomentum Altcoins
{future}(JCTUSDT)
$JCT
🚀 JCTUSDT — BULLISH MOMENTUM
📊 Strong upward momentum is visible on the 5-minute chart.
🟢 Current Price: 0.006077
📈 24H Change: +76.25%
🎯 Resistance: 0.006094
🔍 Key Support: 0.005984 – 0.005856
⚠️ After a sharp rally, volatility may increase. Watch for a confirmed breakout and monitor live market conditions.
JCT JCTUSDT CryptoAnalysis Binance BullishMomentum Altcoins
$JCT
📊 Strong upward momentum is visible on the 5-minute chart.
🟢 Current Price: 0.006077
📈 24H Change: +76.25%
🎯 Resistance: 0.006094
🔍 Key Support: 0.005984 – 0.005856
⚠️ After a sharp rally, volatility may increase. Watch for a confirmed breakout and monitor live market conditions.
JCT JCTUSDT CryptoAnalysis Binance BullishMomentum Altcoins
$JCT
235

·
--
බෙයාරිෂ්
🚀 ETHEREUM (ETH) — MARKET TREND ANALYSIS
Ethereum remains one of the leading cryptocurrencies in the market. A potential bullish move could develop if ETH breaks above key resistance with strong trading volume. Traders should monitor price action, support levels, and market sentiment before making any decisions.
📊 Trend Outlook: Potential Bullish Momentum
⏳ Timeframe: Next 24–72 Hours
🎯 Key Focus: Support, Resistance & Volume
⚠️ Market direction is uncertain. Always confirm the trend with live chart data and manage your risk carefully.
{spot}(ETHUSDT)
🚀 ETHEREUM (ETH) — MARKET TREND ANALYSIS
Ethereum remains one of the leading cryptocurrencies in the market. A potential bullish move could develop if ETH breaks above key resistance with strong trading volume. Traders should monitor price action, support levels, and market sentiment before making any decisions.
📊 Trend Outlook: Potential Bullish Momentum
⏳ Timeframe: Next 24–72 Hours
🎯 Key Focus: Support, Resistance & Volume
⚠️ Market direction is uncertain. Always confirm the trend with live chart data and manage your risk carefully.
Ethereum remains one of the leading cryptocurrencies in the market. A potential bullish move could develop if ETH breaks above key resistance with strong trading volume. Traders should monitor price action, support levels, and market sentiment before making any decisions.
📊 Trend Outlook: Potential Bullish Momentum
⏳ Timeframe: Next 24–72 Hours
🎯 Key Focus: Support, Resistance & Volume
⚠️ Market direction is uncertain. Always confirm the trend with live chart data and manage your risk carefully.

78
·
--
📊 DAY 1 — MARKET INTRODUCTION & POSITIONING
₿ BTC / USDT — Daily Market Watch
In the fast-moving crypto market, smart traders focus on price action, market structure, and key support and resistance levels. 📈
🔍 What to Watch Today:
BTC Price Action: Monitor key breakout and breakdown levels.
Market Sentiment: Watch for changes in buying and selling pressure.
Trading Volume: Confirm whether a move has strong market participation.
Key Levels: Identify important support and resistance zones.
⚠️ Market Outlook: Bitcoin's next move remains uncertain. Wait for confirmation before making any trading decisions.
💡 Trade Smart. Manage Risk. Stay Informed.
BitcoinBTCBinanceCryptoAnalysis BTCUSDT CryptoMarket TradingStrategy MarketWatch
{spot}(BTCUSDT)
📊 DAY 1 — MARKET INTRODUCTION & POSITIONING
₿ BTC / USDT — Daily Market Watch
In the fast-moving crypto market, smart traders focus on price action, market structure, and key support and resistance levels. 📈
🔍 What to Watch Today:
BTC Price Action: Monitor key breakout and breakdown levels.
Market Sentiment: Watch for changes in buying and selling pressure.
Trading Volume: Confirm whether a move has strong market participation.
Key Levels: Identify important support and resistance zones.
⚠️ Market Outlook: Bitcoin's next move remains uncertain. Wait for confirmation before making any trading decisions.
💡 Trade Smart. Manage Risk. Stay Informed.
BitcoinBTCBinanceCryptoAnalysis BTCUSDT CryptoMarket TradingStrategy MarketWatch
₿ BTC / USDT — Daily Market Watch
In the fast-moving crypto market, smart traders focus on price action, market structure, and key support and resistance levels. 📈
🔍 What to Watch Today:
BTC Price Action: Monitor key breakout and breakdown levels.
Market Sentiment: Watch for changes in buying and selling pressure.
Trading Volume: Confirm whether a move has strong market participation.
Key Levels: Identify important support and resistance zones.
⚠️ Market Outlook: Bitcoin's next move remains uncertain. Wait for confirmation before making any trading decisions.
💡 Trade Smart. Manage Risk. Stay Informed.
BitcoinBTCBinanceCryptoAnalysis BTCUSDT CryptoMarket TradingStrategy MarketWatch

70
·
--
උසබ තත්ත්වය
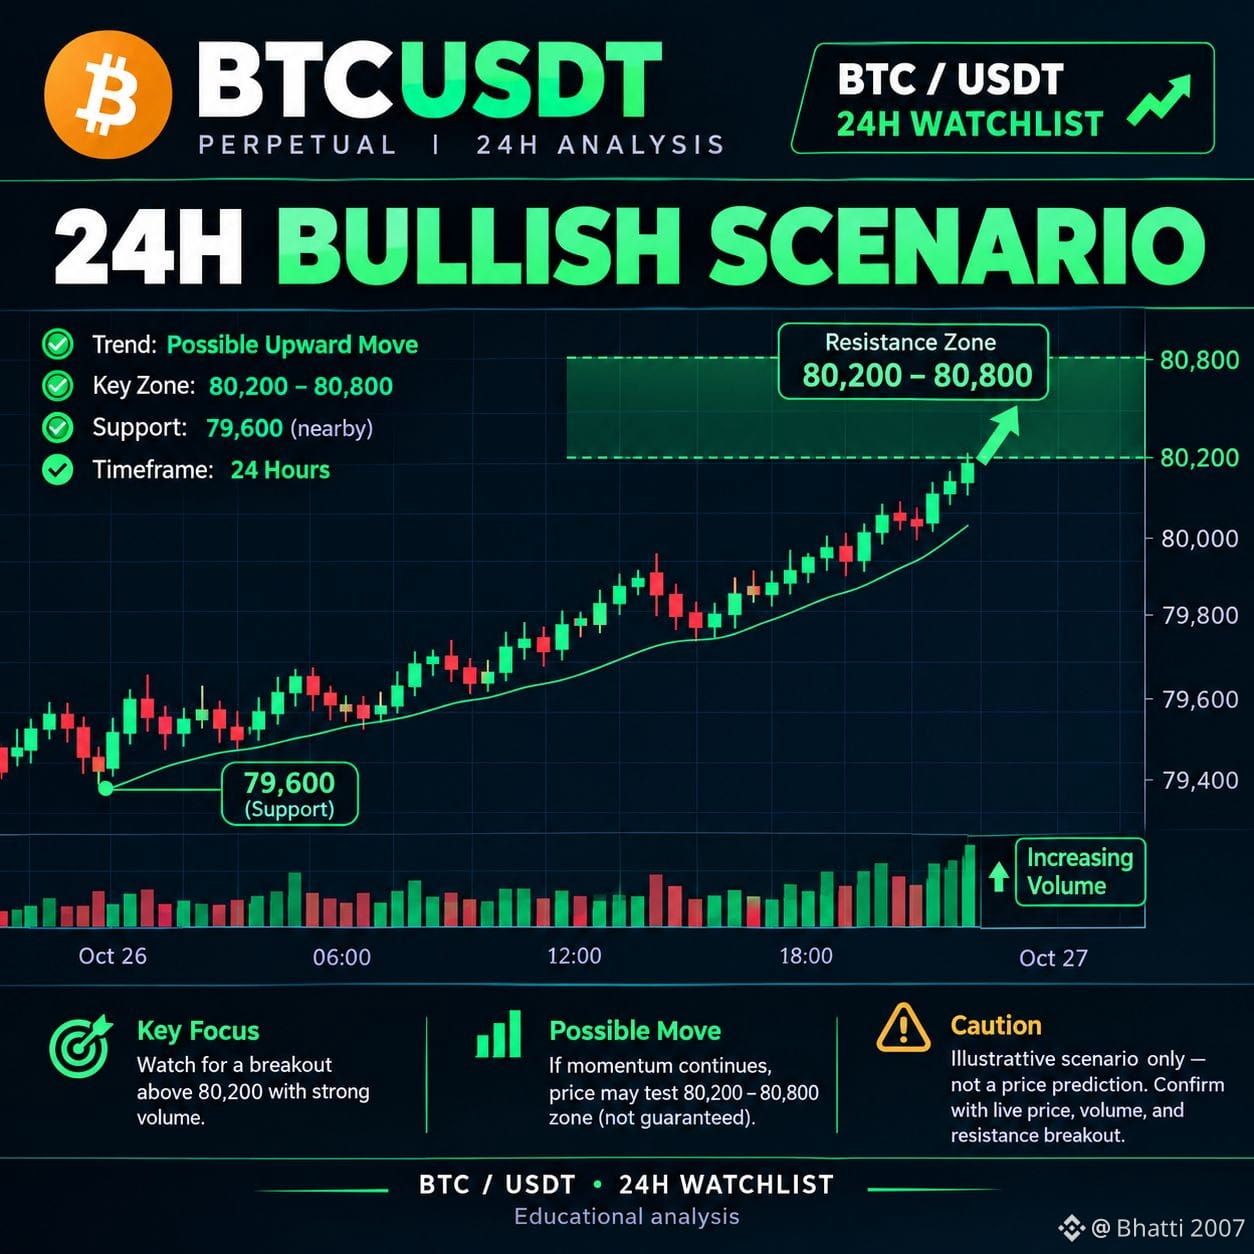
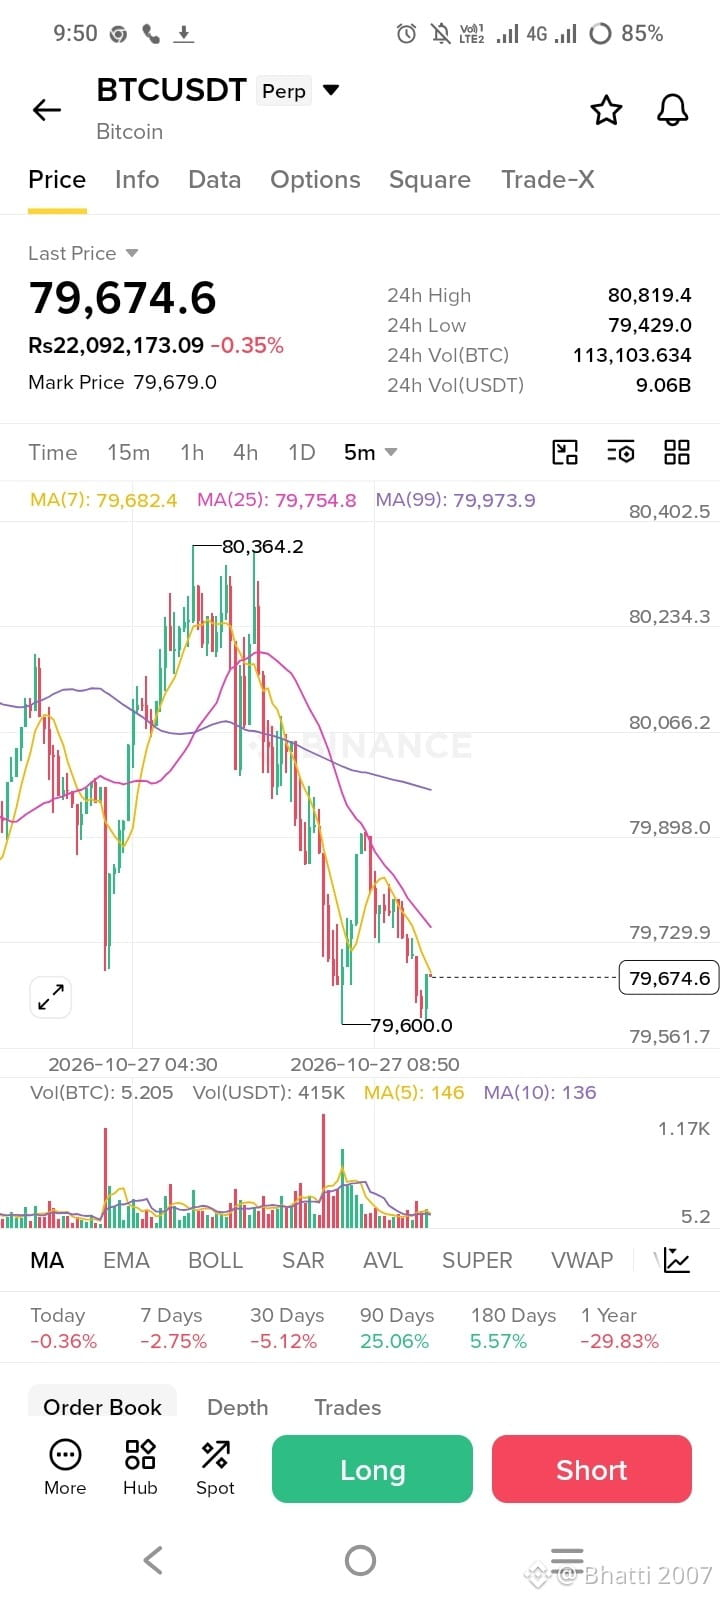
📊 BTC/USDT — CAUTIOUS MARKET OUTLOOK
🪙 Reference Price: 79,674.6 USDT (from the shared chart)
📉 Short-Term Trend: Slightly bearish momentum is visible on the 5-minute timeframe.
🛡️ Key Support: 79,600 USDT — watch for a confirmed break below this level.
🎯 Resistance Zone: 79,730–79,900 USDT — a sustained move above this zone may indicate a potential recovery.
⚖️ Market Outlook: Direction remains uncertain. Wait for price-action and volume confirmation before considering a trade.
⚠️ This is a snapshot-based analysis, not a guaranteed prediction. Prices can change quickly; manage risk carefully.
#BTC #BTCUSDT #Bitcoin #CryptoMarket #TechnicalAnalysisPost
{spot}(BTCUSDT)
📊 BTC/USDT — CAUTIOUS MARKET OUTLOOK
🪙 Reference Price: 79,674.6 USDT (from the shared chart)
📉 Short-Term Trend: Slightly bearish momentum is visible on the 5-minute timeframe.
🛡️ Key Support: 79,600 USDT — watch for a confirmed break below this level.
🎯 Resistance Zone: 79,730–79,900 USDT — a sustained move above this zone may indicate a potential recovery.
⚖️ Market Outlook: Direction remains uncertain. Wait for price-action and volume confirmation before considering a trade.
⚠️ This is a snapshot-based analysis, not a guaranteed prediction. Prices can change quickly; manage risk carefully.
#BTC #BTCUSDT #Bitcoin #CryptoMarket #TechnicalAnalysisPost
🪙 Reference Price: 79,674.6 USDT (from the shared chart)
📉 Short-Term Trend: Slightly bearish momentum is visible on the 5-minute timeframe.
🛡️ Key Support: 79,600 USDT — watch for a confirmed break below this level.
🎯 Resistance Zone: 79,730–79,900 USDT — a sustained move above this zone may indicate a potential recovery.
⚖️ Market Outlook: Direction remains uncertain. Wait for price-action and volume confirmation before considering a trade.
⚠️ This is a snapshot-based analysis, not a guaranteed prediction. Prices can change quickly; manage risk carefully.
#BTC #BTCUSDT #Bitcoin #CryptoMarket #TechnicalAnalysisPost
74
·
--
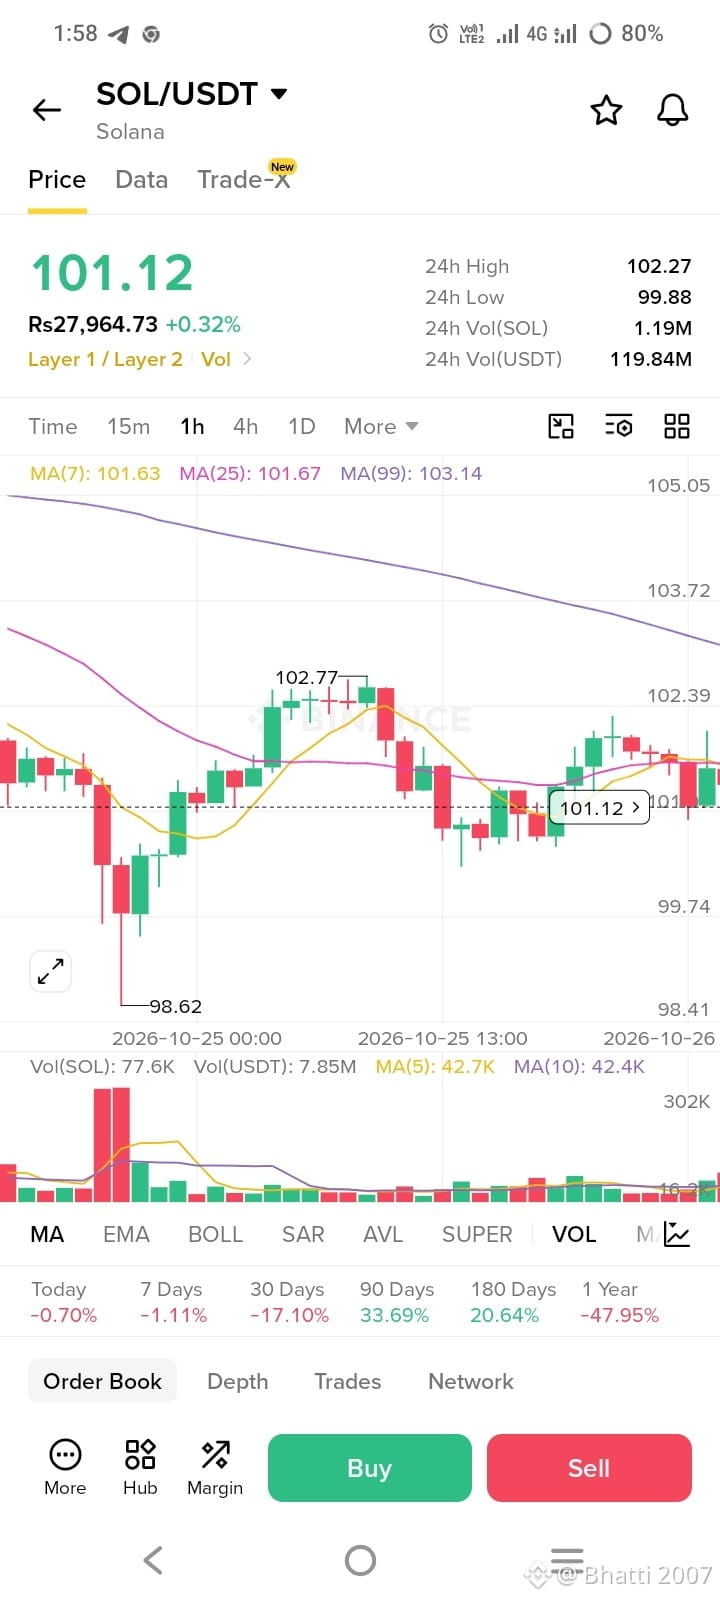
🚀 SOLANA (SOL) — THE NEXT BIG MOVE? 📈🔥
⚡ Solana is on every crypto trader’s watchlist!
📊 Watch key resistance levels, trading volume, and momentum for the next potential breakout.
💎 Will SOL make a powerful move? Keep watching the charts! 👀
#Solana #SOL #Crypto #Altcoins #Binance #CryptoTrading #BullishTrend
{spot}(SOLUSDT)
🚀 SOLANA (SOL) — THE NEXT BIG MOVE? 📈🔥
⚡ Solana is on every crypto trader’s watchlist!
📊 Watch key resistance levels, trading volume, and momentum for the next potential breakout.
💎 Will SOL make a powerful move? Keep watching the charts! 👀
#Solana #SOL #Crypto #Altcoins #Binance #CryptoTrading #BullishTrend
⚡ Solana is on every crypto trader’s watchlist!
📊 Watch key resistance levels, trading volume, and momentum for the next potential breakout.
💎 Will SOL make a powerful move? Keep watching the charts! 👀
#Solana #SOL #Crypto #Altcoins #Binance #CryptoTrading #BullishTrend

80
·
--
උසබ තත්ත්වය
200

·
--
උසබ තත්ත්වය
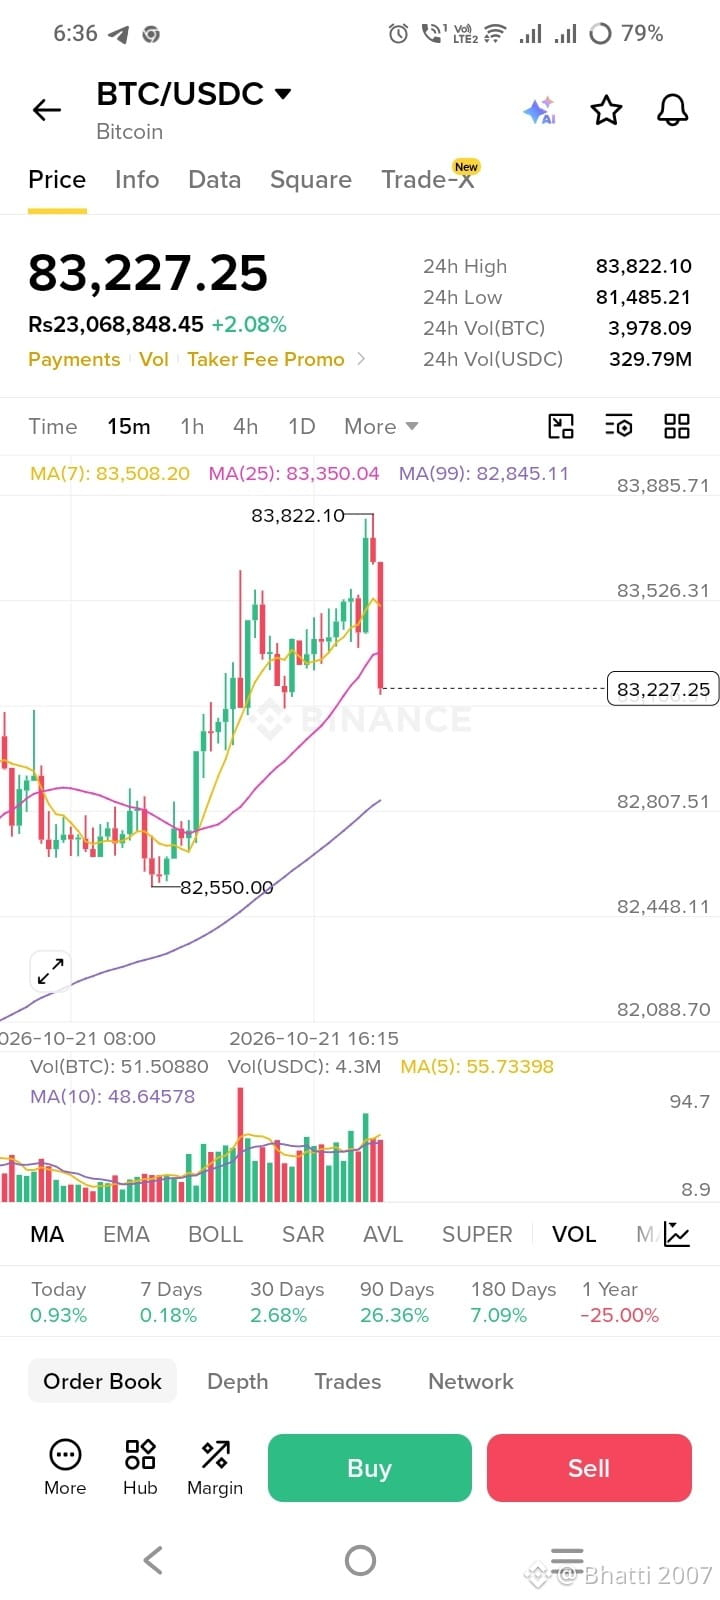
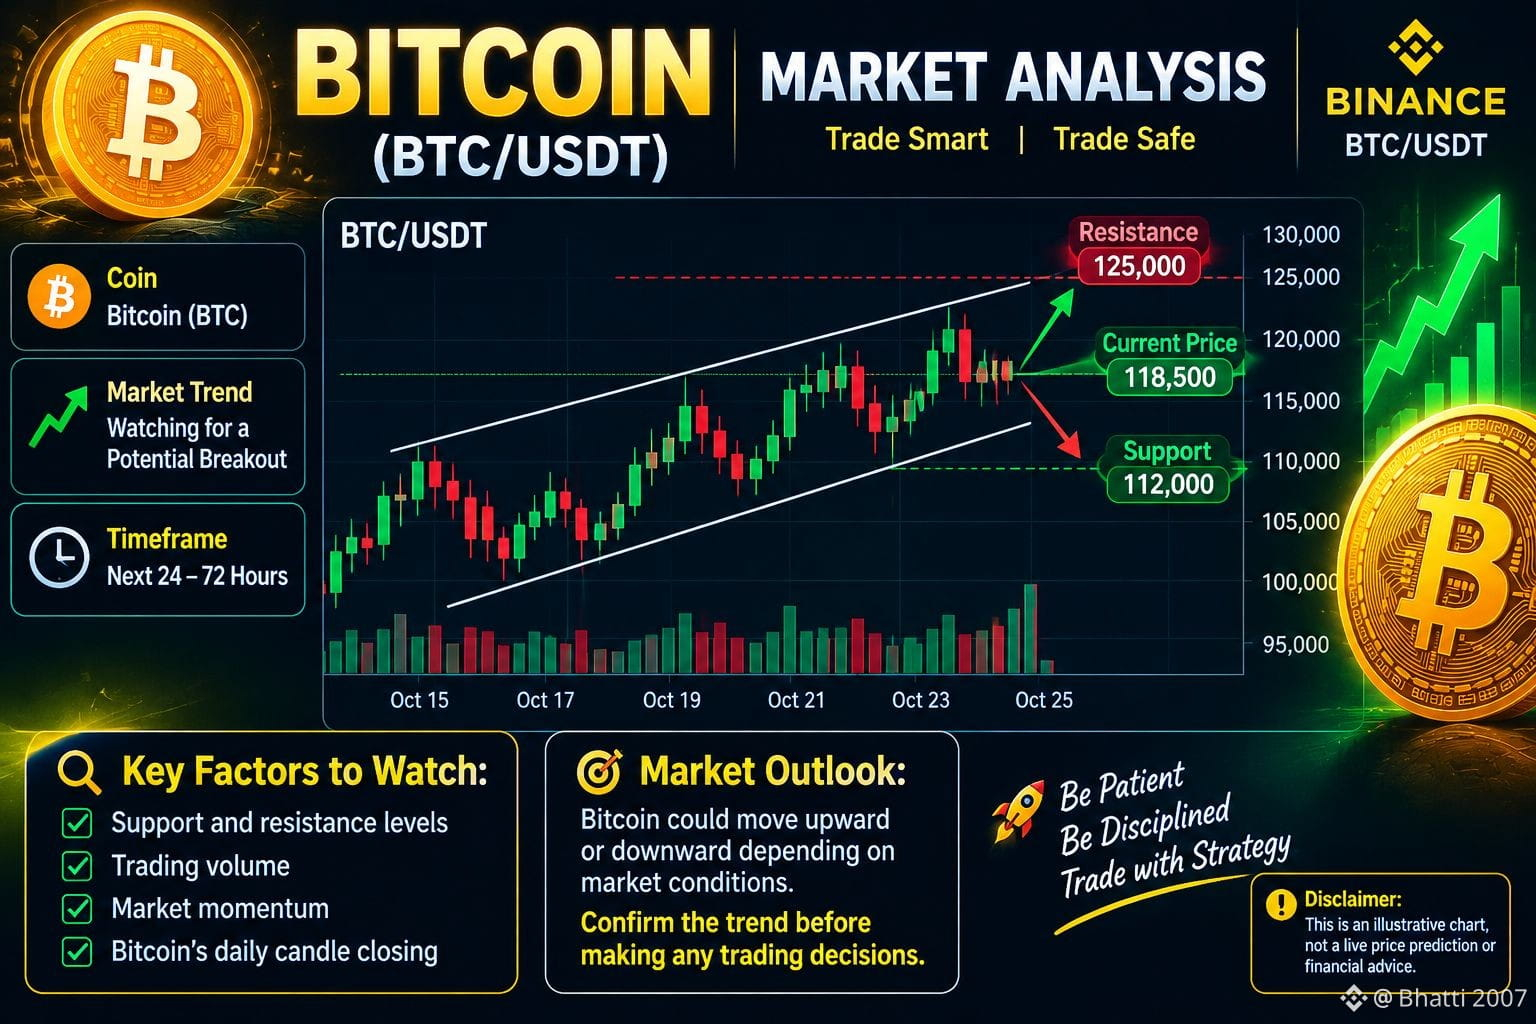
یہ رہا Bitcoin کے لیے ایک اچھا سا English گراف، جسے آپ Binance پر پوسٹ کر سکتے ہیں۔ 📊
{spot}(BTCUSDT)
یہ رہا Bitcoin کے لیے ایک اچھا سا English گراف، جسے آپ Binance پر پوسٹ کر سکتے ہیں۔ 📊
80
·
--
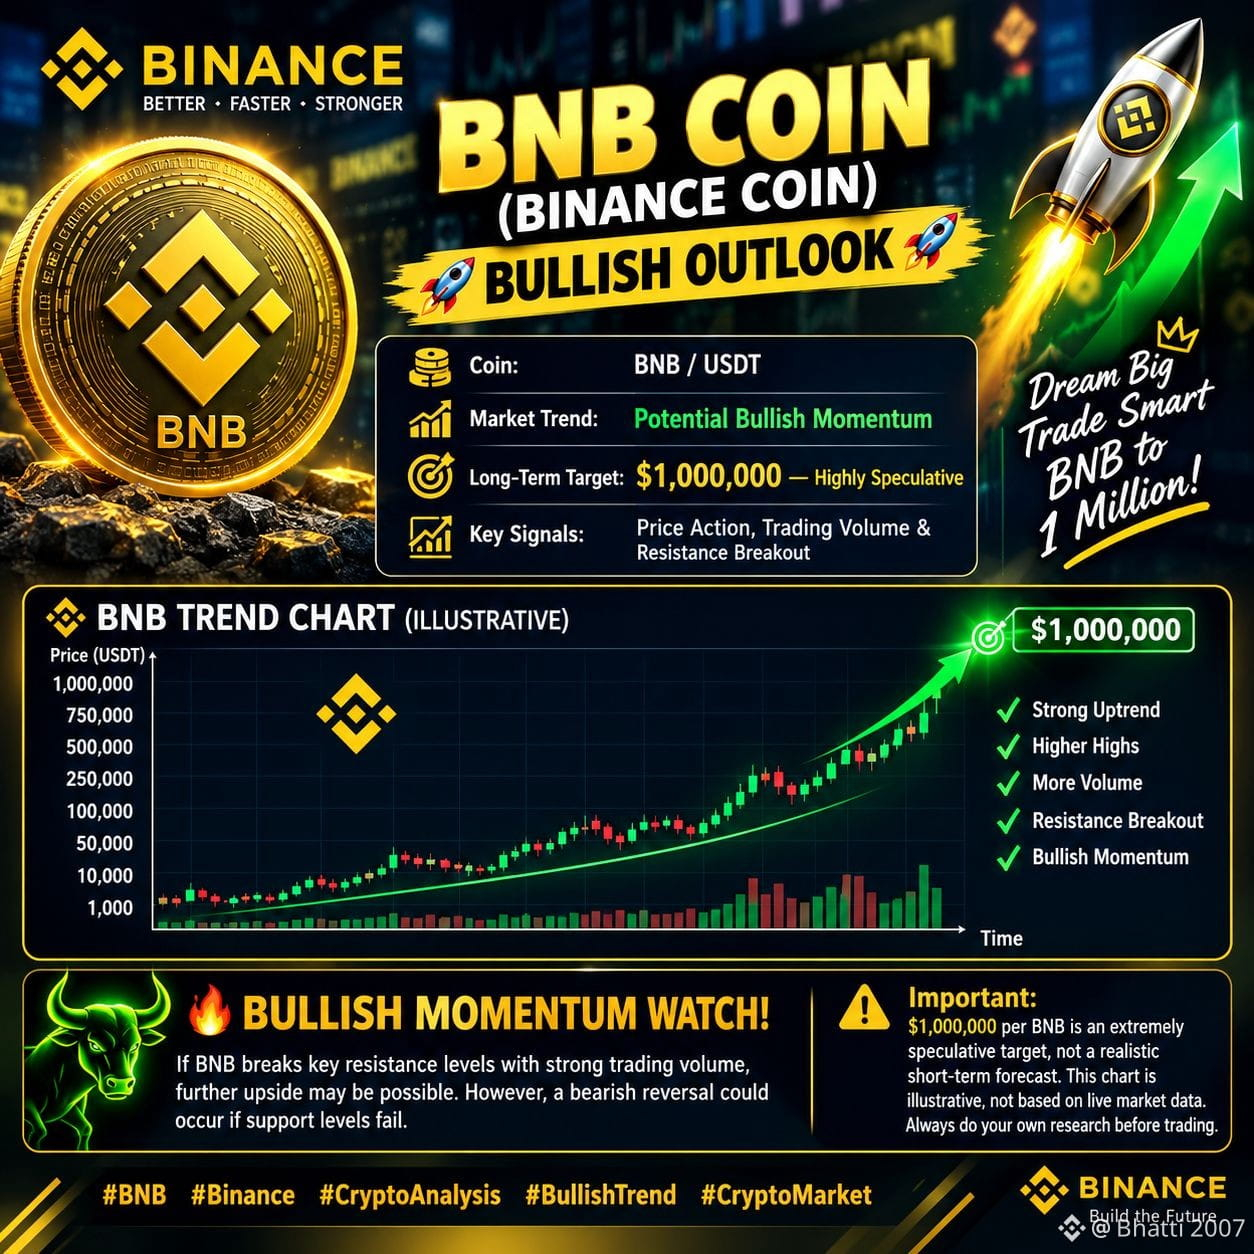
🚀 BNB COIN (BINANCE COIN) — BULLISH OUTLOOK 🚀
🪙 Coin: BNB / USDT
📊 Market Trend: Potential Bullish Momentum
🎯 Long-Term Target: $1,000,000 — Highly Speculative
📈 Key Signals: Price Action, Trading Volume & Resistance Breakout
📊 BNB TREND CHART (ILLUSTRATIVE)
Price │ 🚀 │ ●──── │ ●─── │ ●─── │ ●─── │ ●─── │ ●── └────────────────────────── Time
🔥 BULLISH MOMENTUM WATCH!
If BNB breaks key resistance levels with strong trading volume, further upside may be possible. However, a bearish reversal could occur if support levels fail.
⚠️ Important: $1,000,000 per BNB is an extremely speculative target, not a realistic short-term forecast. This chart is illustrative, not based on live market data. Always do your own research before trading.
#BNB #Binance #CryptoAnalysis #BullishTrend #CryptoMarket
🚀 BNB COIN (BINANCE COIN) — BULLISH OUTLOOK 🚀
🪙 Coin: BNB / USDT
📊 Market Trend: Potential Bullish Momentum
🎯 Long-Term Target: $1,000,000 — Highly Speculative
📈 Key Signals: Price Action, Trading Volume & Resistance Breakout
📊 BNB TREND CHART (ILLUSTRATIVE)
Price │ 🚀 │ ●──── │ ●─── │ ●─── │ ●─── │ ●─── │ ●── └────────────────────────── Time
🔥 BULLISH MOMENTUM WATCH!
If BNB breaks key resistance levels with strong trading volume, further upside may be possible. However, a bearish reversal could occur if support levels fail.
⚠️ Important: $1,000,000 per BNB is an extremely speculative target, not a realistic short-term forecast. This chart is illustrative, not based on live market data. Always do your own research before trading.
#BNB #Binance #CryptoAnalysis #BullishTrend #CryptoMarket
🪙 Coin: BNB / USDT
📊 Market Trend: Potential Bullish Momentum
🎯 Long-Term Target: $1,000,000 — Highly Speculative
📈 Key Signals: Price Action, Trading Volume & Resistance Breakout
📊 BNB TREND CHART (ILLUSTRATIVE)
Price │ 🚀 │ ●──── │ ●─── │ ●─── │ ●─── │ ●─── │ ●── └────────────────────────── Time
🔥 BULLISH MOMENTUM WATCH!
If BNB breaks key resistance levels with strong trading volume, further upside may be possible. However, a bearish reversal could occur if support levels fail.
⚠️ Important: $1,000,000 per BNB is an extremely speculative target, not a realistic short-term forecast. This chart is illustrative, not based on live market data. Always do your own research before trading.
#BNB #Binance #CryptoAnalysis #BullishTrend #CryptoMarket
1
83

·
--
උසබ තත්ත්වය
DOGE 🐕 🐕 🐕
{spot}(DOGEUSDT)
🤑🤑🤑🤑🤑🤑🤑🤑Sure, translating it now. Here it is in English, ready to screenshot for Binance
DOGE 🐕 🐕 🐕
🤑🤑🤑🤑🤑🤑🤑🤑Sure, translating it now. Here it is in English, ready to screenshot for Binance
🤑🤑🤑🤑🤑🤑🤑🤑Sure, translating it now. Here it is in English, ready to screenshot for Binance

1
97

තවත් අන්තර්ගතයන් ගවේෂණය කිරීමට ඇතුල් වන්න
Binance චතුරශ්රය හි ගෝලීය ක්රිප්ටෝ පරිශීලකයින් හා එක්වන්න
⚡️ ක්රිප්ටෝ පිළිබඳ නවතම සහ ප්රයෝජනවත් තොරතුරු ලබා ගන්න.
💬 ලොව විශාලතම ක්රිප්ටෝ හුවමාරුව මගින් විශ්වාස කෙරේ.
👍 සත්යායනය කරන ලද නිර්මාණකරුවන්ගෙන් සැබෑ විදසුන් සොයා ගන්න.
විද්යුත් තැපෑල / දුරකථන අංකය
නැගී එන මාතෘකා
KeplrAdvisesSocialLoginUsersToTransferAssets
160 නැරඹීම්
26 සාකච්ඡා කරමින්
🚨 Keplr Wallet Security Update
🔓 Some Google and Apple login wallets were affected by a security breach.
💰 Users' crypto funds may be at risk.$ATOM
🚫 Google and Apple login are temporarily suspended.$OSMO
🛡️ Keplr advises affected users to move their remaining funds to a new secure wallet.
😟 Full recovery of stolen funds is not confirmed yet.$INJ
📢 Important: If you use Google or Apple login for Keplr, secure your funds as soon as possible. 🔐
#KeplrAdvisesSocialLoginUsersToTransferAssets
HamzaEarns
·0 කැමත්ත දැක්වීම්
·16 නැරඹීම්
TetherPlans€28.8MForJuventusCapitalIncrease
229 නැරඹීම්
26 සාකච්ඡා කරමින්
JobsReportRaisesHikeOdds
624,023 නැරඹීම්
3,864 සාකච්ඡා කරමින්