🧩 The last time the chart looked like this…
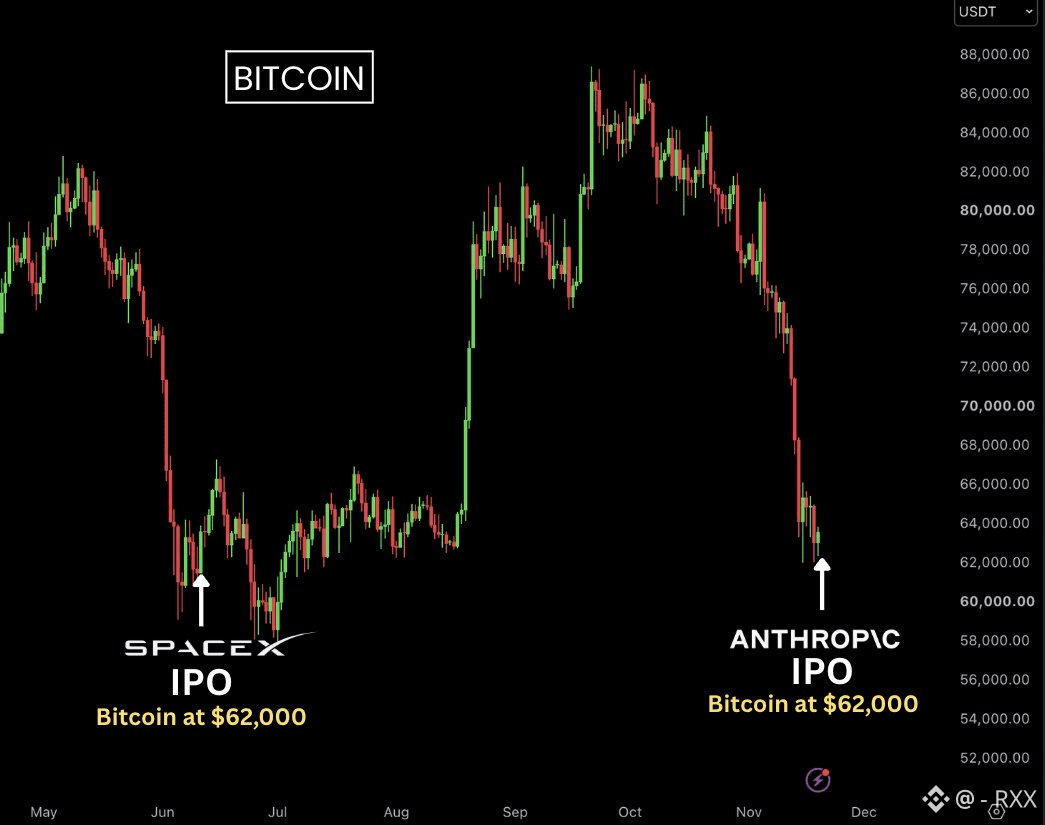
Ash Crypto compared Bitcoin’s Nov. 19 dip with an earlier setup around a major IPO. When two charts look alike, find the first level where the comparison could fall apart.
Open $BTC on the daily chart. Mark the high and low of the range that formed after the dip, then watch where the next close lands. Check $ETH and $EVAA over the same stretch. Have they started reclaiming their own ranges, or are they still putting in lower highs?
Which would make you take the BTC setup more seriously: a daily close above the range, or both alts breaking out with it?
#Bitcoin #TechnicalAnalysis #PriceAction
Ash Crypto compared Bitcoin’s Nov. 19 dip with an earlier setup around a major IPO. When two charts look alike, find the first level where the comparison could fall apart.
Open $BTC on the daily chart. Mark the high and low of the range that formed after the dip, then watch where the next close lands. Check $ETH and $EVAA over the same stretch. Have they started reclaiming their own ranges, or are they still putting in lower highs?
Which would make you take the BTC setup more seriously: a daily close above the range, or both alts breaking out with it?
#Bitcoin #TechnicalAnalysis #PriceAction