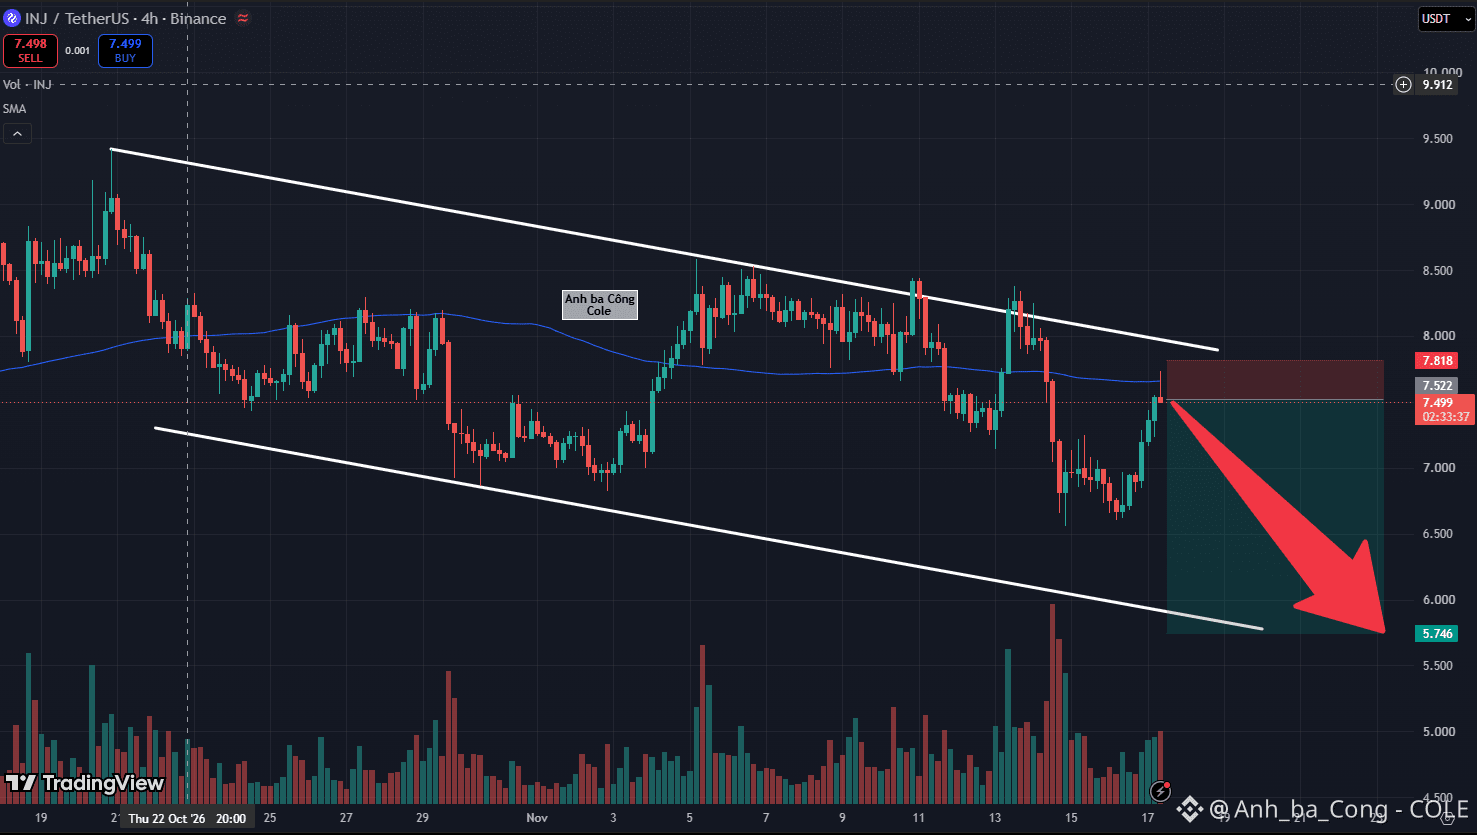
False Breakout Trap Ahead: INJ Rallies Into MA100 and Upper Channel Ceiling on 4H, Short Setup to 5.74 USD Locked In?
Traders chasing green relief candles as INJ pushes toward 7.50 USD need to step back and evaluate the structural reality on the 4H chart right now! Viewed objectively, this upward push is marching straight into a graveyard of failed bullish breakout attempts.
Let's dissect the technical tape:
The descending parallel channel spanning multiple weeks continues to act as an iron ceiling capping every recovery wave.
Right at current levels (7.499 USD), the dynamic blue MA100 moving average and the upper channel boundary converge to form a formidable dual-resistance wall.
History confirms that price has already printed at least two distinct false breakouts here before suffering severe downside continuation!
Market tape across major exchanges reveals that buying volume on this bounce is steadily evaporating. When retail traders FOMO-buy directly into multi-layered overhead resistance, smart money is primed to trigger trend-following Short positions, driving price back down toward the lower channel boundary at 5.746 USD!
Actionable execution setup:
Position: Trend-continuation Short entry around the 7.45 – 7.55 USD resistance zone.
Take-Profit Target (TP): Lower descending channel boundary at 5.746 USD (over 23% downside potential).
Protective Stop-Loss (SL): 7.818 USD (safely positioned above the dual-resistance ceiling and prior false breakout highs).
Risk-to-Reward Ratio: Outstanding asymmetry, risking roughly 0.32 points to capture an expansive 1.75-point decline!
What is your read on INJ's MA100 resistance? Will history repeat with another sharp rejection from this false breakout zone? Share your perspective in the comments below!
DYOR $INJ
Traders chasing green relief candles as INJ pushes toward 7.50 USD need to step back and evaluate the structural reality on the 4H chart right now! Viewed objectively, this upward push is marching straight into a graveyard of failed bullish breakout attempts.
Let's dissect the technical tape:
The descending parallel channel spanning multiple weeks continues to act as an iron ceiling capping every recovery wave.
Right at current levels (7.499 USD), the dynamic blue MA100 moving average and the upper channel boundary converge to form a formidable dual-resistance wall.
History confirms that price has already printed at least two distinct false breakouts here before suffering severe downside continuation!
Market tape across major exchanges reveals that buying volume on this bounce is steadily evaporating. When retail traders FOMO-buy directly into multi-layered overhead resistance, smart money is primed to trigger trend-following Short positions, driving price back down toward the lower channel boundary at 5.746 USD!
Actionable execution setup:
Position: Trend-continuation Short entry around the 7.45 – 7.55 USD resistance zone.
Take-Profit Target (TP): Lower descending channel boundary at 5.746 USD (over 23% downside potential).
Protective Stop-Loss (SL): 7.818 USD (safely positioned above the dual-resistance ceiling and prior false breakout highs).
Risk-to-Reward Ratio: Outstanding asymmetry, risking roughly 0.32 points to capture an expansive 1.75-point decline!
What is your read on INJ's MA100 resistance? Will history repeat with another sharp rejection from this false breakout zone? Share your perspective in the comments below!
DYOR $INJ