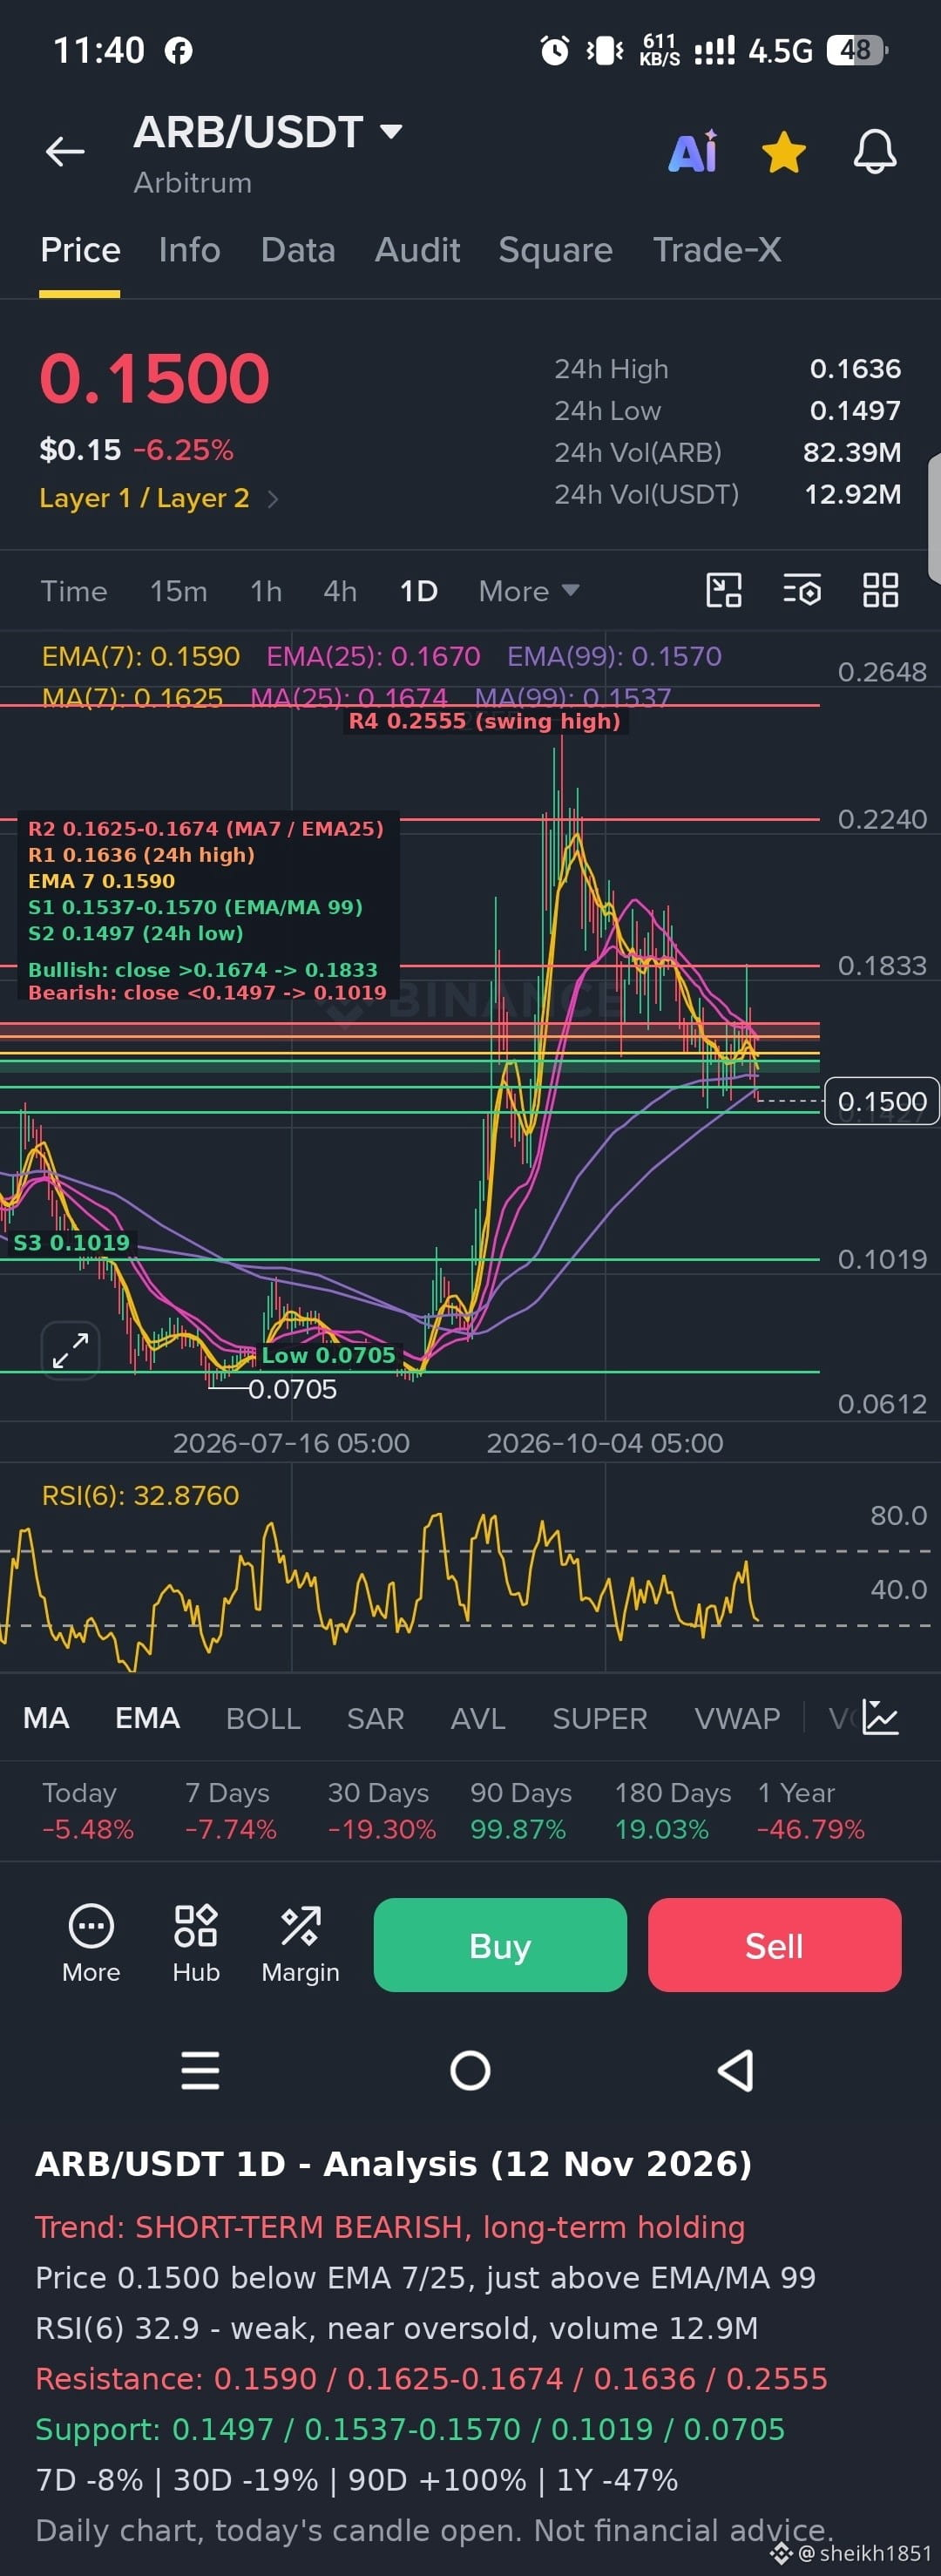
$ARB ARB/USDT (1D) – Quick Analysis
This is the daily chart, so these levels move more slowly than the 1H screenshots. Today's candle is still open, so the -6.25% move can change.
Trend: Bearish in the short term. Price (0.1500) is below EMA(7) 0.1590 and EMA(25) 0.1670, and both are sloping down. It is just above EMA(99) 0.1570 and MA(99) 0.1537, but those are still rising, so the long-term trend is holding up. After the rally from the 0.0705 low to the 0.2555 peak, price has given back a big part of that move. Over longer periods it is up about 100% over 90 days and 19% over 180 days, but down about 8% over 7 days, 19% over 30 days and 47% over one year.
Momentum:RSI(6) is about 32.9, which is weak and near oversold. That raises the chance of a relief bounce, but in a downtrend RSI can stay low for a while. Volume is moderate (about 12.9M USDT), so the selling is steady rather than panicked.
Key levels:
Resistance: 0.1590 (EMA 7), then 0.1625 to 0.1674 (MA 7 and the 25 averages), then 0.1636 (24h high) and the 0.2555 peak.
Support: 0.1497 (24h low), then 0.1537 to 0.1570 (the 99 averages), then 0.1427 and 0.1019 on the chart. Below that, the 0.0705 low is the key level.
Outlook: The bias is bearish while price is under 0.1590. A bounce into 0.1590 to 0.1625 is the likeliest near-term move, and that zone would probably act as resistance. A daily close below 0.1497 would put the 0.1537 to 0.1570 support area under pressure, and losing it would open the path toward 0.1019. A bullish shift needs a daily close above 0.1674.
This is a technical read not financial advice. Use stop-losses and keep position sizes small.
#Binance #ARB
This is the daily chart, so these levels move more slowly than the 1H screenshots. Today's candle is still open, so the -6.25% move can change.
Trend: Bearish in the short term. Price (0.1500) is below EMA(7) 0.1590 and EMA(25) 0.1670, and both are sloping down. It is just above EMA(99) 0.1570 and MA(99) 0.1537, but those are still rising, so the long-term trend is holding up. After the rally from the 0.0705 low to the 0.2555 peak, price has given back a big part of that move. Over longer periods it is up about 100% over 90 days and 19% over 180 days, but down about 8% over 7 days, 19% over 30 days and 47% over one year.
Momentum:RSI(6) is about 32.9, which is weak and near oversold. That raises the chance of a relief bounce, but in a downtrend RSI can stay low for a while. Volume is moderate (about 12.9M USDT), so the selling is steady rather than panicked.
Key levels:
Resistance: 0.1590 (EMA 7), then 0.1625 to 0.1674 (MA 7 and the 25 averages), then 0.1636 (24h high) and the 0.2555 peak.
Support: 0.1497 (24h low), then 0.1537 to 0.1570 (the 99 averages), then 0.1427 and 0.1019 on the chart. Below that, the 0.0705 low is the key level.
Outlook: The bias is bearish while price is under 0.1590. A bounce into 0.1590 to 0.1625 is the likeliest near-term move, and that zone would probably act as resistance. A daily close below 0.1497 would put the 0.1537 to 0.1570 support area under pressure, and losing it would open the path toward 0.1019. A bullish shift needs a daily close above 0.1674.
This is a technical read not financial advice. Use stop-losses and keep position sizes small.
#Binance #ARB