

📊 BTCUSDT – Bearish Triangle Breakdown & Downside Expansion Setup
🔍 Market Overview
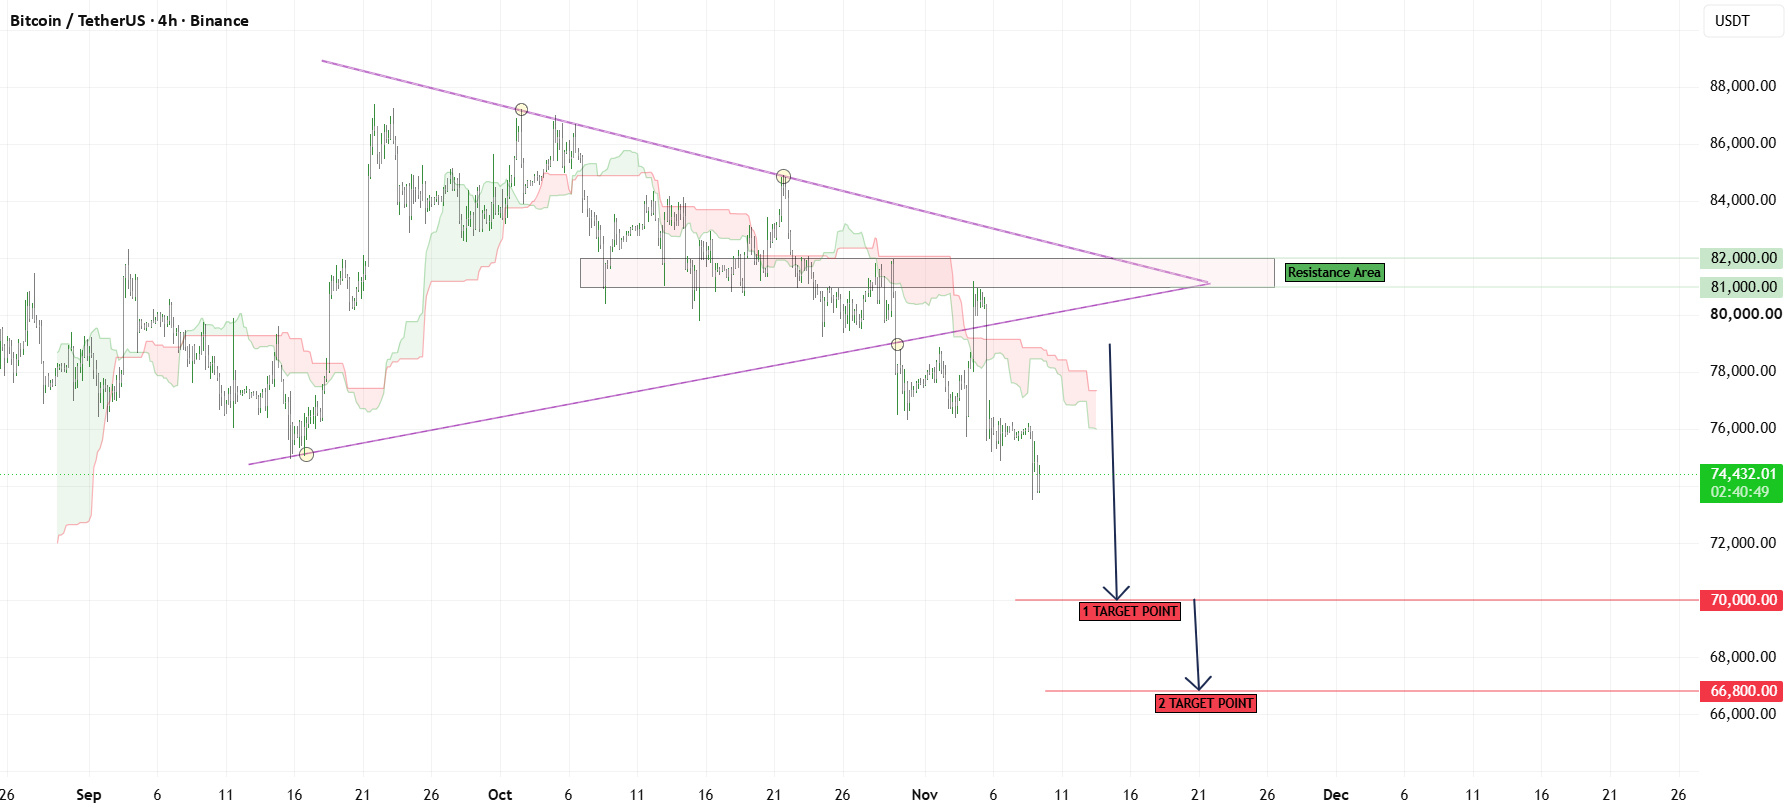
Bitcoin has experienced a decisive breakdown from its previous symmetrical triangle formation on the 4H timeframe. Price failed to maintain the ascending support trendline and subsequently moved below the Ichimoku Cloud, indicating a shift in short-term market sentiment.
The breakdown suggests that sellers are gaining control, while the previous triangle structure has now turned into a potential bearish continuation pattern. Unless BTC quickly reclaims the broken support structure, further downside pressure may develop toward the next projected levels.
📈 Market Structure Insight
* Market Bias: Bearish
* Momentum: Weakening & Selling Pressure Increasing
* Current Phase: Confirmed Triangle Breakdown
* Key Resistance: 81,000–82,000
* Immediate Structure: Broken Ascending Support Trendline
The loss of ascending trendline support, combined with rejection from the previous consolidation zone, indicates weakening bullish structure. The Ichimoku Cloud is also acting as overhead resistance, reinforcing the current bearish outlook.
🚀 Trading Scenarios
❌ Bearish Scenario (Primary Bias)
Conditions:
* Price remains below the broken triangle support.
* Sellers maintain control beneath the 76,000–77,000 region.
* The Ichimoku Cloud continues to act as resistance.
* Bearish momentum extends toward lower support levels.
Trade Plan:
Look for potential selling opportunities on a weak recovery or a retest of the broken support structure. A confirmed bearish continuation could accelerate the downside move.
🎯 Target 1: 70,000
🎯 Target 2: 66,800
✅ Bullish Invalidation Scenario
A strong recovery above the broken triangle structure could weaken the bearish outlook. BTC would need to reclaim the 81,000–82,000 resistance zone and establish sustained acceptance above it to suggest a possible shift back toward bullish momentum.
Until that happens, recovery attempts may face selling pressure.
📍 Key Levels to Monitor
🔴 Immediate Resistance: 76,000–77,000
🔴 Major Resistance: 81,000–82,000
🔴 Target 1: 70,000
🔴 Target 2: 66,800
⚡ Trading Perspective
BTC has moved below a major consolidation structure, shifting attention toward the downside objectives. The primary focus is whether sellers can maintain control beneath the broken ascending trendline.
A continuation below the recent lows could open the path toward 70,000, followed by 66,800.
However, traders should remain alert for temporary relief rallies and possible retests before expecting further downside continuation.
🧠 Professional Insight
This bearish setup is supported by:
* Breakdown below the symmetrical triangle structure.
* Loss of the ascending support trendline.
* Price trading beneath the Ichimoku Cloud.
* Increasing selling pressure following the breakdown.
* Previous support zone potentially turning into resistance.
* Clearly defined downside objectives at 70,000 and 66,800.
Preferred Approach: Avoid chasing the current downward move. Wait for a corrective pullback and bearish confirmation before considering a short position.
🛡️ Risk Management
* Risk only 1–2% of trading capital per position.
* Wait for confirmation before entering a trade.
* Define stop-loss levels above the invalidation structure.
* Avoid excessive leverage during volatile conditions.
* Maintain disciplined position sizing.
* Do not chase extended bearish candles without confirmation.
Disclaimer: This market analysis is provided for educational purposes only and should not be considered financial or investment advice