Ethereum (ETH) Technical Analysis 🚀
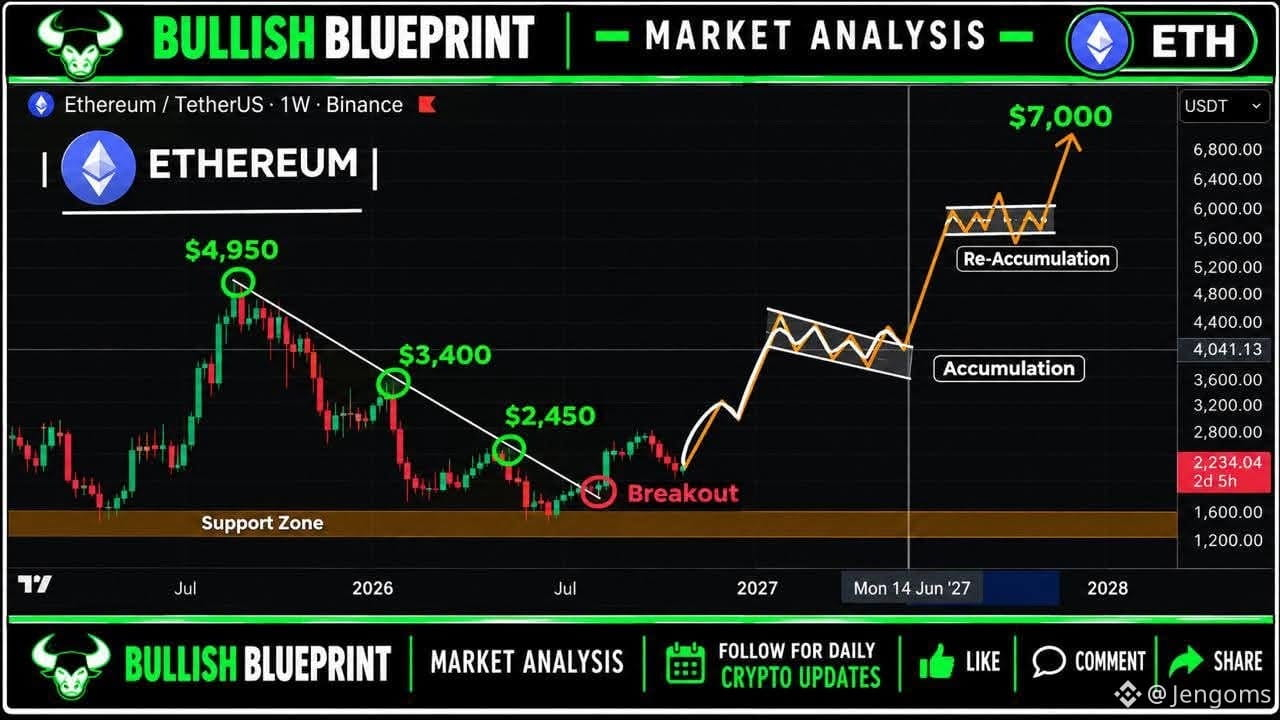
This chart highlights ETH breaking above a long-term descending resistance trendline, with the support zone around $1,200–$1,600 acting as a key area. If bullish momentum continues, the chart outlines potential resistance near $2,450, $3,400, and $4,950, followed by a longer-term projected target of $7,000. These levels represent a possible scenario, not a guarantee; confirmation and proper risk management are essential.
🔥 What happens next could surprise most traders.
The full breakdown is waiting in our bio.✅
NFA – This is not financial advice.
#Ethereum #ETH
This chart highlights ETH breaking above a long-term descending resistance trendline, with the support zone around $1,200–$1,600 acting as a key area. If bullish momentum continues, the chart outlines potential resistance near $2,450, $3,400, and $4,950, followed by a longer-term projected target of $7,000. These levels represent a possible scenario, not a guarantee; confirmation and proper risk management are essential.
🔥 What happens next could surprise most traders.
The full breakdown is waiting in our bio.✅
NFA – This is not financial advice.
#Ethereum #ETH