ADA/USDT Market Analysis & Trade Plan
Technical Breakdown
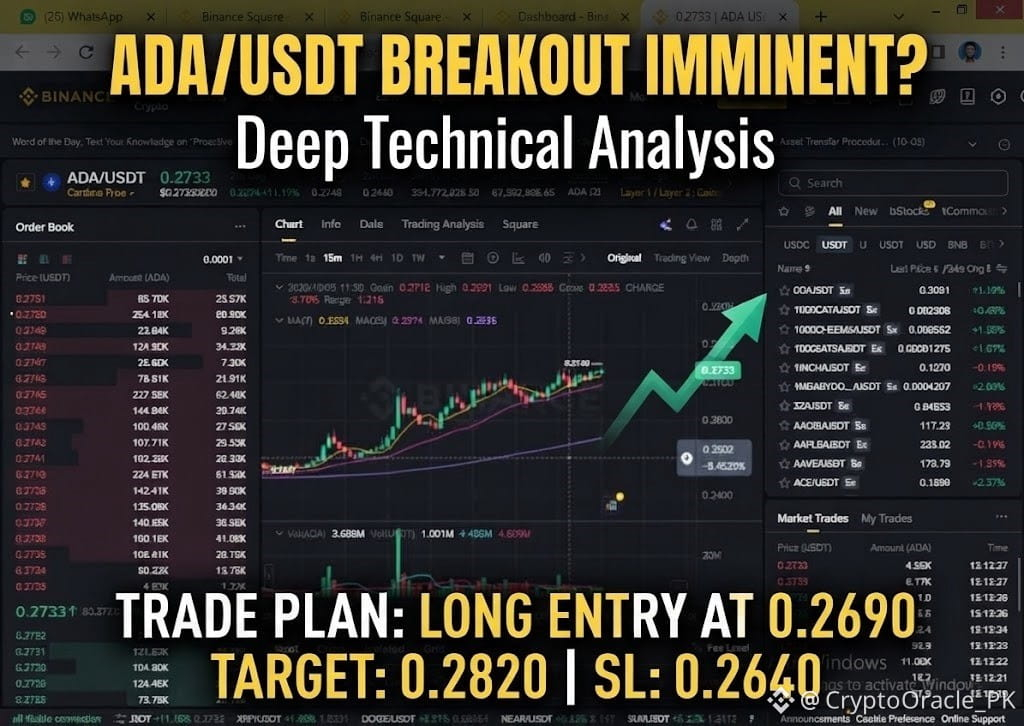
Current Price Action: $ADA
is trading at 0.2733 USDT, registering a strong 24-hour gain of +11.19% within a daily high-low range between 0.2440 and 0.2748.
Moving Averages (15m Chart):
MA(7) is positioned at 0.2691.
MA(25) is positioned at 0.2674.
MA(99) is positioned at 0.2536.
Interpretation: Short-term moving averages are fanned out in a bullish alignment above the medium and long-term averages, reflecting strong upward momentum.
Volume Dynamics: Recent 15m candles show substantial volume spikes accompanying the push toward the upper boundary, though minor red candles indicate some localized profit-taking near the 0.2748 peak.
Order Book Structure: There is notable sell wall density sitting around the 0.2748 – 0.2750 region, while thick buying support clusters reside lower down in the 0.2720 – 0.2730 zone.
Reactive Trade Setup
Given the strong impulsive move (+11.19%), chasing the asset directly at the highs carries heightened correction risk. Instead, a reactive approach waiting for a minor pullback to support or a confirmed breakout is optimal.
Scenario A: Pullback Entry (Long Setup)
Entry Zone: 0.2680 – 0.2695 USDT
Take-Profit Targets:
Target 1: 0.2748 USDT (recent 24h high resistance)
Target 2: 0.2820 USDT
Stop Loss: 0.2640 USDT (below the recent local swing low structure).
Scenario B: Breakout Continuation Setup
Entry Trigger: Clean 15-minute candle close above 0.2750 USDT with sustained volume.
Take-Profit Targets:
Target 1: 0.2850 USDT
Target 2: 0.2950 USDT
Stop Loss: 0.2710 USDT (just below the breakout level).
Technical Breakdown
Current Price Action: $ADA
is trading at 0.2733 USDT, registering a strong 24-hour gain of +11.19% within a daily high-low range between 0.2440 and 0.2748.
Moving Averages (15m Chart):
MA(7) is positioned at 0.2691.
MA(25) is positioned at 0.2674.
MA(99) is positioned at 0.2536.
Interpretation: Short-term moving averages are fanned out in a bullish alignment above the medium and long-term averages, reflecting strong upward momentum.
Volume Dynamics: Recent 15m candles show substantial volume spikes accompanying the push toward the upper boundary, though minor red candles indicate some localized profit-taking near the 0.2748 peak.
Order Book Structure: There is notable sell wall density sitting around the 0.2748 – 0.2750 region, while thick buying support clusters reside lower down in the 0.2720 – 0.2730 zone.
Reactive Trade Setup
Given the strong impulsive move (+11.19%), chasing the asset directly at the highs carries heightened correction risk. Instead, a reactive approach waiting for a minor pullback to support or a confirmed breakout is optimal.
Scenario A: Pullback Entry (Long Setup)
Entry Zone: 0.2680 – 0.2695 USDT
Take-Profit Targets:
Target 1: 0.2748 USDT (recent 24h high resistance)
Target 2: 0.2820 USDT
Stop Loss: 0.2640 USDT (below the recent local swing low structure).
Scenario B: Breakout Continuation Setup
Entry Trigger: Clean 15-minute candle close above 0.2750 USDT with sustained volume.
Take-Profit Targets:
Target 1: 0.2850 USDT
Target 2: 0.2950 USDT
Stop Loss: 0.2710 USDT (just below the breakout level).