
$YFI — Market Signal Update
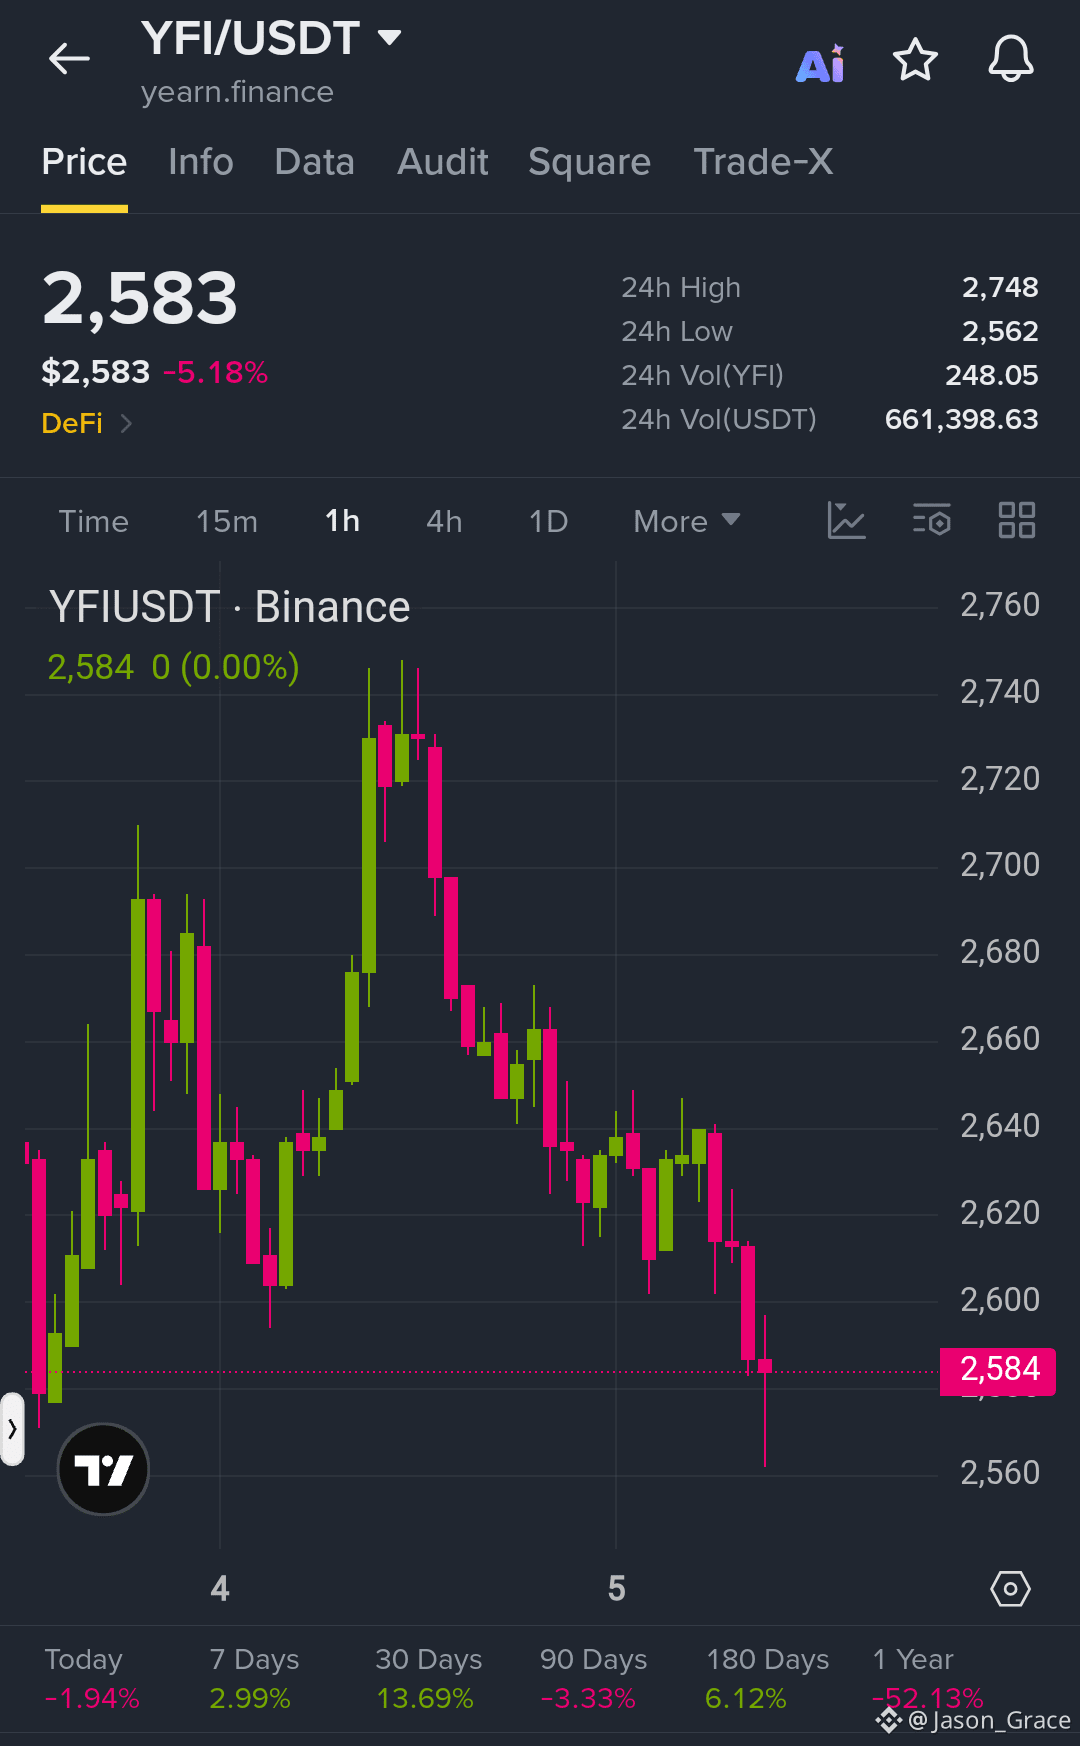
$YFI is trading around $2,583, down about 5.18% on the session. The 1H chart shows a clear pullback from the $2,740–$2,750 area, with price now testing the $2,560–$2,580 support zone. A sustained move below this area could expose the next downside region near $2,520, while recovery above $2,620–$2,640 would be the first sign of improving short-term structure. The next resistance areas are $2,680 and $2,720–$2,750. These are technical levels to watch rather than guaranteed targets.
$YFI
#DriftHackVictimsBeginClaims #EthereumValidatorExitQueueJumps392% #SECHaltsCryptoETFReviewsAmidFundingLapse #FedOctoberRateHikeOddsFallTo17%
$YFI is trading around $2,583, down about 5.18% on the session. The 1H chart shows a clear pullback from the $2,740–$2,750 area, with price now testing the $2,560–$2,580 support zone. A sustained move below this area could expose the next downside region near $2,520, while recovery above $2,620–$2,640 would be the first sign of improving short-term structure. The next resistance areas are $2,680 and $2,720–$2,750. These are technical levels to watch rather than guaranteed targets.
$YFI
#DriftHackVictimsBeginClaims #EthereumValidatorExitQueueJumps392% #SECHaltsCryptoETFReviewsAmidFundingLapse #FedOctoberRateHikeOddsFallTo17%