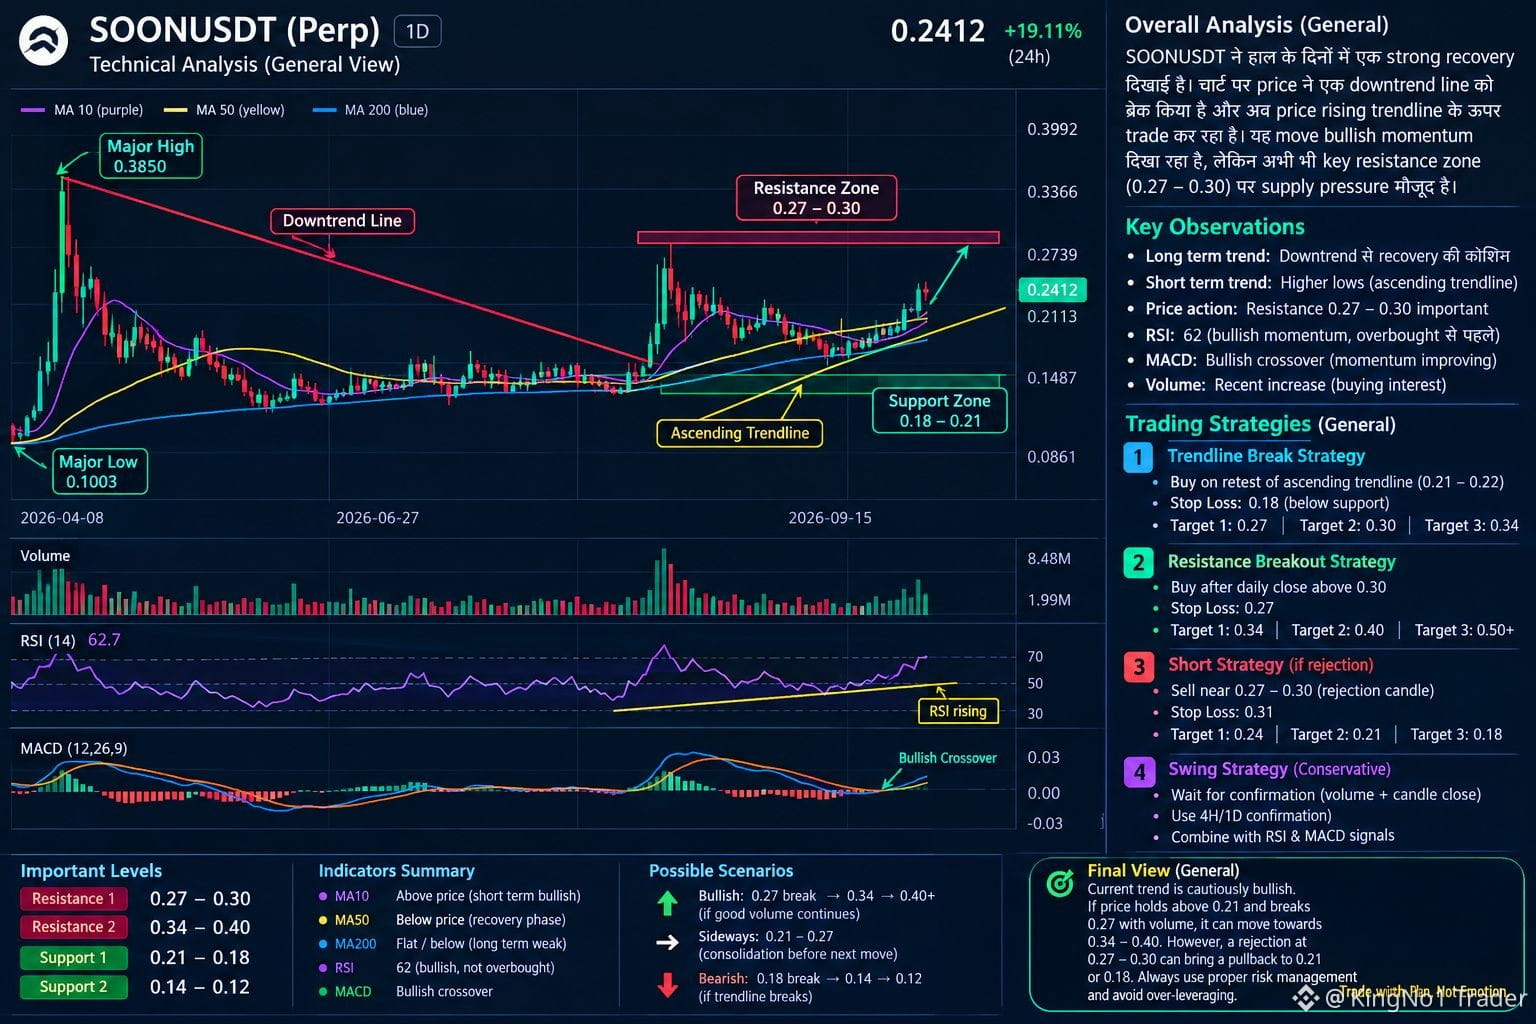
$SOON Current price shown: ~$0.2412
24H change: +19.11%
Market structure: Bullish recovery, but approaching major resistance
1. Trend Structure
Price has broken above the previous descending trendline.
A new ascending trendline is developing from the recent lows.
Structure is forming higher lows + higher highs, which supports a bullish short/medium-term bias.
However, the larger structure still needs confirmation above the major resistance area.
2. Key Support & Resistance
Level
Role
$0.27–0.30
Major resistance zone
$0.24–0.25
Current breakout area
$0.21–0.22
Important support
$0.18–0.20
Stronger support
$0.14–0.15
Major downside support
$0.10
Previous major low
3. RSI
The chart's RSI(6) is around 88, which is very high.
That means:
Strong buying momentum
But the market is short-term overbought
A pullback/consolidation before another move higher is possible.
So I would not treat the current candle alone as a safe entry signal.
4. Volume
Recent volume has increased together with the price rise.
That's important because a breakout accompanied by increasing volume generally has more confirmation than a breakout on weak volume.
The key question now is whether volume remains strong if price approaches $0.27–$0.30.
5. Main Strategies
Strategy A — Trendline Retest
Wait for price to pull back toward $0.21–$0.22.
Look for bullish rejection/confirmation.
Invalidation: sustained break below the rising trendline/support.
Potential upside areas: $0.27 → $0.30 → $0.34
Strategy B — Resistance Breakout
Watch $0.27–$0.30 carefully.
A strong daily close above the zone with volume would provide stronger breakout confirmation.
Possible next areas: $0.34–$0.40.
Strategy C — Resistance Rejection
If price reaches $0.27–$0.30 and forms a strong rejection candle with declining momentum, a pullback becomes a possibility.
Important downside levels: $0.24 → $0.21 → $0.18.
Overall View
Bullish structure:
Momentum: Strong
Volume confirmation: Improving
RSI: Very high
Major obstacle: $0.27–$0.30
24H change: +19.11%
Market structure: Bullish recovery, but approaching major resistance
1. Trend Structure
Price has broken above the previous descending trendline.
A new ascending trendline is developing from the recent lows.
Structure is forming higher lows + higher highs, which supports a bullish short/medium-term bias.
However, the larger structure still needs confirmation above the major resistance area.
2. Key Support & Resistance
Level
Role
$0.27–0.30
Major resistance zone
$0.24–0.25
Current breakout area
$0.21–0.22
Important support
$0.18–0.20
Stronger support
$0.14–0.15
Major downside support
$0.10
Previous major low
3. RSI
The chart's RSI(6) is around 88, which is very high.
That means:
Strong buying momentum
But the market is short-term overbought
A pullback/consolidation before another move higher is possible.
So I would not treat the current candle alone as a safe entry signal.
4. Volume
Recent volume has increased together with the price rise.
That's important because a breakout accompanied by increasing volume generally has more confirmation than a breakout on weak volume.
The key question now is whether volume remains strong if price approaches $0.27–$0.30.
5. Main Strategies
Strategy A — Trendline Retest
Wait for price to pull back toward $0.21–$0.22.
Look for bullish rejection/confirmation.
Invalidation: sustained break below the rising trendline/support.
Potential upside areas: $0.27 → $0.30 → $0.34
Strategy B — Resistance Breakout
Watch $0.27–$0.30 carefully.
A strong daily close above the zone with volume would provide stronger breakout confirmation.
Possible next areas: $0.34–$0.40.
Strategy C — Resistance Rejection
If price reaches $0.27–$0.30 and forms a strong rejection candle with declining momentum, a pullback becomes a possibility.
Important downside levels: $0.24 → $0.21 → $0.18.
Overall View
Bullish structure:
Momentum: Strong
Volume confirmation: Improving
RSI: Very high
Major obstacle: $0.27–$0.30