
Please details BTC halving and historical pattern and price on image and current price prediction and result
Bitcoin (BTC)
$62,516.00
-$54.00 (0.09%)
•
Today
1D
5D
1M
6M
YTD
1Y
5Y
MAX
12:00 AM
62400
62500
62600
62700
62800
12:00 AM
1:00 AM
2:00 AM
3:15 AM
Open
Volume
-
Market Cap
Day Low
61,290
Year Low
57,945
EPS (TTM)
-
Day High
62,820
Year High
126,080
P/E Ratio
-
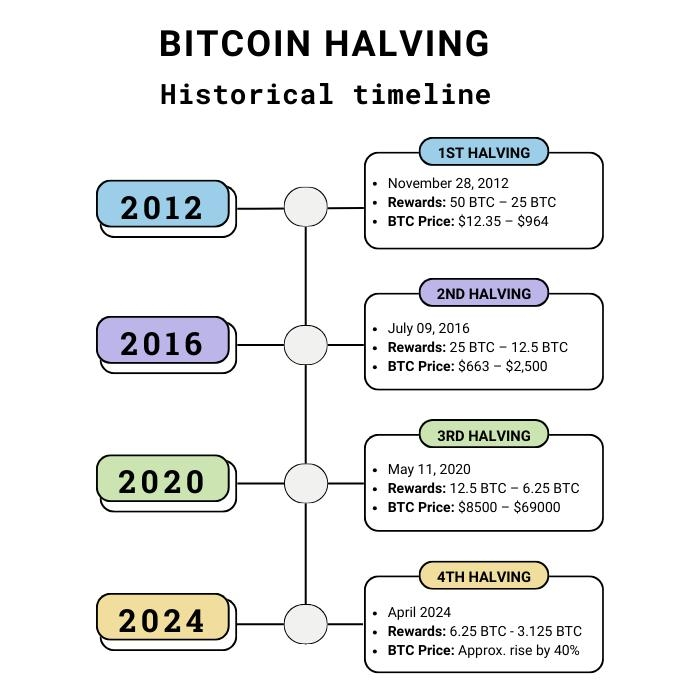
Bitcoin Halving History & Historical Pattern
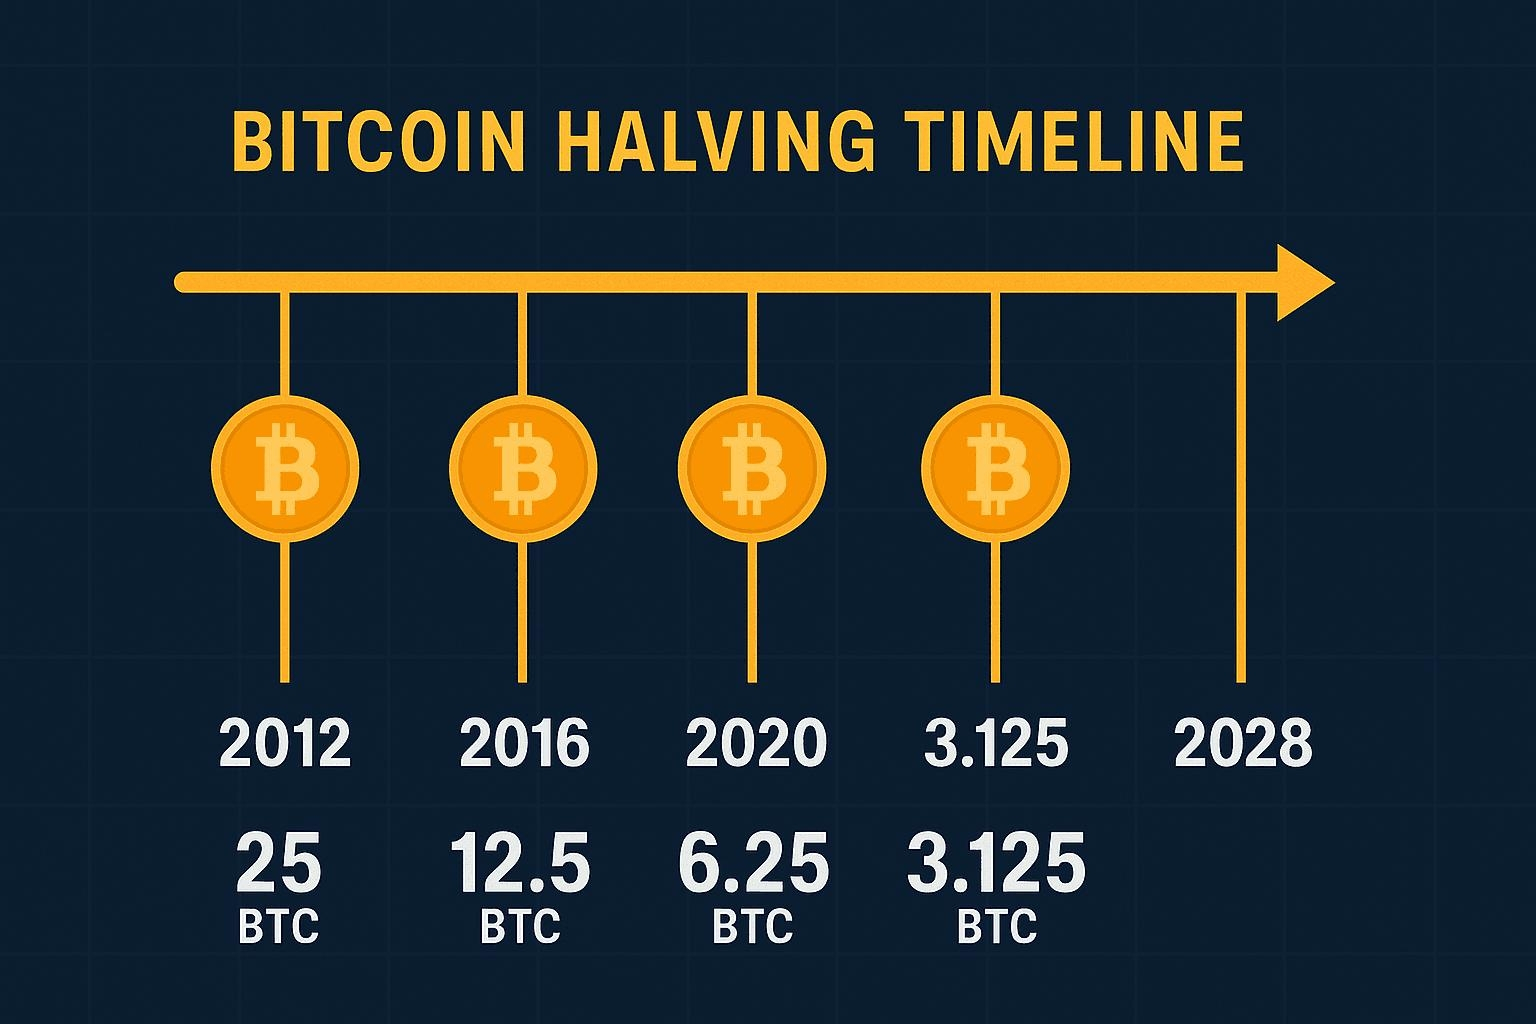
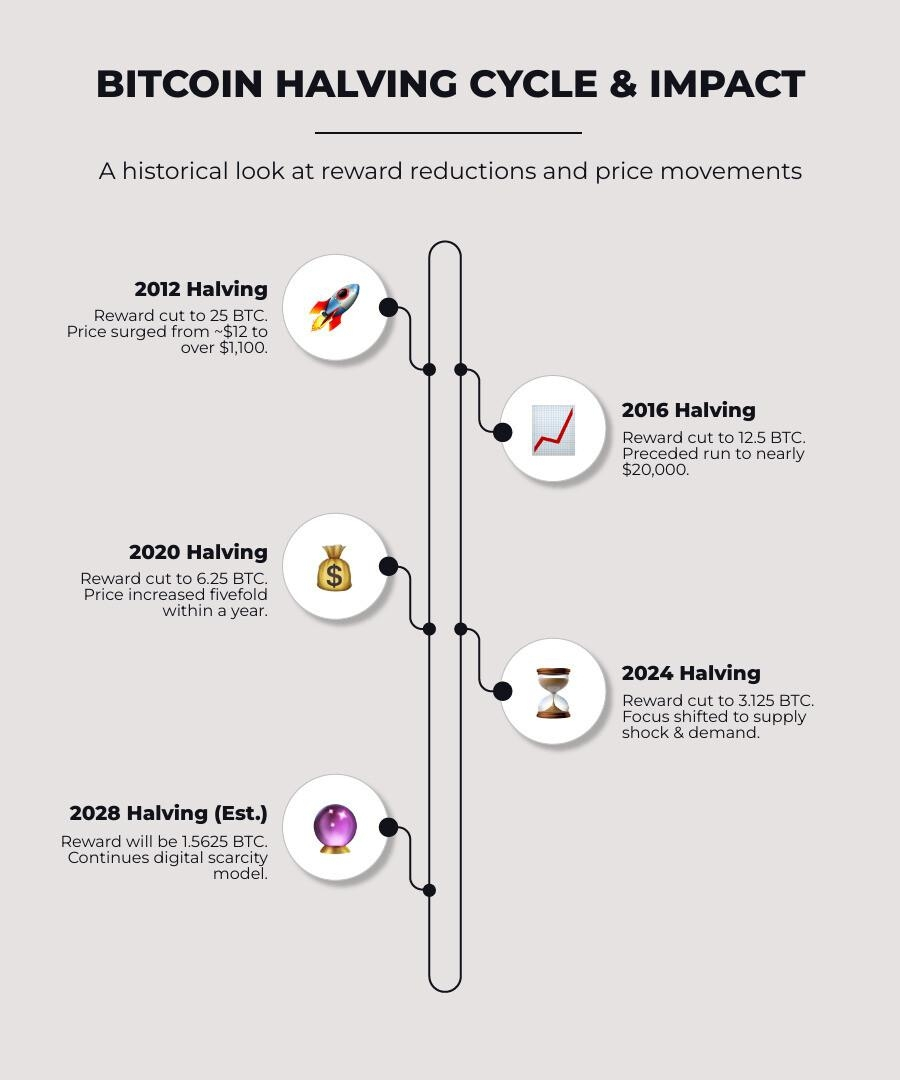
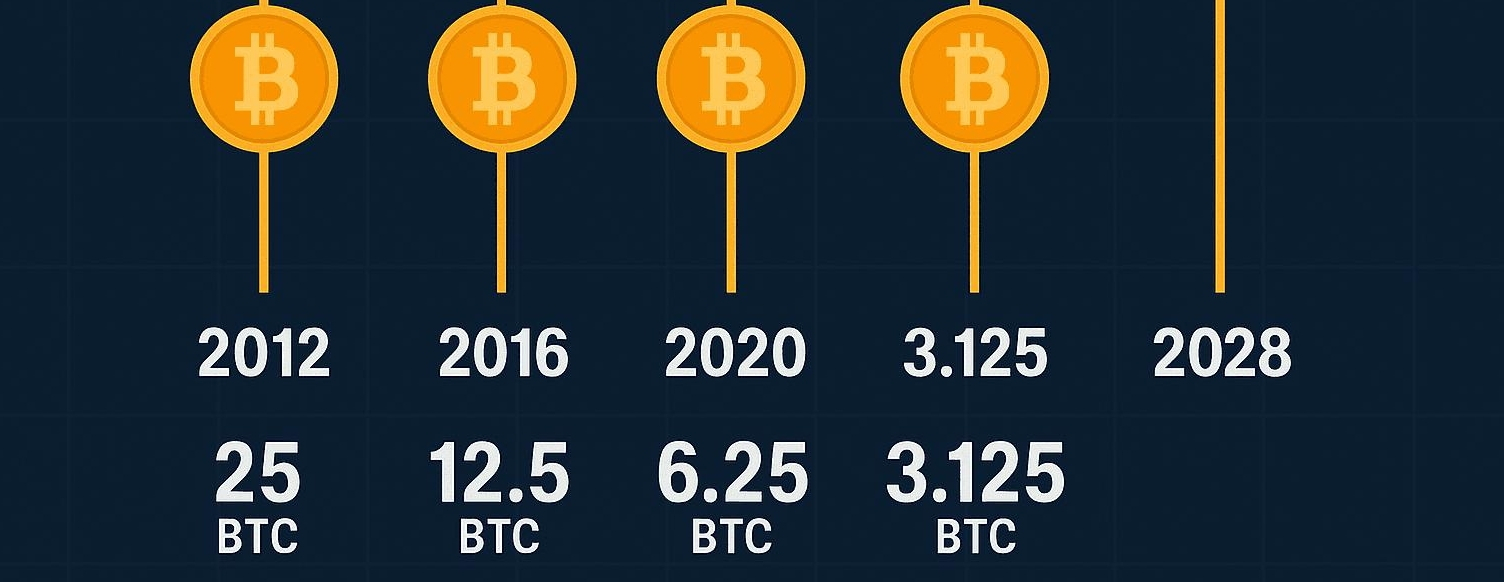
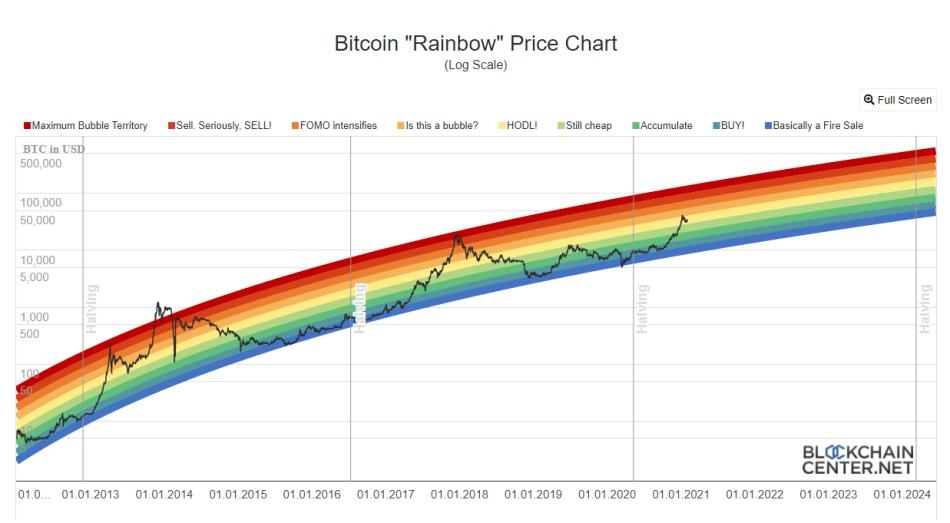
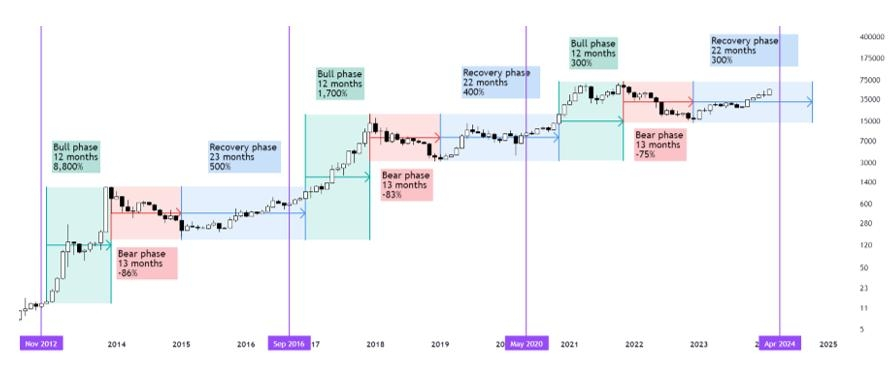
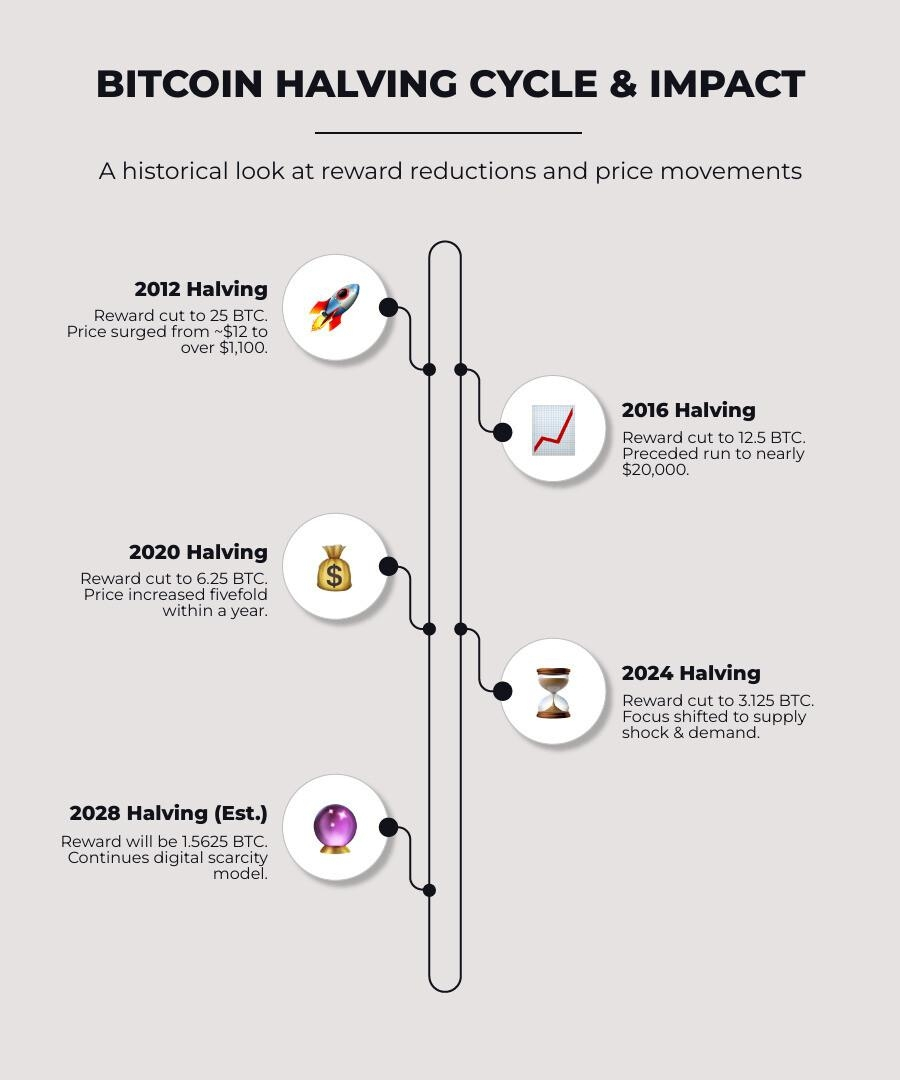
Bitcoin's supply is cut in half approximately every 4 years (210,000 blocks). Historically, this has reduced new BTC issuance and has often been followed by a major bull market, although there is no guarantee the pattern will continue.
Halving Block Reward Bull Market Peak
2012 50 → 25 BTC 2013: ~100× increase
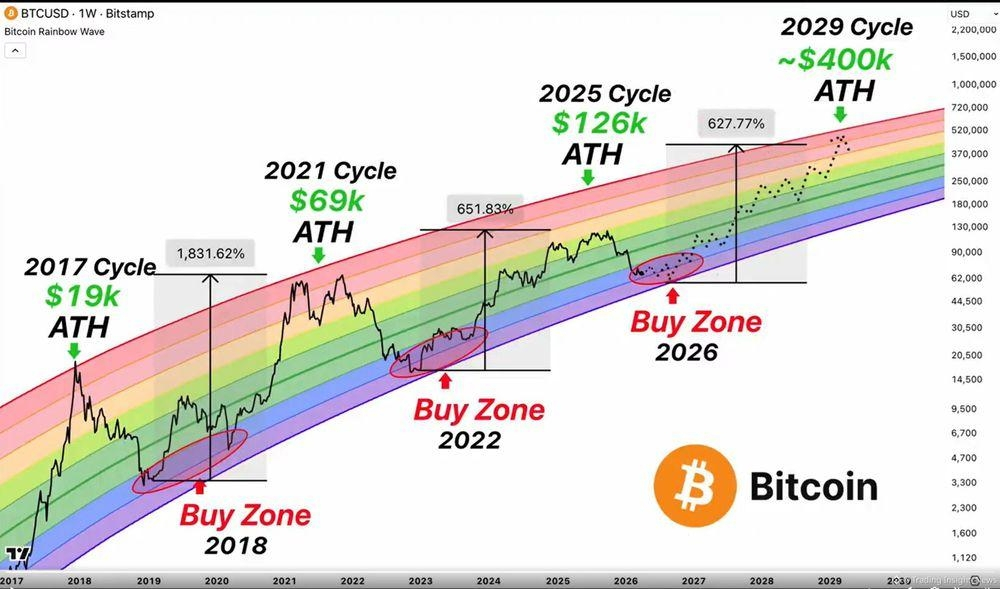
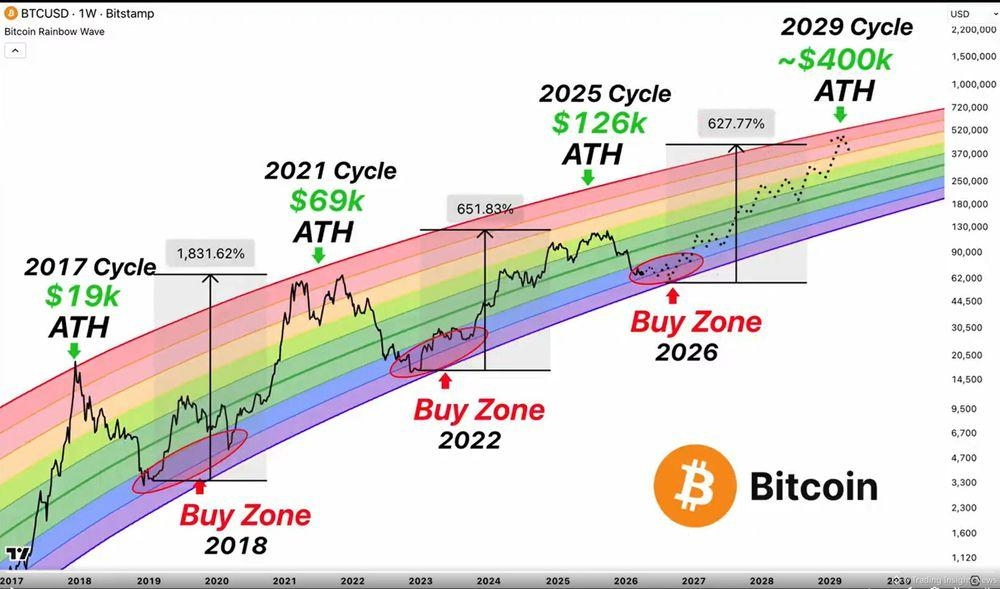
2016 25 → 12.5 BTC 2017: BTC near $20,000
2020 12.5 → 6.25 BTC 2021: BTC near $69,000
2024 6.25 → 3.125 BTC 2025: New ATH around $126,000 before the 2026 decline
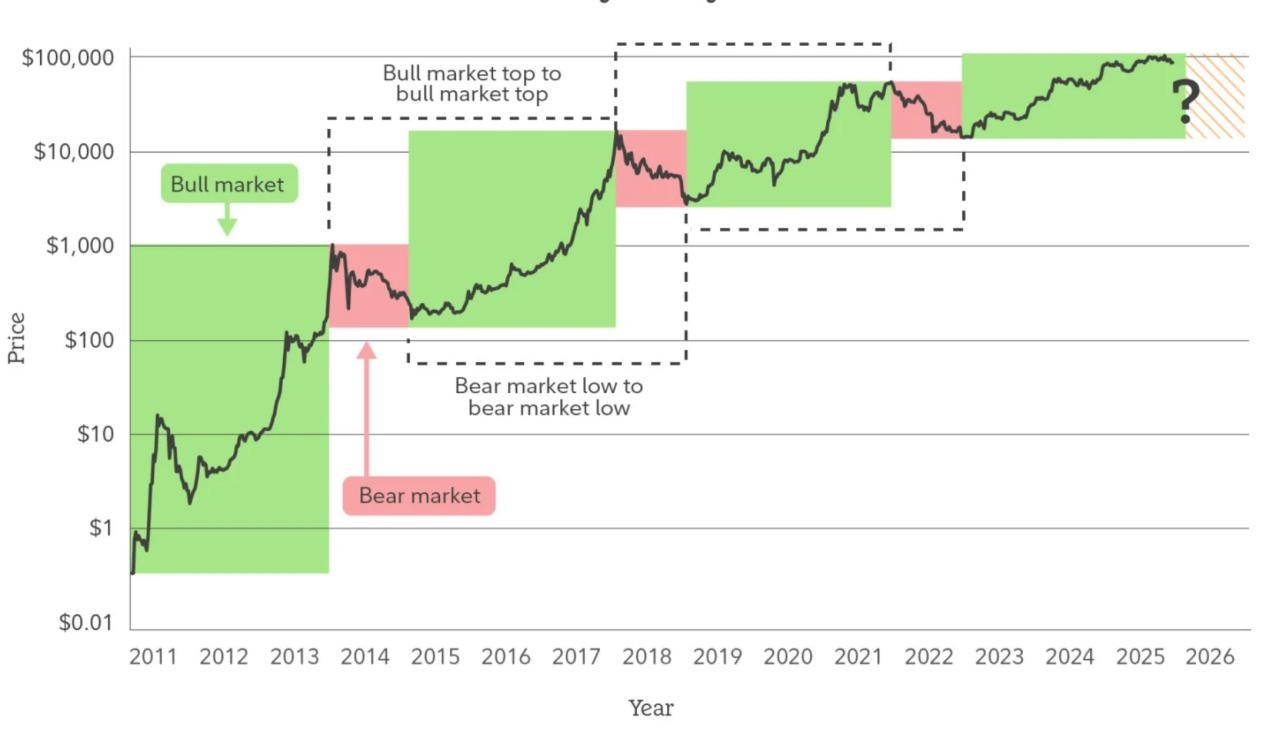
Typical 4-Year Cycle
Halving
Supply decreases.
Miners receive fewer BTC.
6–18 months later
Strong bull market often develops.
Cycle Peak
New all-time high.
Bear Market
Historically Bitcoin has experienced drawdowns of roughly 50–80% after major peaks before finding a bottom.
Current Price
Current BTC price is approximately $62,500 after recovering modestly from recent lows.
Current Market Outlook (2026)
Current market conditions indicate:
BTC is about 50% below its 2025 all-time high (~$126k).
ETF adoption and institutional interest continue, but macroeconomic conditions and investor sentiment remain challenging.
Some analysts think the market may still need additional time to complete the current bear phase.
My Probability-Based View (Not a Guarantee)
Scenario Probability Target
Bullish recovery 30% $90k–120k
Base case 45% $70k–90k
Bearish 25% $45k–60k
No one can reliably predict Bitcoin's future price. These ranges are scenarios based on historical cycles, technical behavior, and current market conditions—not certainties.
If you're a long-term investor, the most important factors to watch are:
ETF inflows/outflows
Interest rate decisions
Global liquidity
On-chain accumulation by long-term holders
Bitcoin support around the current range
If you're trading rather than investing, I can also prepare a professional BTC roadmap showing:
Historical halvings on one chart
Bull and bear cycles
Expected support and resistance zones
Possible path toward the 2028 halving with probability ranges.
Bitcoin Historical Cycle Roadmap (2012–2028)
Historical Pattern
2012 Halving
↓
2013 Bull Market
↓
2014–2015 Bear Market
2016 Halving
↓
2017 Bull Market
↓
2018 Bear Market
2020 Halving
↓
2021 Bull Market
↓
2022 Bear Market
2024 Halving
↓
2025 New All-Time High (~$126K)
↓
2026 Correction / Bear Phase
↓
2027 Recovery (possible)
↓
2028 Next Halving
Important Support & Resistance
Price Level Importance
$50,000–55,000 Strong long-term support
$58,000–60,000 Current major support zone
$70,000–75,000 First resistance
$85,000–95,000 Major resistance
$120,000–126,000 Previous all-time high
Recent market analysis suggests Bitcoin remains in a post-peak correction, with many analysts expecting a potential bottoming process during Q3–Q4 2026 if historical cycles continue.
Probability Roadmap
🟢 Bullish (30%)
Bottom forms above $58K
Recovery toward $80K–100K
Strong momentum into 2027
🟡 Base Case (45%)
Price trades between $50K–70K for several months
Sideways accumulation
Recovery begins later in the cycle
🔴 Bearish (25%)
Loss of the $58K area
Possible decline to $45K–50K
Longer recovery before the next halving
Looking Ahead to the 2028 Halving
Historically, the strongest gains have often occurred 6–18 months after a halving, but each cycle has produced smaller percentage returns than the previous one as Bitcoin has matured. Many researchers believe the four-year cycle still exists, though macroeconomic conditions and institutional investment now have a much larger influence than in earlier cycles.