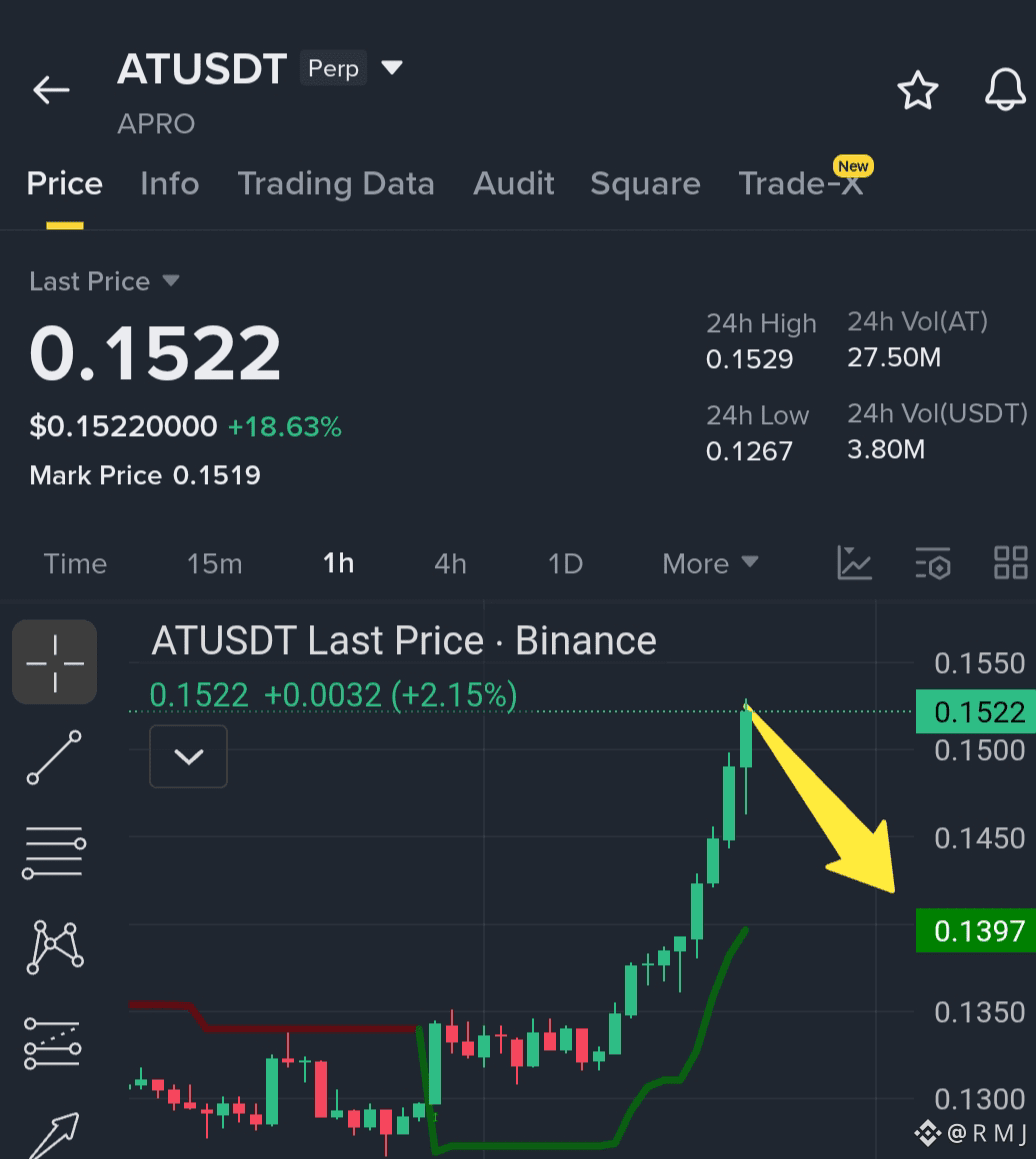
$AT is currently showing a strong impulsive move with a +18.6% surge, but momentum appears to be stretching after the recent expansion. While bullish strength is still present, the chart structure suggests a possible cooling phase where price could retest lower support levels before deciding the next direction.
The key area to watch is 0.1397 — a potential support zone where buyers may step back in if the correction plays out. If that level holds, continuation is still possible; otherwise, deeper retracement could follow as profit-taking increases after the pump.
#RMJ_trades
#IEAForecasts5MbdOilOverhang2027
#TrumpAnnouncesUS10%IntelStake
#YenSlidesToFourDecadeLow
#FedHoldsRatesAt3.5%-3.75%
The key area to watch is 0.1397 — a potential support zone where buyers may step back in if the correction plays out. If that level holds, continuation is still possible; otherwise, deeper retracement could follow as profit-taking increases after the pump.
#RMJ_trades
#IEAForecasts5MbdOilOverhang2027
#TrumpAnnouncesUS10%IntelStake
#YenSlidesToFourDecadeLow
#FedHoldsRatesAt3.5%-3.75%