
#volumespreadanalysis
volumespreadanalysis
912 views
6 සාකච්ඡා කරමින්
උණුසුම්
නවතම

·
--
ලිපිය
පරිවර්තනය බලන්න
🚨Guy's STOP and LEARN $BTC 90% Accuracy Strategy 🤫🔥 NO DEMAND & NO SUPPLY — The Volume Strategy Most Traders Ignore
At end of this article, My today's $800 profit on this strategy will be shown✅
Most traders look at the candle.
Smart volume traders look at what the candle is saying through volume. 👀
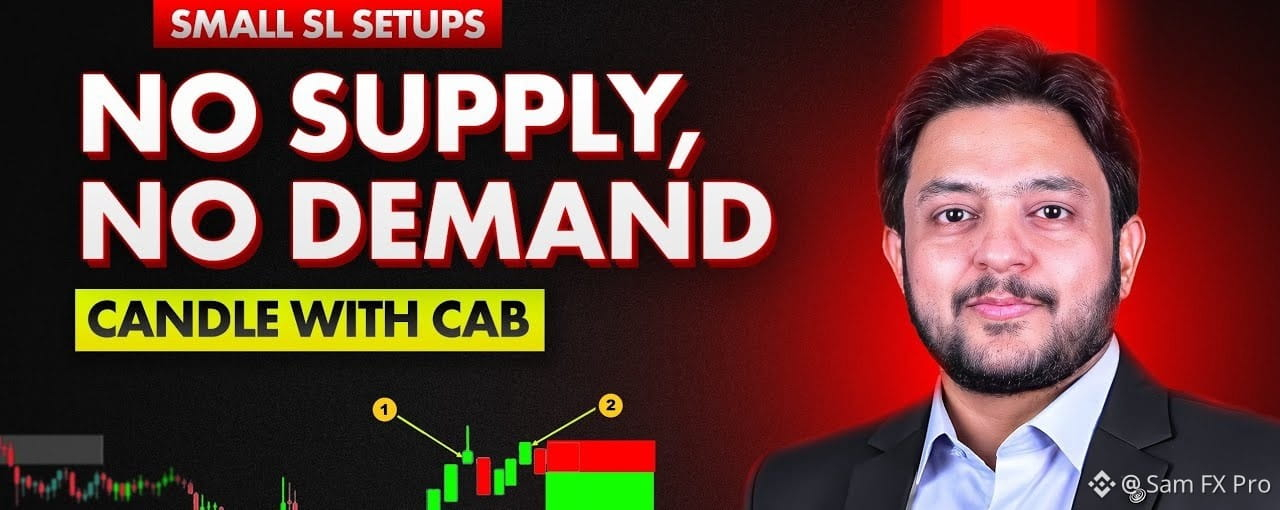
One of my favorite VSA concepts is No Demand (ND) & No Supply (NS).
The idea is simple:
NO DEMAND = Buyers are not showing real strength
📉 NO SUPPLY = Sellers are not showing real strength
But there’s one important rule:
⚠️ Never trade ND/NS just because you see a low-volume candle. CONTEXT MATTERS.
🔴 NO DEMAND (ND)
A typical No Demand bar is:
• Price closes UP
• Candle has a relatively narrow spread
• Volume is lower than the previous bars
• It appears after an upward move / into resistance
What does it tell us?
Price is moving higher, but there isn't enough buying effort behind the move.
If the market is already showing weakness, a No Demand candle can become a warning that the upside move may fail.
📌 ND = Weak demand → potential short opportunity
But don't blindly short the ND candle.
Wait for confirmation from the next candle / market structure.
🟢 NO SUPPLY (NS)
No Supply is basically the opposite.
A typical No Supply bar is:
• Price closes DOWN
• Candle has a relatively narrow spread
• Volume is lower than the previous bars
• It appears after a decline / near support
The important question is:
If sellers were really strong, why did price fall with such little volume?
This can indicate that selling pressure is drying up.
📌 NS = Weak supply → potential long opportunity
Again, confirmation is important.
🧠 THE REAL SECRET: CONTEXT
This is where most traders make mistakes.
❌ They see No Demand → immediately SELL
❌ They see No Supply → immediately BUY
That's not how I would use VSA.
Instead, ask:
Where did the candle appear?
📍 Support
📍 Resistance
📍 Liquidity zone
📍 After a strong impulse
📍 During a trend
📍 After a breakout
📍 Near previous highs/lows
The same candle can mean completely different things depending on its location.
📊 MY SIMPLE ND/NS PROCESS
STEP 1 — Find the market direction
Is the market bullish or bearish?
STEP 2 — Mark important levels
Support, resistance and liquidity.
STEP 3 — Watch the volume
Don't look at volume alone.
Compare it with the recent candles.
STEP 4 — Identify ND or NS
🔴 ND → weak demand
🟢 NS → weak supply
STEP 5 — WAIT FOR CONFIRMATION
This is the most important step.
Don't enter simply because you found the pattern.
Wait for price action to confirm your idea.
🎯 Example
Imagine BTC is in a downtrend.
Price makes a small upward retracement.
Then you get:
🕯️ Small bullish candle
📉 Low volume
📍 Price near resistance
🔴 No Demand
Now the setup becomes much more interesting.
If the next candle shows bearish confirmation and breaks the relevant low, the probability of continuation can improve.
The same logic works in reverse for No Supply around support in a bullish environment.
⚠️ ONE BIG MISTAKE
Low volume ≠ automatic reversal.
No Demand doesn't guarantee that price will fall.
No Supply doesn't guarantee that price will rise.
These are context-based VSA signals, not magic indicators.
Your job isn't to predict every move.
Your job is to find situations where:
PRICE + VOLUME + LOCATION = SAME STORY
That's where VSA becomes powerful. 🔥
💬 Do you trade using Volume Spread Analysis?
Which one do you use more? Tell me in comment 🤗
🔴 No Demand
🟢 No Supply
📊 Both
I also Made 800$ profit in one day on this strategy 👇
#VolumeSpreadAnalysis #VSA #trading
🚨Guy's STOP and LEARN $BTC 90% Accuracy Strategy 🤫
🔥 NO DEMAND & NO SUPPLY — The Volume Strategy Most Traders Ignore
At end of this article, My today's $800 profit on this strategy will be shown✅
Most traders look at the candle.
Smart volume traders look at what the candle is saying through volume. 👀
One of my favorite VSA concepts is No Demand (ND) & No Supply (NS).
The idea is simple:
NO DEMAND = Buyers are not showing real strength
📉 NO SUPPLY = Sellers are not showing real strength
But there’s one important rule:
⚠️ Never trade ND/NS just because you see a low-volume candle. CONTEXT MATTERS.
🔴 NO DEMAND (ND)
A typical No Demand bar is:
• Price closes UP
• Candle has a relatively narrow spread
• Volume is lower than the previous bars
• It appears after an upward move / into resistance
What does it tell us?
Price is moving higher, but there isn't enough buying effort behind the move.
If the market is already showing weakness, a No Demand candle can become a warning that the upside move may fail.
📌 ND = Weak demand → potential short opportunity
But don't blindly short the ND candle.
Wait for confirmation from the next candle / market structure.
🟢 NO SUPPLY (NS)
No Supply is basically the opposite.
A typical No Supply bar is:
• Price closes DOWN
• Candle has a relatively narrow spread
• Volume is lower than the previous bars
• It appears after a decline / near support
The important question is:
If sellers were really strong, why did price fall with such little volume?
This can indicate that selling pressure is drying up.
📌 NS = Weak supply → potential long opportunity
Again, confirmation is important.
🧠 THE REAL SECRET: CONTEXT
This is where most traders make mistakes.
❌ They see No Demand → immediately SELL
❌ They see No Supply → immediately BUY
That's not how I would use VSA.
Instead, ask:
Where did the candle appear?
📍 Support
📍 Resistance
📍 Liquidity zone
📍 After a strong impulse
📍 During a trend
📍 After a breakout
📍 Near previous highs/lows
The same candle can mean completely different things depending on its location.
📊 MY SIMPLE ND/NS PROCESS
STEP 1 — Find the market direction
Is the market bullish or bearish?
STEP 2 — Mark important levels
Support, resistance and liquidity.
STEP 3 — Watch the volume
Don't look at volume alone.
Compare it with the recent candles.
STEP 4 — Identify ND or NS
🔴 ND → weak demand
🟢 NS → weak supply
STEP 5 — WAIT FOR CONFIRMATION
This is the most important step.
Don't enter simply because you found the pattern.
Wait for price action to confirm your idea.
🎯 Example
Imagine BTC is in a downtrend.
Price makes a small upward retracement.
Then you get:
🕯️ Small bullish candle
📉 Low volume
📍 Price near resistance
🔴 No Demand
Now the setup becomes much more interesting.
If the next candle shows bearish confirmation and breaks the relevant low, the probability of continuation can improve.
The same logic works in reverse for No Supply around support in a bullish environment.
⚠️ ONE BIG MISTAKE
Low volume ≠ automatic reversal.
No Demand doesn't guarantee that price will fall.
No Supply doesn't guarantee that price will rise.
These are context-based VSA signals, not magic indicators.
Your job isn't to predict every move.
Your job is to find situations where:
PRICE + VOLUME + LOCATION = SAME STORY
That's where VSA becomes powerful. 🔥
💬 Do you trade using Volume Spread Analysis?
Which one do you use more? Tell me in comment 🤗
🔴 No Demand
🟢 No Supply
📊 Both
I also Made 800$ profit in one day on this strategy 👇
#VolumeSpreadAnalysis #VSA #trading
At end of this article, My today's $800 profit on this strategy will be shown✅
Most traders look at the candle.
Smart volume traders look at what the candle is saying through volume. 👀
One of my favorite VSA concepts is No Demand (ND) & No Supply (NS).
The idea is simple:
NO DEMAND = Buyers are not showing real strength
📉 NO SUPPLY = Sellers are not showing real strength
But there’s one important rule:
⚠️ Never trade ND/NS just because you see a low-volume candle. CONTEXT MATTERS.
🔴 NO DEMAND (ND)
A typical No Demand bar is:
• Price closes UP
• Candle has a relatively narrow spread
• Volume is lower than the previous bars
• It appears after an upward move / into resistance
What does it tell us?
Price is moving higher, but there isn't enough buying effort behind the move.
If the market is already showing weakness, a No Demand candle can become a warning that the upside move may fail.
📌 ND = Weak demand → potential short opportunity
But don't blindly short the ND candle.
Wait for confirmation from the next candle / market structure.
🟢 NO SUPPLY (NS)
No Supply is basically the opposite.
A typical No Supply bar is:
• Price closes DOWN
• Candle has a relatively narrow spread
• Volume is lower than the previous bars
• It appears after a decline / near support
The important question is:
If sellers were really strong, why did price fall with such little volume?
This can indicate that selling pressure is drying up.
📌 NS = Weak supply → potential long opportunity
Again, confirmation is important.
🧠 THE REAL SECRET: CONTEXT
This is where most traders make mistakes.
❌ They see No Demand → immediately SELL
❌ They see No Supply → immediately BUY
That's not how I would use VSA.
Instead, ask:
Where did the candle appear?
📍 Support
📍 Resistance
📍 Liquidity zone
📍 After a strong impulse
📍 During a trend
📍 After a breakout
📍 Near previous highs/lows
The same candle can mean completely different things depending on its location.
📊 MY SIMPLE ND/NS PROCESS
STEP 1 — Find the market direction
Is the market bullish or bearish?
STEP 2 — Mark important levels
Support, resistance and liquidity.
STEP 3 — Watch the volume
Don't look at volume alone.
Compare it with the recent candles.
STEP 4 — Identify ND or NS
🔴 ND → weak demand
🟢 NS → weak supply
STEP 5 — WAIT FOR CONFIRMATION
This is the most important step.
Don't enter simply because you found the pattern.
Wait for price action to confirm your idea.
🎯 Example
Imagine BTC is in a downtrend.
Price makes a small upward retracement.
Then you get:
🕯️ Small bullish candle
📉 Low volume
📍 Price near resistance
🔴 No Demand
Now the setup becomes much more interesting.
If the next candle shows bearish confirmation and breaks the relevant low, the probability of continuation can improve.
The same logic works in reverse for No Supply around support in a bullish environment.
⚠️ ONE BIG MISTAKE
Low volume ≠ automatic reversal.
No Demand doesn't guarantee that price will fall.
No Supply doesn't guarantee that price will rise.
These are context-based VSA signals, not magic indicators.
Your job isn't to predict every move.
Your job is to find situations where:
PRICE + VOLUME + LOCATION = SAME STORY
That's where VSA becomes powerful. 🔥
💬 Do you trade using Volume Spread Analysis?
Which one do you use more? Tell me in comment 🤗
🔴 No Demand
🟢 No Supply
📊 Both
I also Made 800$ profit in one day on this strategy 👇
#VolumeSpreadAnalysis #VSA #trading
1
93
තවත් අන්තර්ගතයන් ගවේෂණය කිරීමට ඇතුල් වන්න
Binance චතුරශ්රය හි ගෝලීය ක්රිප්ටෝ පරිශීලකයින් හා එක්වන්න
⚡️ ක්රිප්ටෝ පිළිබඳ නවතම සහ ප්රයෝජනවත් තොරතුරු ලබා ගන්න.
💬 ලොව විශාලතම ක්රිප්ටෝ හුවමාරුව මගින් විශ්වාස කෙරේ.
👍 සත්යායනය කරන ලද නිර්මාණකරුවන්ගෙන් සැබෑ විදසුන් සොයා ගන්න.
විද්යුත් තැපෑල / දුරකථන අංකය
නැගී එන මාතෘකා
1
#USTreasuryToBuyBackUpTo$6BLongDatedDebt
5,945 views
111 සාකච්ඡා කරමින්
2
#BitcoinSurpasses$79K
44,335 views
233 සාකච්ඡා කරමින්
3
#BrentCrudeTops$100
102,978 views
357 සාකච්ඡා කරමින්
4
#USADPWeeklyEmploymentRises12000
66,867 views
873 සාකච්ඡා කරමින්
5
#BankOfAmericaGroupPilotsUSBDCStablecoin
52,575 views
699 සාකච්ඡා කරමින්
6
#RippleLobbiesToAdvanceCLARITYActVote
82,750 views
962 සාකච්ඡා කරමින්
7
#GrayscaleZcashETFTops$500M
13,787 views
121 සාකච්ඡා කරමින්
8
#ChinaAugustCPIRises0.8%YoY
58,797 views
1,027 සාකච්ඡා කරමින්
9
#USStrikesTargetsNearHormuzAndJask
74,503 views
1,096 සාකච්ඡා කරමින්
10
#OilRisesToHighestSinceJuly
84,101 views
1,144 සාකච්ඡා කරමින්