
#technicalanalysisforbeginners
technicalanalysisforbeginners
1,551 නැරඹීම්
18 සාකච්ඡා කරමින්
උණුසුම්
නවතම

·
--
උසබ තත්ත්වය
GRAVITY ( $G ) Coin
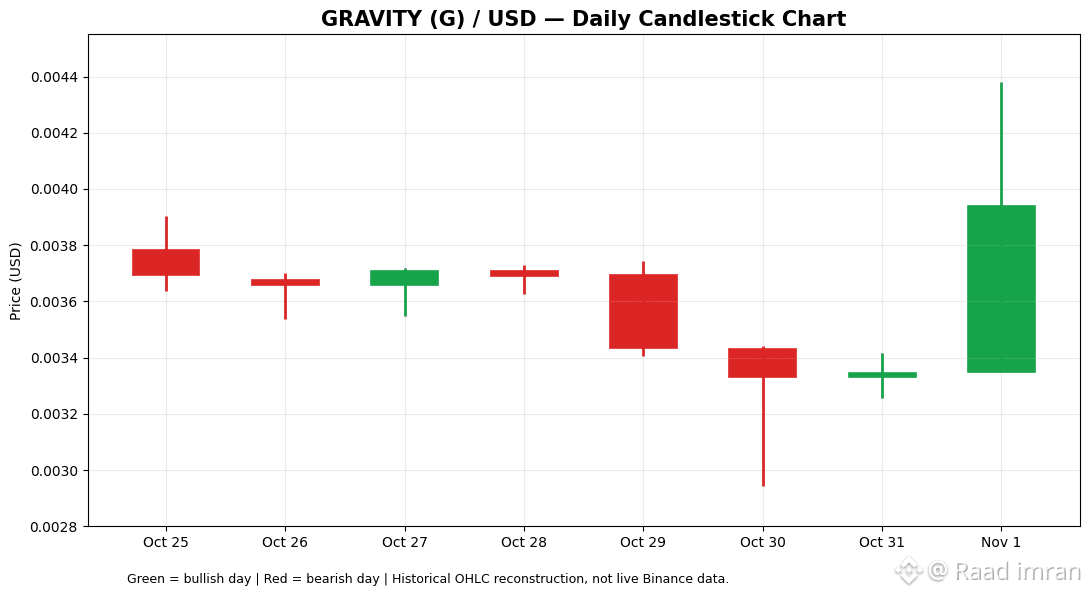
#Gravity (G) is a speculative cryptocurrency with potential for strong price movements as market sentiment and trading volume evolve. The key focus for traders should be whether buyers can establish support and push the price above nearby resistance. A sustained increase in volume alongside higher highs would strengthen the bullish outlook, while rejection at resistance or a breakdown below support could trigger further downside. Traders should avoid chasing sudden pumps and wait for a confirmed breakout or a clear reversal signal. Risk management and disciplined stop-loss placement remain essential.
Technical levels to watch
Based on the latest available market readings:
Level Price. (USD)
Resistance 1 $0.00382
Resistance 2 $0.00398
Support 1 $0.00366
Support 2 $0.00350
The latest reported daily indicators showed bullish momentum, but RSI was elevated near 72, suggesting possible short-term overbought conditions. 
Gravity (G) candlestick chart

#Gravity #GToken #TechnicalAnalysisforBeginners #BinanceUSDTMarket
{future}(GUSDT)
GRAVITY ( $G ) Coin
#Gravity (G) is a speculative cryptocurrency with potential for strong price movements as market sentiment and trading volume evolve. The key focus for traders should be whether buyers can establish support and push the price above nearby resistance. A sustained increase in volume alongside higher highs would strengthen the bullish outlook, while rejection at resistance or a breakdown below support could trigger further downside. Traders should avoid chasing sudden pumps and wait for a confirmed breakout or a clear reversal signal. Risk management and disciplined stop-loss placement remain essential.
Technical levels to watch
Based on the latest available market readings:
Level Price. (USD)
Resistance 1 $0.00382
Resistance 2 $0.00398
Support 1 $0.00366
Support 2 $0.00350
The latest reported daily indicators showed bullish momentum, but RSI was elevated near 72, suggesting possible short-term overbought conditions. 
Gravity (G) candlestick chart

#Gravity #GToken #TechnicalAnalysisforBeginners #BinanceUSDTMarket
#Gravity (G) is a speculative cryptocurrency with potential for strong price movements as market sentiment and trading volume evolve. The key focus for traders should be whether buyers can establish support and push the price above nearby resistance. A sustained increase in volume alongside higher highs would strengthen the bullish outlook, while rejection at resistance or a breakdown below support could trigger further downside. Traders should avoid chasing sudden pumps and wait for a confirmed breakout or a clear reversal signal. Risk management and disciplined stop-loss placement remain essential.
Technical levels to watch
Based on the latest available market readings:
Level Price. (USD)
Resistance 1 $0.00382
Resistance 2 $0.00398
Support 1 $0.00366
Support 2 $0.00350
The latest reported daily indicators showed bullish momentum, but RSI was elevated near 72, suggesting possible short-term overbought conditions. 
Gravity (G) candlestick chart

#Gravity #GToken #TechnicalAnalysisforBeginners #BinanceUSDTMarket
1
326
XAU/USD (Gold) Market Update 🟡
Gold prices are testing crucial support levels today. Traders are closely monitoring price action around support and resistance zones for potential breakout or reversal setups.
📉 Key Technical Levels:
• Support Zone: $4,120 – $4,150
• Resistance Zone: $4,280 – $4,300
Always maintain proper risk management and wait for clear market signals before entering trades! 📊
#XAUUSD #Gold #CryptoTrading #BinanceSquare #TechnicalAnalysisforBeginners
XAU/USD (Gold) Market Update 🟡
Gold prices are testing crucial support levels today. Traders are closely monitoring price action around support and resistance zones for potential breakout or reversal setups.
📉 Key Technical Levels:
• Support Zone: $4,120 – $4,150
• Resistance Zone: $4,280 – $4,300
Always maintain proper risk management and wait for clear market signals before entering trades! 📊
#XAUUSD #Gold #CryptoTrading #BinanceSquare #TechnicalAnalysisforBeginners
Gold prices are testing crucial support levels today. Traders are closely monitoring price action around support and resistance zones for potential breakout or reversal setups.
📉 Key Technical Levels:
• Support Zone: $4,120 – $4,150
• Resistance Zone: $4,280 – $4,300
Always maintain proper risk management and wait for clear market signals before entering trades! 📊
#XAUUSD #Gold #CryptoTrading #BinanceSquare #TechnicalAnalysisforBeginners
1
1
300

·
--
₿ BITCOIN (BTC): Bulls Are Fighting to Regain Control!
$BTC
{spot}(BTCUSDT)
Bitcoin is trading around the $77K–$78K zone as the market attempts to recover from recent selling pressure.
📊 Market Analysis:
- Trend: Short-term cautious / volatile.
- Support: $76,000–$77,000.
- Resistance: $78,500–$79,000.
- Bullish Scenario: A strong breakout above $79K could strengthen recovery momentum.
- Bearish Scenario: Losing $76K could expose BTC to further downside.
🔥 My Take: Bitcoin is approaching an important decision zone. Buyers need to defend support and reclaim resistance before a stronger bullish move can be confirmed.
The big question is: Is this the beginning of a recovery or just a temporary bounce?
👇 What's your prediction?
#Bitcoin #BTC #CryptoAnalysis #BinanceSquare #BitcoinTrading #CryptoMarketWatch et #BTCUSDTUPDATE #TechnicalAnalysisforBeginners #CryptoNews🚀🔥V #BullishOrBearish
₿ BITCOIN (BTC): Bulls Are Fighting to Regain Control!
$BTC
Bitcoin is trading around the $77K–$78K zone as the market attempts to recover from recent selling pressure.
📊 Market Analysis:
- Trend: Short-term cautious / volatile.
- Support: $76,000–$77,000.
- Resistance: $78,500–$79,000.
- Bullish Scenario: A strong breakout above $79K could strengthen recovery momentum.
- Bearish Scenario: Losing $76K could expose BTC to further downside.
🔥 My Take: Bitcoin is approaching an important decision zone. Buyers need to defend support and reclaim resistance before a stronger bullish move can be confirmed.
The big question is: Is this the beginning of a recovery or just a temporary bounce?
👇 What's your prediction?
#Bitcoin #BTC #CryptoAnalysis #BinanceSquare #BitcoinTrading #CryptoMarketWatch et #BTCUSDTUPDATE #TechnicalAnalysisforBeginners #CryptoNews🚀🔥V #BullishOrBearish
$BTC
Bitcoin is trading around the $77K–$78K zone as the market attempts to recover from recent selling pressure.
📊 Market Analysis:
- Trend: Short-term cautious / volatile.
- Support: $76,000–$77,000.
- Resistance: $78,500–$79,000.
- Bullish Scenario: A strong breakout above $79K could strengthen recovery momentum.
- Bearish Scenario: Losing $76K could expose BTC to further downside.
🔥 My Take: Bitcoin is approaching an important decision zone. Buyers need to defend support and reclaim resistance before a stronger bullish move can be confirmed.
The big question is: Is this the beginning of a recovery or just a temporary bounce?
👇 What's your prediction?
#Bitcoin #BTC #CryptoAnalysis #BinanceSquare #BitcoinTrading #CryptoMarketWatch et #BTCUSDTUPDATE #TechnicalAnalysisforBeginners #CryptoNews🚀🔥V #BullishOrBearish

1
67

·
--
#UniswapA16zSeekDeFiExemptionFromIllinoisCryptoTax
Gold Faces a Short-Term Pullback — Can Sellers Maintain Control?
Gold is trading near $4,004.33, down 0.75%, with short-term selling pressure developing below the $4,020 resistance zone.
A weak recovery toward resistance could offer a potential short opportunity, while a strong reclaim of this level may signal a change in momentum.
Trade Setup: Resistance Rejection
EP: $4,015–$4,025
TP1: $4,000
TP2: $3,985
TP3: $3,970
SL: $4,040
Market Structure & Liquidity Analysis
The $4,020 region is the primary resistance, while $4,000 remains an important psychological level. A rejection from resistance could open the way toward the lower support zones.
A sustained move above $4,040 would invalidate the bearish setup. Traders should monitor price reaction before committing capital.
#Gold #XAUUSDT #GoldTrading #FuturesTrading #TechnicalAnalysisforBeginners
#UniswapA16zSeekDeFiExemptionFromIllinoisCryptoTax
Gold Faces a Short-Term Pullback — Can Sellers Maintain Control?
Gold is trading near $4,004.33, down 0.75%, with short-term selling pressure developing below the $4,020 resistance zone.
A weak recovery toward resistance could offer a potential short opportunity, while a strong reclaim of this level may signal a change in momentum.
Trade Setup: Resistance Rejection
EP: $4,015–$4,025
TP1: $4,000
TP2: $3,985
TP3: $3,970
SL: $4,040
Market Structure & Liquidity Analysis
The $4,020 region is the primary resistance, while $4,000 remains an important psychological level. A rejection from resistance could open the way toward the lower support zones.
A sustained move above $4,040 would invalidate the bearish setup. Traders should monitor price reaction before committing capital.
#Gold #XAUUSDT #GoldTrading #FuturesTrading #TechnicalAnalysisforBeginners
Gold Faces a Short-Term Pullback — Can Sellers Maintain Control?
Gold is trading near $4,004.33, down 0.75%, with short-term selling pressure developing below the $4,020 resistance zone.
A weak recovery toward resistance could offer a potential short opportunity, while a strong reclaim of this level may signal a change in momentum.
Trade Setup: Resistance Rejection
EP: $4,015–$4,025
TP1: $4,000
TP2: $3,985
TP3: $3,970
SL: $4,040
Market Structure & Liquidity Analysis
The $4,020 region is the primary resistance, while $4,000 remains an important psychological level. A rejection from resistance could open the way toward the lower support zones.
A sustained move above $4,040 would invalidate the bearish setup. Traders should monitor price reaction before committing capital.
#Gold #XAUUSDT #GoldTrading #FuturesTrading #TechnicalAnalysisforBeginners
252

·
--
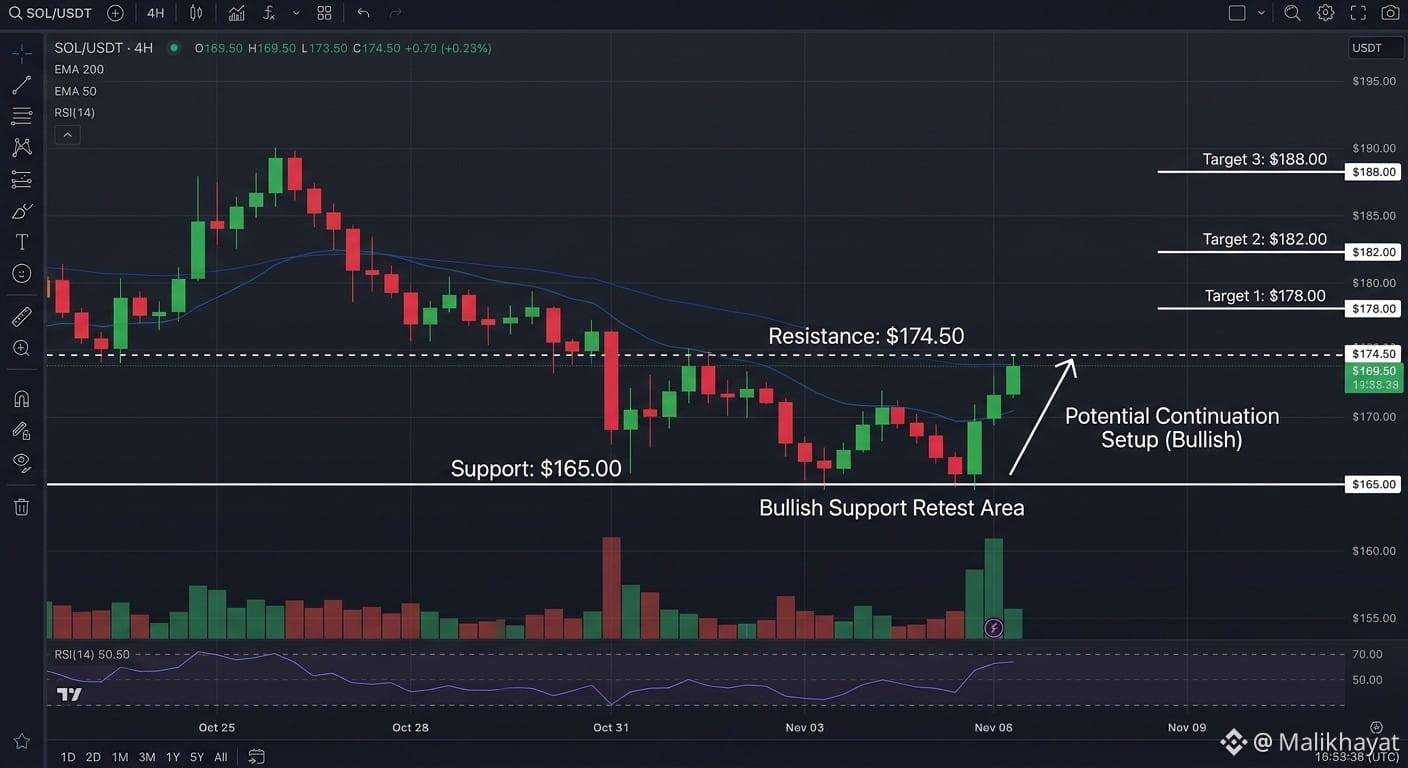
$SOL Solana is trading at $168.50, up 1.15%, with $2.9B in 24-hour volume. The supplied structure remains bullish as price retests the $165 support flip. Gradually expanding open interest and subtle spot premiums suggest fresh spot-driven accumulation. DEX activity provides the stated ecosystem catalyst. However, broader ETF outflows or network outages could undermine the setup, so maintaining support is important before expecting further upside.
📈 Bias: Bullish | 🎯 Entry: $166.00–$168.00 | 🛡 Support: $165.00 | 🚧 Resistance: $174.50 | 🎯 Targets: $174.00 / $181.00 / $188.00 | ❌ Invalidation: Move below $161.00
Strategy: Monitor the $165 support retest for evidence of continued demand. A sustained hold supports the bounce setup; a move below $161 invalidates the supplied thesis.
#Solana #SOL #CryptoTrading #SupportAndResistance #TechnicalAnalysisforBeginners
{future}(SOLUSDT)
$SOL Solana is trading at $168.50, up 1.15%, with $2.9B in 24-hour volume. The supplied structure remains bullish as price retests the $165 support flip. Gradually expanding open interest and subtle spot premiums suggest fresh spot-driven accumulation. DEX activity provides the stated ecosystem catalyst. However, broader ETF outflows or network outages could undermine the setup, so maintaining support is important before expecting further upside.
📈 Bias: Bullish | 🎯 Entry: $166.00–$168.00 | 🛡 Support: $165.00 | 🚧 Resistance: $174.50 | 🎯 Targets: $174.00 / $181.00 / $188.00 | ❌ Invalidation: Move below $161.00
Strategy: Monitor the $165 support retest for evidence of continued demand. A sustained hold supports the bounce setup; a move below $161 invalidates the supplied thesis.
#Solana #SOL #CryptoTrading #SupportAndResistance #TechnicalAnalysisforBeginners
📈 Bias: Bullish | 🎯 Entry: $166.00–$168.00 | 🛡 Support: $165.00 | 🚧 Resistance: $174.50 | 🎯 Targets: $174.00 / $181.00 / $188.00 | ❌ Invalidation: Move below $161.00
Strategy: Monitor the $165 support retest for evidence of continued demand. A sustained hold supports the bounce setup; a move below $161 invalidates the supplied thesis.
#Solana #SOL #CryptoTrading #SupportAndResistance #TechnicalAnalysisforBeginners
5

$SOXL
{future}(SOXLUSDT)
$SOXLUSDT — PROFESSIONAL SHORT SETUP
📉 Bias: Bearish
🎯 Entry Zone: 84.80 – 85.20
🥇 TP1: 83.50
🥈 TP2: 82.50
🥉 TP3: 81.80
🛑 Stop Loss: 86.20
📊 Confirmation: 15m bearish rejection or breakdown required.
⚠️ Wait for confirmation before entry. Prices may change; verify the live chart.
#SOXLUSDT #ShortSetup #CryptoTrading. #TechnicalAnalysisforBeginners #Square
$SOXL
$SOXLUSDT — PROFESSIONAL SHORT SETUP
📉 Bias: Bearish
🎯 Entry Zone: 84.80 – 85.20
🥇 TP1: 83.50
🥈 TP2: 82.50
🥉 TP3: 81.80
🛑 Stop Loss: 86.20
📊 Confirmation: 15m bearish rejection or breakdown required.
⚠️ Wait for confirmation before entry. Prices may change; verify the live chart.
#SOXLUSDT #ShortSetup #CryptoTrading. #TechnicalAnalysisforBeginners #Square
$SOXLUSDT — PROFESSIONAL SHORT SETUP
📉 Bias: Bearish
🎯 Entry Zone: 84.80 – 85.20
🥇 TP1: 83.50
🥈 TP2: 82.50
🥉 TP3: 81.80
🛑 Stop Loss: 86.20
📊 Confirmation: 15m bearish rejection or breakdown required.
⚠️ Wait for confirmation before entry. Prices may change; verify the live chart.
#SOXLUSDT #ShortSetup #CryptoTrading. #TechnicalAnalysisforBeginners #Square

1
1
1.4k

·
--
උසබ තත්ත්වය
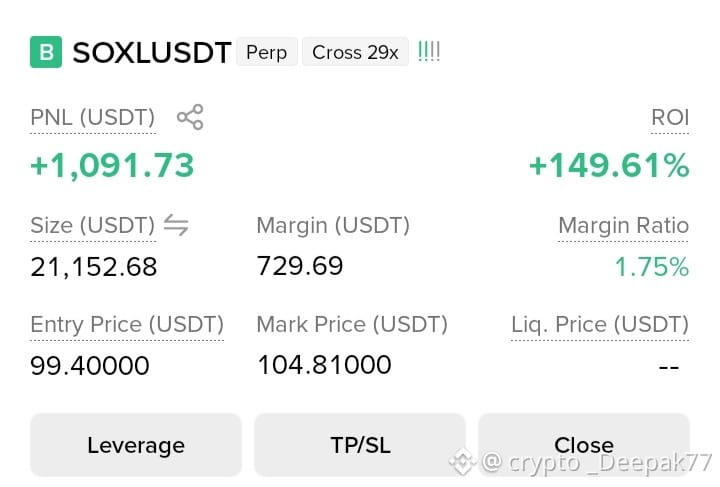
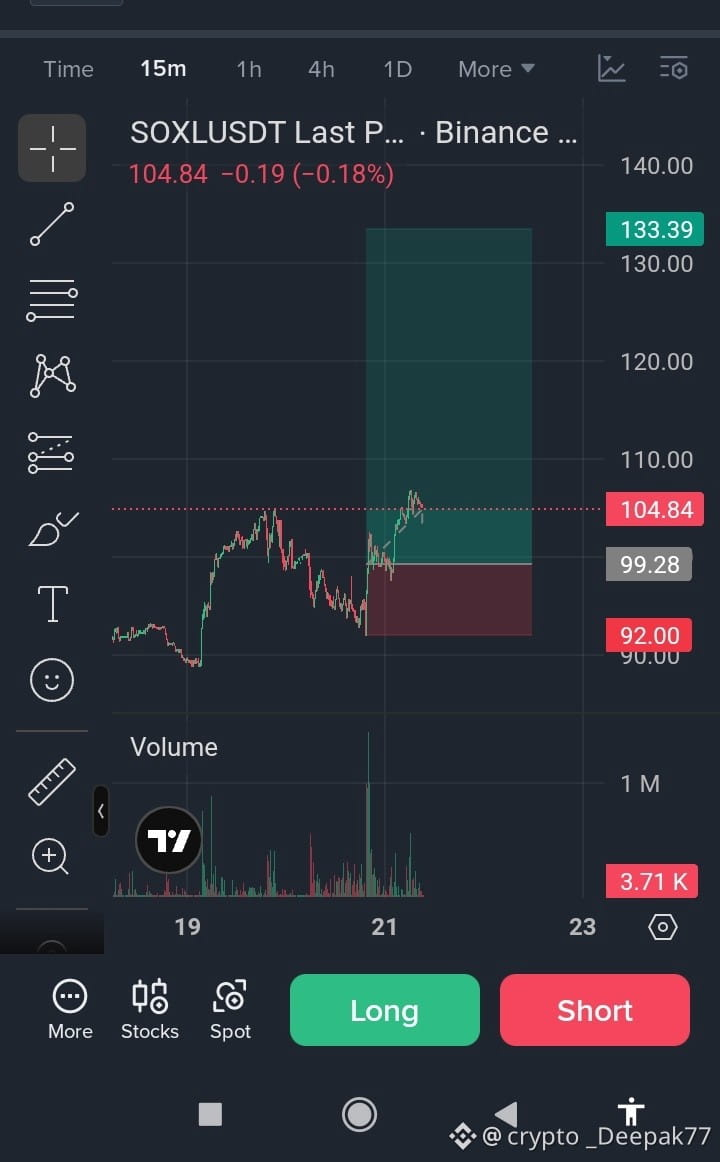
🚀 $SOXL LUSDT LONG TRADE UPDATE | TARGET IN FOCUS! 📈
🔥 Profit Update: +1,091.73 USDT
📊 ROI: +149.61%
💰 Entry Price: 99.40 USDT
💵 Current Price: 104.84 USDT
🎯 TP Target: 133.39 USDT
🛑 Stop Loss: 92.00 USDT
⚡ Leverage: 29x Cross
📈 Market Analysis: $SOXLB USDT is showing strong bullish momentum on the 15-minute chart. Buyers have pushed the price above the 99.28 USDT breakout zone, and the market is currently holding near 104.84 USDT.
If buying pressure continues, the next upside targets could come into focus. Watch for a successful retest of the breakout zone before considering further entries.
120, and eventually 133 USDT?
👇 Share your thoughts in the comments!
#SOXLUSDT #BinanceFuturesSignal #CryptoTrading #LongTradeSigna #TradingSignals_ #TechnicalAnalysisforBeginners #CryptoMarket
🚀 $SOXL LUSDT LONG TRADE UPDATE | TARGET IN FOCUS! 📈
🔥 Profit Update: +1,091.73 USDT
📊 ROI: +149.61%
💰 Entry Price: 99.40 USDT
💵 Current Price: 104.84 USDT
🎯 TP Target: 133.39 USDT
🛑 Stop Loss: 92.00 USDT
⚡ Leverage: 29x Cross
📈 Market Analysis: $SOXLB USDT is showing strong bullish momentum on the 15-minute chart. Buyers have pushed the price above the 99.28 USDT breakout zone, and the market is currently holding near 104.84 USDT.
If buying pressure continues, the next upside targets could come into focus. Watch for a successful retest of the breakout zone before considering further entries.
120, and eventually 133 USDT?
👇 Share your thoughts in the comments!
#SOXLUSDT #BinanceFuturesSignal #CryptoTrading #LongTradeSigna #TradingSignals_ #TechnicalAnalysisforBeginners #CryptoMarket
🔥 Profit Update: +1,091.73 USDT
📊 ROI: +149.61%
💰 Entry Price: 99.40 USDT
💵 Current Price: 104.84 USDT
🎯 TP Target: 133.39 USDT
🛑 Stop Loss: 92.00 USDT
⚡ Leverage: 29x Cross
📈 Market Analysis: $SOXLB USDT is showing strong bullish momentum on the 15-minute chart. Buyers have pushed the price above the 99.28 USDT breakout zone, and the market is currently holding near 104.84 USDT.
If buying pressure continues, the next upside targets could come into focus. Watch for a successful retest of the breakout zone before considering further entries.
120, and eventually 133 USDT?
👇 Share your thoughts in the comments!
#SOXLUSDT #BinanceFuturesSignal #CryptoTrading #LongTradeSigna #TradingSignals_ #TechnicalAnalysisforBeginners #CryptoMarket
1
68

·
--
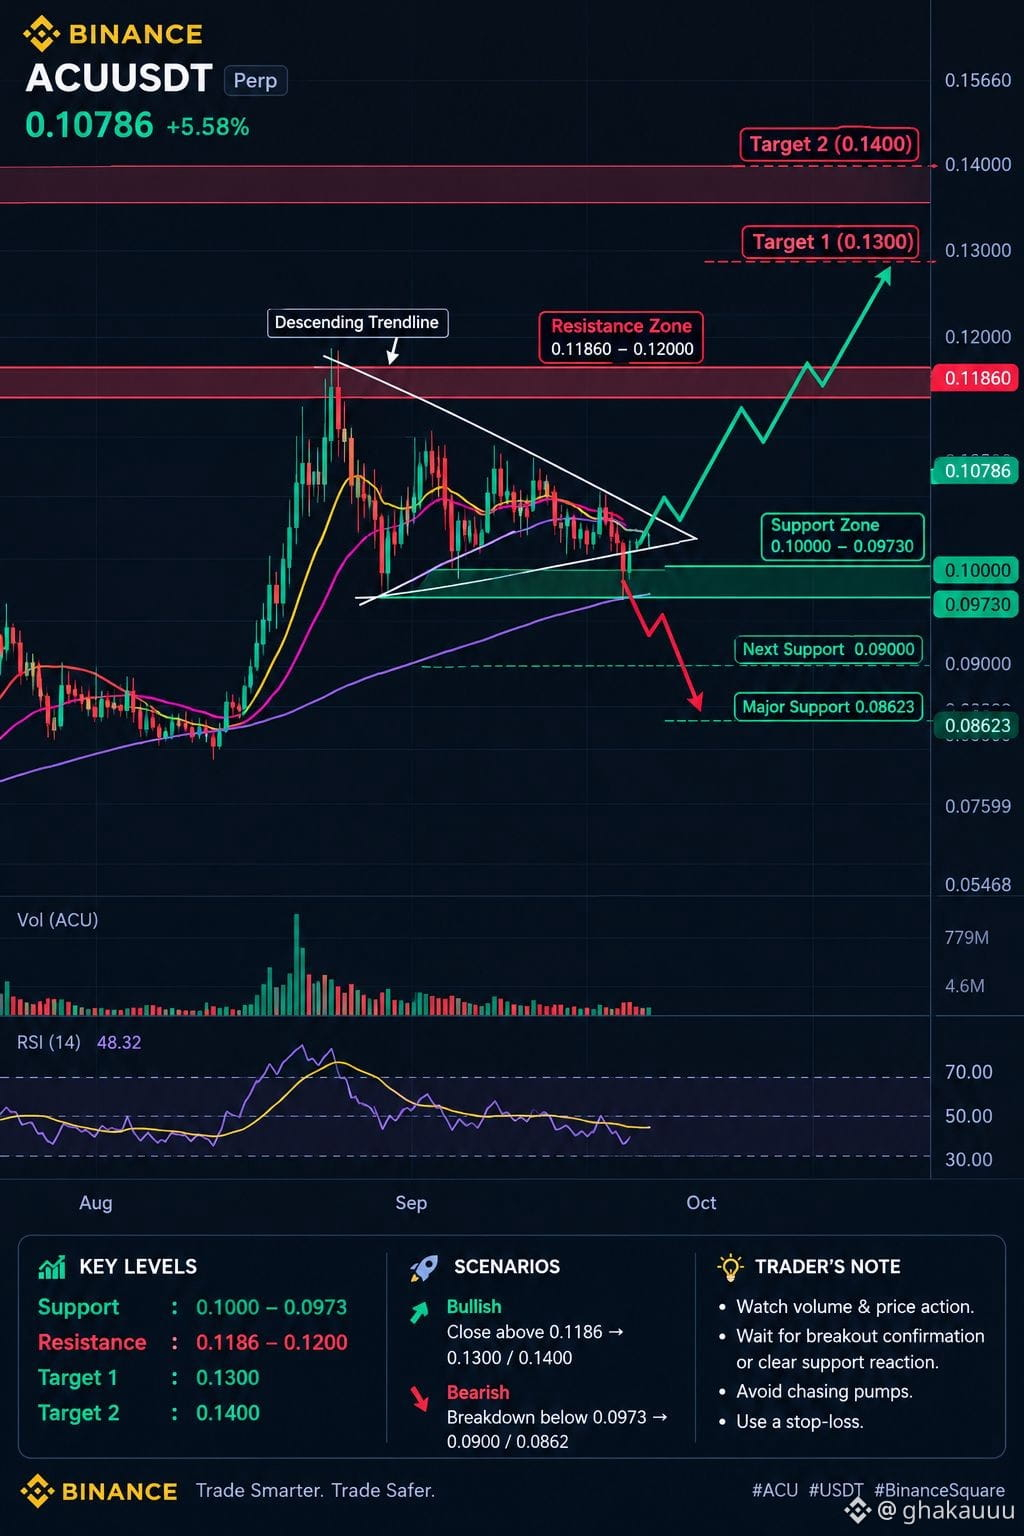
$ACU USDT PERP: Key Levels to Watch!** 📊
💰 Current Price:$0.10786 (+5.58%)
🔍Technical Analysis (1D):
* 🟢 Support:$0.1000 – $0.0973
* 🔴 Resistance:$0.1186 – $0.1200
* 🚀 Bullish Breakout: A strong close above $0.1186 could open the way toward $0.1300 and $0.1400.
* ⚠️ **Bearish Scenario:** A breakdown below $0.0973 may lead to $0.0900 and $0.0862.
📈 **Market Insight:** ACU is attempting to recover after a sharp pullback. Watch volume and price action closely before entering a trade.
🎯 **Strategy:** Wait for breakout confirmation or a clear support reaction. Avoid chasing sudden pumps, and always use a stop-loss.
💬 **What’s next for ACU — $0.12 breakout or another dip?**
#ACUSDT #CryptoTrading #BinanceSquare #TechnicalAnalysisforBeginners #Altcoins
{future}(ACUUSDT)
$ACU USDT PERP: Key Levels to Watch!** 📊
💰 Current Price:$0.10786 (+5.58%)
🔍Technical Analysis (1D):
* 🟢 Support:$0.1000 – $0.0973
* 🔴 Resistance:$0.1186 – $0.1200
* 🚀 Bullish Breakout: A strong close above $0.1186 could open the way toward $0.1300 and $0.1400.
* ⚠️ **Bearish Scenario:** A breakdown below $0.0973 may lead to $0.0900 and $0.0862.
📈 **Market Insight:** ACU is attempting to recover after a sharp pullback. Watch volume and price action closely before entering a trade.
🎯 **Strategy:** Wait for breakout confirmation or a clear support reaction. Avoid chasing sudden pumps, and always use a stop-loss.
💬 **What’s next for ACU — $0.12 breakout or another dip?**
#ACUSDT #CryptoTrading #BinanceSquare #TechnicalAnalysisforBeginners #Altcoins
💰 Current Price:$0.10786 (+5.58%)
🔍Technical Analysis (1D):
* 🟢 Support:$0.1000 – $0.0973
* 🔴 Resistance:$0.1186 – $0.1200
* 🚀 Bullish Breakout: A strong close above $0.1186 could open the way toward $0.1300 and $0.1400.
* ⚠️ **Bearish Scenario:** A breakdown below $0.0973 may lead to $0.0900 and $0.0862.
📈 **Market Insight:** ACU is attempting to recover after a sharp pullback. Watch volume and price action closely before entering a trade.
🎯 **Strategy:** Wait for breakout confirmation or a clear support reaction. Avoid chasing sudden pumps, and always use a stop-loss.
💬 **What’s next for ACU — $0.12 breakout or another dip?**
#ACUSDT #CryptoTrading #BinanceSquare #TechnicalAnalysisforBeginners #Altcoins
232

·
--

ලිපිය
Master Crypto Trading: Risk Management, Discipline, Emotional Control & Technical Analysis 🚀If you're trading crypto, this is the article that can change your trading journey. Many beginners enter the market with high hopes of making quick profits, only to lose their capital within weeks or months. Why? Because they ignore the fundamentals: Risk Management, Trading Discipline, Emotional Control, and proper Technical Analysis.
Here's a practical, no-nonsense guide tailored for Binance traders. Save this post! 💹
1. Risk Management: Protect Your Capital at All Costs
Risk management is the #1 reason why some traders survive long-term while others blow up their accounts. Crypto is extremely volatile — one bad trade can wipe out weeks of gains.
Core Rules:
1% Rule: Never risk more than 1% of your total capital on a single trade. Example: With a $10,000 account, risk maximum $100 per trade. Even after 10 losing trades in a row, you still have 90% of your capital left.
Always Use Stop-Loss & Take-Profit: Set them the moment you open a trade. Example: Buy BTC at $90,000 → Stop-Loss at $86,000 → Take-Profit at $100,000.
Position Sizing: Use low leverage. Don’t put too much money into one coin. Diversify smartly.
Dollar Cost Averaging (DCA): Great for long-term holders — buy in small amounts during dips.
Remember: Your main goal in trading is not to get rich quickly — it’s to survive long enough for the winning trades to pay off big.
2. Trading Discipline: Stick to Your Plan
Even the best strategy fails without discipline.
How to Build Discipline:
Create a clear Trading Plan with rules for entry, exit, risk per trade, and daily/weekly limits.
Keep a Trading Journal — write down every trade: why you entered, why you exited, and what you learned.
Never break your rules because of FOMO (“This looks too good to miss”).
Disciplined traders don’t react to the market — they follow their system.
3. How to Control Emotional Trading
Fear, Greed, FOMO, and Revenge Trading destroy more accounts than bad analysis ever will.
Practical Tips to Stay Calm:
When emotions rise, step away from the screen for 10–15 minutes.
Make decisions based on your plan, not feelings.
Practice mindfulness, exercise, and get good sleep.
Review your journal: “Did I take this trade out of fear or greed?”
Important Truth: Trading is 80–85% psychology and only 15–20% technical skills. Master your mind first.
4. Technical Analysis: Read Charts Like a Pro
Technical Analysis (TA) helps you identify high-probability setups using price action, patterns, and indicators.
Essential Concepts for Beginners:
Candlestick Charts: Understand buyer vs seller pressure through green/red candles.
Trend Identification: “The trend is your friend.” Trade with the trend, not against it.
Support & Resistance: Key price levels where the market often reverses or breaks.
Powerful Indicators:
Moving Averages (MA/EMA) – for trend direction
RSI – to spot overbought (>70) or oversold (<30) conditions
MACD – for momentum shifts
Volume – confirms the strength of a move
Pro Tip: Always check multiple timeframes on Binance charts (1H, 4H, Daily). Use higher timeframes for trend and lower ones for precise entry.
TA is not 100% accurate — it’s about increasing your probability of winning. Combine it with strong risk management.
Final Summary: Become a Successful Trader
Build and follow a solid Trading Plan.
Risk only 1–2% per trade.
Control your emotions through journaling and breaks.
Use Technical Analysis to find good setups.
Never stop learning — use Binance Academy and Square daily.
Important Disclaimer: This is not financial advice. Trade only with money you can afford to lose. Do your own research. Losses are part of the game — learn from them.
Drop your trading experiences in the comments! Share your best risk management tip or a TA setup you love. Like and repost to help others in the community.
Trade Smart. Stay Disciplined. Stay Profitable. 📈🔒
$BTC $BNB $ETH
#CryptoTrading #RiskManagement #TradingPsychology #TechnicalAnalysisforBeginners #Binance
Master Crypto Trading: Risk Management, Discipline, Emotional Control & Technical Analysis 🚀
If you're trading crypto, this is the article that can change your trading journey. Many beginners enter the market with high hopes of making quick profits, only to lose their capital within weeks or months. Why? Because they ignore the fundamentals: Risk Management, Trading Discipline, Emotional Control, and proper Technical Analysis.
Here's a practical, no-nonsense guide tailored for Binance traders. Save this post! 💹
1. Risk Management: Protect Your Capital at All Costs
Risk management is the #1 reason why some traders survive long-term while others blow up their accounts. Crypto is extremely volatile — one bad trade can wipe out weeks of gains.
Core Rules:
1% Rule: Never risk more than 1% of your total capital on a single trade. Example: With a $10,000 account, risk maximum $100 per trade. Even after 10 losing trades in a row, you still have 90% of your capital left.
Always Use Stop-Loss & Take-Profit: Set them the moment you open a trade. Example: Buy BTC at $90,000 → Stop-Loss at $86,000 → Take-Profit at $100,000.
Position Sizing: Use low leverage. Don’t put too much money into one coin. Diversify smartly.
Dollar Cost Averaging (DCA): Great for long-term holders — buy in small amounts during dips.
Remember: Your main goal in trading is not to get rich quickly — it’s to survive long enough for the winning trades to pay off big.
2. Trading Discipline: Stick to Your Plan
Even the best strategy fails without discipline.
How to Build Discipline:
Create a clear Trading Plan with rules for entry, exit, risk per trade, and daily/weekly limits.
Keep a Trading Journal — write down every trade: why you entered, why you exited, and what you learned.
Never break your rules because of FOMO (“This looks too good to miss”).
Disciplined traders don’t react to the market — they follow their system.
3. How to Control Emotional Trading
Fear, Greed, FOMO, and Revenge Trading destroy more accounts than bad analysis ever will.
Practical Tips to Stay Calm:
When emotions rise, step away from the screen for 10–15 minutes.
Make decisions based on your plan, not feelings.
Practice mindfulness, exercise, and get good sleep.
Review your journal: “Did I take this trade out of fear or greed?”
Important Truth: Trading is 80–85% psychology and only 15–20% technical skills. Master your mind first.
4. Technical Analysis: Read Charts Like a Pro
Technical Analysis (TA) helps you identify high-probability setups using price action, patterns, and indicators.
Essential Concepts for Beginners:
Candlestick Charts: Understand buyer vs seller pressure through green/red candles.
Trend Identification: “The trend is your friend.” Trade with the trend, not against it.
Support & Resistance: Key price levels where the market often reverses or breaks.
Powerful Indicators:
Moving Averages (MA/EMA) – for trend direction
RSI – to spot overbought (>70) or oversold (<30) conditions
MACD – for momentum shifts
Volume – confirms the strength of a move
Pro Tip: Always check multiple timeframes on Binance charts (1H, 4H, Daily). Use higher timeframes for trend and lower ones for precise entry.
TA is not 100% accurate — it’s about increasing your probability of winning. Combine it with strong risk management.
Final Summary: Become a Successful Trader
Build and follow a solid Trading Plan.
Risk only 1–2% per trade.
Control your emotions through journaling and breaks.
Use Technical Analysis to find good setups.
Never stop learning — use Binance Academy and Square daily.
Important Disclaimer: This is not financial advice. Trade only with money you can afford to lose. Do your own research. Losses are part of the game — learn from them.
Drop your trading experiences in the comments! Share your best risk management tip or a TA setup you love. Like and repost to help others in the community.
Trade Smart. Stay Disciplined. Stay Profitable. 📈🔒
$BTC $BNB $ETH
#CryptoTrading #RiskManagement #TradingPsychology #TechnicalAnalysisforBeginners #Binance
Here's a practical, no-nonsense guide tailored for Binance traders. Save this post! 💹
1. Risk Management: Protect Your Capital at All Costs
Risk management is the #1 reason why some traders survive long-term while others blow up their accounts. Crypto is extremely volatile — one bad trade can wipe out weeks of gains.
Core Rules:
1% Rule: Never risk more than 1% of your total capital on a single trade. Example: With a $10,000 account, risk maximum $100 per trade. Even after 10 losing trades in a row, you still have 90% of your capital left.
Always Use Stop-Loss & Take-Profit: Set them the moment you open a trade. Example: Buy BTC at $90,000 → Stop-Loss at $86,000 → Take-Profit at $100,000.
Position Sizing: Use low leverage. Don’t put too much money into one coin. Diversify smartly.
Dollar Cost Averaging (DCA): Great for long-term holders — buy in small amounts during dips.
Remember: Your main goal in trading is not to get rich quickly — it’s to survive long enough for the winning trades to pay off big.
2. Trading Discipline: Stick to Your Plan
Even the best strategy fails without discipline.
How to Build Discipline:
Create a clear Trading Plan with rules for entry, exit, risk per trade, and daily/weekly limits.
Keep a Trading Journal — write down every trade: why you entered, why you exited, and what you learned.
Never break your rules because of FOMO (“This looks too good to miss”).
Disciplined traders don’t react to the market — they follow their system.
3. How to Control Emotional Trading
Fear, Greed, FOMO, and Revenge Trading destroy more accounts than bad analysis ever will.
Practical Tips to Stay Calm:
When emotions rise, step away from the screen for 10–15 minutes.
Make decisions based on your plan, not feelings.
Practice mindfulness, exercise, and get good sleep.
Review your journal: “Did I take this trade out of fear or greed?”
Important Truth: Trading is 80–85% psychology and only 15–20% technical skills. Master your mind first.
4. Technical Analysis: Read Charts Like a Pro
Technical Analysis (TA) helps you identify high-probability setups using price action, patterns, and indicators.
Essential Concepts for Beginners:
Candlestick Charts: Understand buyer vs seller pressure through green/red candles.
Trend Identification: “The trend is your friend.” Trade with the trend, not against it.
Support & Resistance: Key price levels where the market often reverses or breaks.
Powerful Indicators:
Moving Averages (MA/EMA) – for trend direction
RSI – to spot overbought (>70) or oversold (<30) conditions
MACD – for momentum shifts
Volume – confirms the strength of a move
Pro Tip: Always check multiple timeframes on Binance charts (1H, 4H, Daily). Use higher timeframes for trend and lower ones for precise entry.
TA is not 100% accurate — it’s about increasing your probability of winning. Combine it with strong risk management.
Final Summary: Become a Successful Trader
Build and follow a solid Trading Plan.
Risk only 1–2% per trade.
Control your emotions through journaling and breaks.
Use Technical Analysis to find good setups.
Never stop learning — use Binance Academy and Square daily.
Important Disclaimer: This is not financial advice. Trade only with money you can afford to lose. Do your own research. Losses are part of the game — learn from them.
Drop your trading experiences in the comments! Share your best risk management tip or a TA setup you love. Like and repost to help others in the community.
Trade Smart. Stay Disciplined. Stay Profitable. 📈🔒
$BTC $BNB $ETH
#CryptoTrading #RiskManagement #TradingPsychology #TechnicalAnalysisforBeginners #Binance
1
8
36

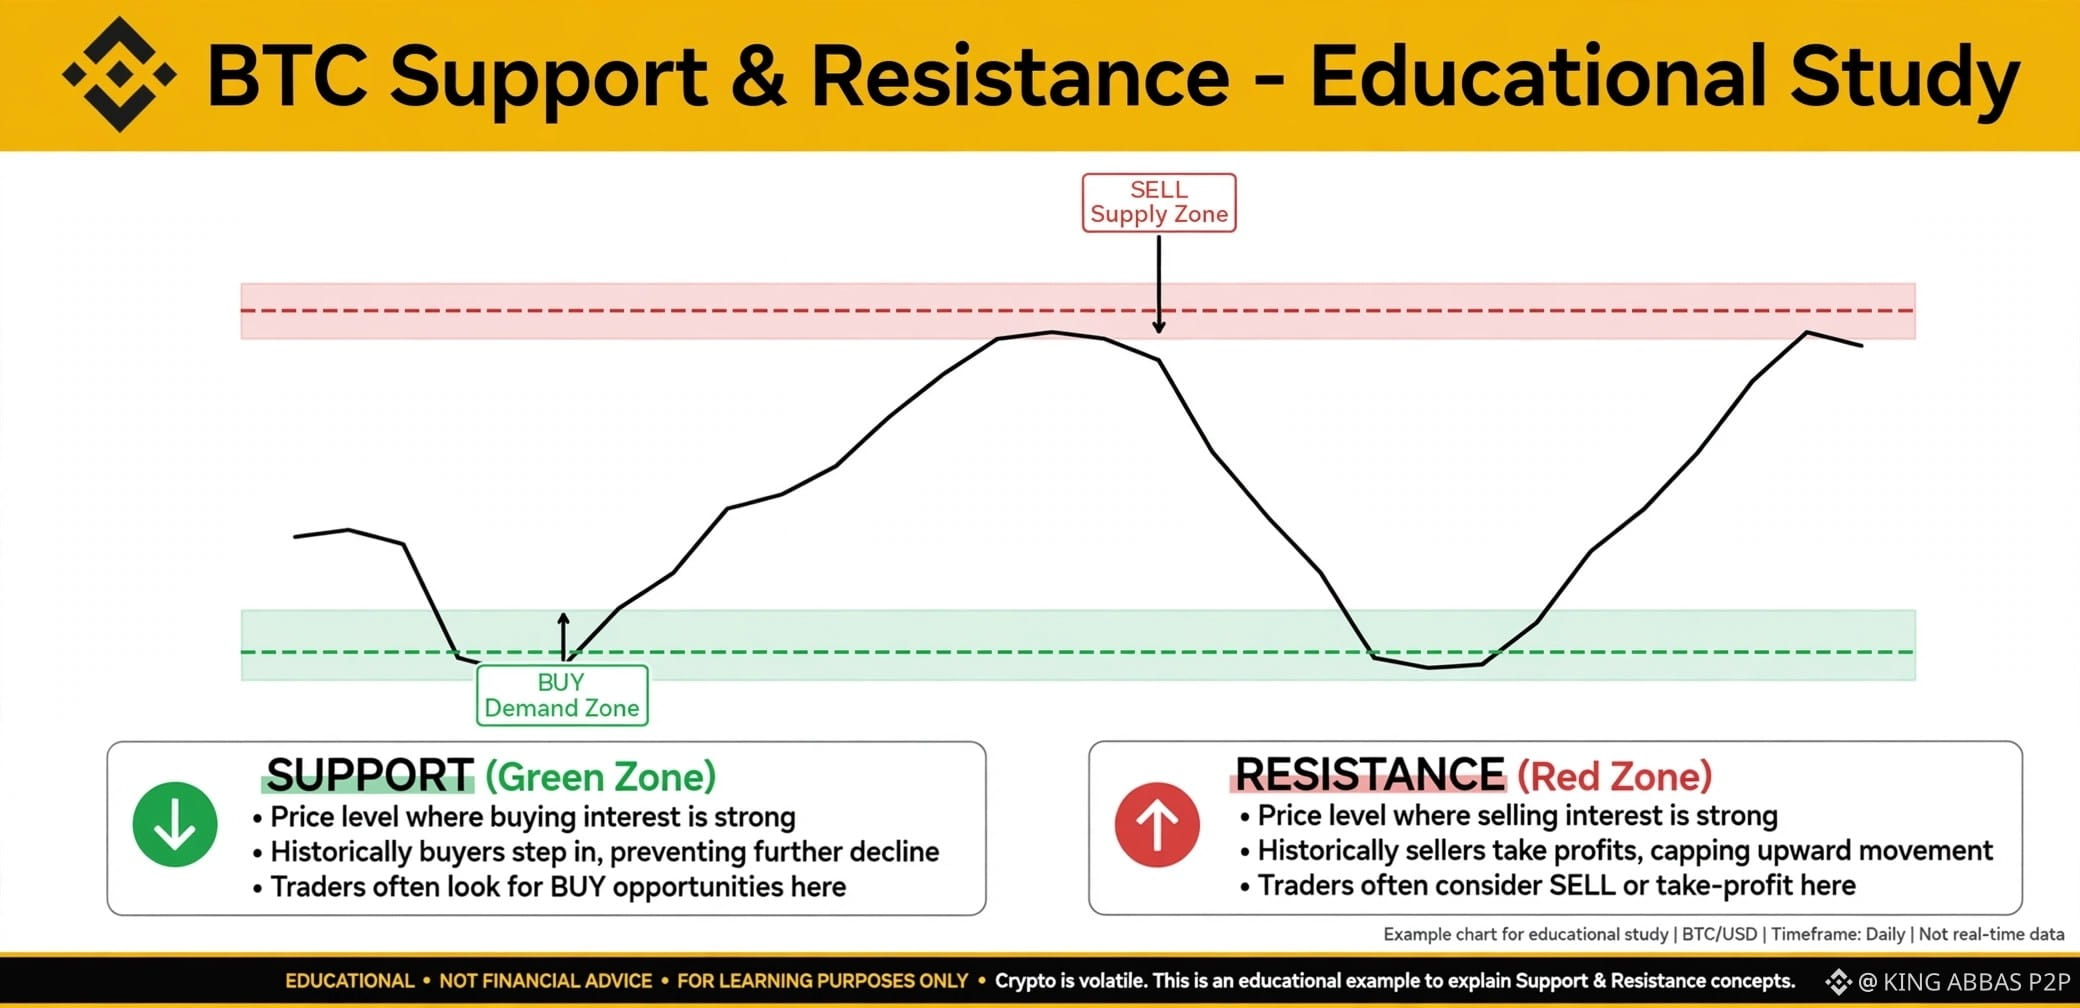
BTC Support & Resistance Explained - Simple Learning 📚
Many beginners get confused, so I made this simple guide for learning.
✅ SUPPORT (Green Zone):
Price level where buyers are strong. Market often bounces from here.
❌ RESISTANCE (Red Zone):
Price level where sellers are strong. Market often rejects from here.
This chart is a simplified educational example to understand the concept. Real market is more complex and volatile.
I am sharing my learning journey, day by day. We learn together!
Did you understand Support & Resistance now? Comment YES if this helped you 👇
⚠️ Disclaimer: This is for education only. Not financial advice. Crypto is risky, always do your own research.
#BTC☀️ #Bitcoin❗ #Cryptoeducationd n #supportandresistance #TechnicalAnalysisforBeginners #BTCUSD #LearnAndEarn #BinanceSquare #PakistanCrypto #KINGABBASP2P
BTC Support & Resistance Explained - Simple Learning 📚
Many beginners get confused, so I made this simple guide for learning.
✅ SUPPORT (Green Zone):
Price level where buyers are strong. Market often bounces from here.
❌ RESISTANCE (Red Zone):
Price level where sellers are strong. Market often rejects from here.
This chart is a simplified educational example to understand the concept. Real market is more complex and volatile.
I am sharing my learning journey, day by day. We learn together!
Did you understand Support & Resistance now? Comment YES if this helped you 👇
⚠️ Disclaimer: This is for education only. Not financial advice. Crypto is risky, always do your own research.
#BTC☀️ #Bitcoin❗ #Cryptoeducationd n #supportandresistance #TechnicalAnalysisforBeginners #BTCUSD #LearnAndEarn #BinanceSquare #PakistanCrypto #KINGABBASP2P
Many beginners get confused, so I made this simple guide for learning.
✅ SUPPORT (Green Zone):
Price level where buyers are strong. Market often bounces from here.
❌ RESISTANCE (Red Zone):
Price level where sellers are strong. Market often rejects from here.
This chart is a simplified educational example to understand the concept. Real market is more complex and volatile.
I am sharing my learning journey, day by day. We learn together!
Did you understand Support & Resistance now? Comment YES if this helped you 👇
⚠️ Disclaimer: This is for education only. Not financial advice. Crypto is risky, always do your own research.
#BTC☀️ #Bitcoin❗ #Cryptoeducationd n #supportandresistance #TechnicalAnalysisforBeginners #BTCUSD #LearnAndEarn #BinanceSquare #PakistanCrypto #KINGABBASP2P
126
තවත් අන්තර්ගතයන් ගවේෂණය කිරීමට ඇතුල් වන්න
Binance චතුරශ්රය හි ගෝලීය ක්රිප්ටෝ පරිශීලකයින් හා එක්වන්න
⚡️ ක්රිප්ටෝ පිළිබඳ නවතම සහ ප්රයෝජනවත් තොරතුරු ලබා ගන්න.
💬 ලොව විශාලතම ක්රිප්ටෝ හුවමාරුව මගින් විශ්වාස කෙරේ.
👍 සත්යායනය කරන ලද නිර්මාණකරුවන්ගෙන් සැබෑ විදසුන් සොයා ගන්න.
විද්යුත් තැපෑල / දුරකථන අංකය
නැගී එන මාතෘකා
1
#NvidiaBeatsEstimatesWith$130BQ4Outlook
7,746 නැරඹීම්
119 සාකච්ඡා කරමින්
2
#AnthropicIPOPriceCouldExceed$80
13,946 නැරඹීම්
117 සාකච්ඡා කරමින්
3
#CanNvidia’sDataCenterGrowthContinue?
40,601 නැරඹීම්
562 සාකච්ඡා කරමින්
4
#CanadaAndUSLaunchOperationNiagaraAgainstApprovalPhishing
169 නැරඹීම්
11 සාකච්ඡා කරමින්
5
#BankOfEnglandUnveilsClearingHousePathwayCoveringDLTFirms
1,332 නැරඹීම්
26 සාකච්ඡා කරමින්
6
#DBSAndCirclePartnerToExpandAsianInstitutionsUSDCAccess
2,767 නැරඹීම්
44 සාකච්ඡා කරමින්
7
#LedgerHardwareImplantReportsExtendToDubai
10,194 නැරඹීම්
191 සාකච්ඡා කරමින්
8
#NvidiaBoardNotConsideringHuang’sReturnasCEO
202,755 නැරඹීම්
1,460 සාකච්ඡා කරමින්
9
#KOSPIFalls2.59%ToLowestCloseSinceFebruary
57,675 නැරඹීම්
661 සාකච්ඡා කරමින්
10
#AnthropicClearedToListOnNasdaqAsANT
51,531 නැරඹීම්
535 සාකච්ඡා කරමින්