

#technicalanalys
technicalanalys
110,455 නැරඹීම්
443 සාකච්ඡා කරමින්
උණුසුම්
නවතම

Sure, here's the English version with hashtags, ready to post on your banners:
$ZEC
{spot}(ZECUSDT)
USDT Perp Chart Analysis (Zcash)**
- **Trading pair:** ZECUSDT Perpetual Futures (Zcash), on Binance
- **Current price:** about 1,186.64 USDT (roughly ₨328,485)
- **24h range:** High 1,225.00, Low 1,118.80
- **24h change:** +3.10%
- **1h chart:** Price fell from 1,225 to around 1,176, then recovered to about 1,186. Recent candles are small, showing market uncertainty.
- **Volume:** Higher volume came with the earlier sell-off. Volume has eased recently.
- **Performance:** Today -0.17% | 7 days +3.76% | 30 days -23.80% | 90 days +141.29% | 1 year +364.46%
**Risk note:** Perpetual futures use leverage and carry high risk. Crypto prices are very volatile, and past moves do not predict future results. Always use stop-losses and only trade what you can afford to lose.
#ZECUSDT #CryptoAnalysis" #TechnicalAnalys #RiskManagementMastery #crypto
Sure, here's the English version with hashtags, ready to post on your banners:
$ZEC
USDT Perp Chart Analysis (Zcash)**
- **Trading pair:** ZECUSDT Perpetual Futures (Zcash), on Binance
- **Current price:** about 1,186.64 USDT (roughly ₨328,485)
- **24h range:** High 1,225.00, Low 1,118.80
- **24h change:** +3.10%
- **1h chart:** Price fell from 1,225 to around 1,176, then recovered to about 1,186. Recent candles are small, showing market uncertainty.
- **Volume:** Higher volume came with the earlier sell-off. Volume has eased recently.
- **Performance:** Today -0.17% | 7 days +3.76% | 30 days -23.80% | 90 days +141.29% | 1 year +364.46%
**Risk note:** Perpetual futures use leverage and carry high risk. Crypto prices are very volatile, and past moves do not predict future results. Always use stop-losses and only trade what you can afford to lose.
#ZECUSDT #CryptoAnalysis" #TechnicalAnalys #RiskManagementMastery #crypto
222

·
--
උසබ තත්ත්වය
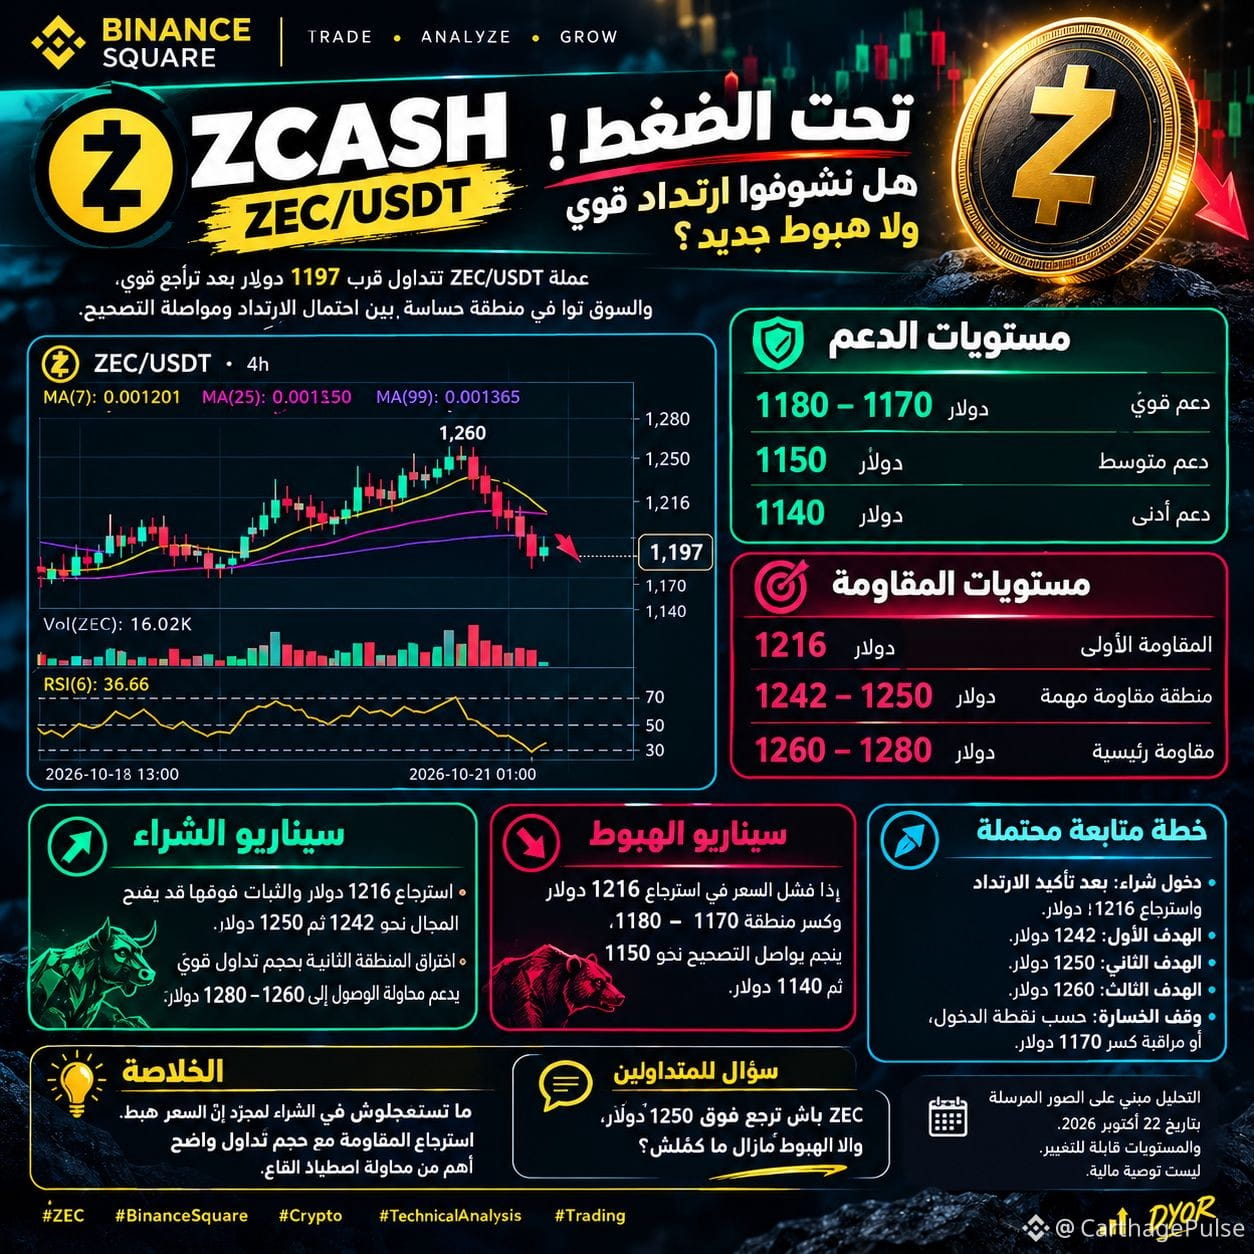
🚨 ZEC تحت الضغط! هل نشوفوا ارتداد قوي ولا هبوط جديد؟
عملة ZEC/USDT تتداول قرب 1197 دولار بعد تراجع قوي، والسوق توّا في منطقة حسّاسة بين احتمال الارتداد ومواصلة التصحيح.
📊 مستويات الدعم:
🟢 1180 – 1170 دولار
🟢 1150 دولار
🟢 1140 دولار
🔴 مستويات المقاومة:
1️⃣ 1216 دولار
2️⃣ 1242 – 1250 دولار
3️⃣ 1260 – 1280 دولار
📈 سيناريو الشراء:
استرجاع 1216 دولار والثبات فوقها قد يفتح المجال نحو 1242 ثم 1250 دولار. اختراق المنطقة الثانية بحجم تداول قوي يدعم محاولة الوصول إلى 1260–1280 دولار.
📉 سيناريو الهبوط:
إذا فشل السعر في استرجاع 1216 دولار وكسر منطقة 1170–1180، ينجم يواصل التصحيح نحو 1150 ثم 1140 دولار.
🎯 خطة متابعة محتملة:
- دخول شراء: بعد تأكيد الارتداد واسترجاع 1216 دولار.
- الهدف الأول: 1242 دولار.
- الهدف الثاني: 1250 دولار.
- الهدف الثالث: 1260 دولار.
- وقف الخسارة: يتحدّد حسب نقطة الدخول، ويمكن مراقبة كسر 1170 دولار كإشارة ضعف.
💡 الخلاصة: ما تستعجلوش في الشراء لمجرّد إنّ السعر هبط. استرجاع المقاومة مع حجم تداول واضح أهم من محاولة اصطياد القاع.
🔥 سؤال للمتداولين: ZEC باش ترجع فوق 1250 دولار، وإلا الهبوط مازال ما كمّلش؟
⚠️ المستويات تقديرية بتاريخ 22 أكتوبر 2026، وليست أسعارًا مباشرة أو توصية مالية. تأكّد من السعر الحالي قبل أي صفقة.
#ZECUSDT C #BinanceSquare #crypto #TechnicalAnalys sis #trading $ZEC
{future}(ZECUSDT)
🚨 ZEC تحت الضغط! هل نشوفوا ارتداد قوي ولا هبوط جديد؟
عملة ZEC/USDT تتداول قرب 1197 دولار بعد تراجع قوي، والسوق توّا في منطقة حسّاسة بين احتمال الارتداد ومواصلة التصحيح.
📊 مستويات الدعم:
🟢 1180 – 1170 دولار
🟢 1150 دولار
🟢 1140 دولار
🔴 مستويات المقاومة:
1️⃣ 1216 دولار
2️⃣ 1242 – 1250 دولار
3️⃣ 1260 – 1280 دولار
📈 سيناريو الشراء:
استرجاع 1216 دولار والثبات فوقها قد يفتح المجال نحو 1242 ثم 1250 دولار. اختراق المنطقة الثانية بحجم تداول قوي يدعم محاولة الوصول إلى 1260–1280 دولار.
📉 سيناريو الهبوط:
إذا فشل السعر في استرجاع 1216 دولار وكسر منطقة 1170–1180، ينجم يواصل التصحيح نحو 1150 ثم 1140 دولار.
🎯 خطة متابعة محتملة:
- دخول شراء: بعد تأكيد الارتداد واسترجاع 1216 دولار.
- الهدف الأول: 1242 دولار.
- الهدف الثاني: 1250 دولار.
- الهدف الثالث: 1260 دولار.
- وقف الخسارة: يتحدّد حسب نقطة الدخول، ويمكن مراقبة كسر 1170 دولار كإشارة ضعف.
💡 الخلاصة: ما تستعجلوش في الشراء لمجرّد إنّ السعر هبط. استرجاع المقاومة مع حجم تداول واضح أهم من محاولة اصطياد القاع.
🔥 سؤال للمتداولين: ZEC باش ترجع فوق 1250 دولار، وإلا الهبوط مازال ما كمّلش؟
⚠️ المستويات تقديرية بتاريخ 22 أكتوبر 2026، وليست أسعارًا مباشرة أو توصية مالية. تأكّد من السعر الحالي قبل أي صفقة.
#ZECUSDT C #BinanceSquare #crypto #TechnicalAnalys sis #trading $ZEC
145

·
--
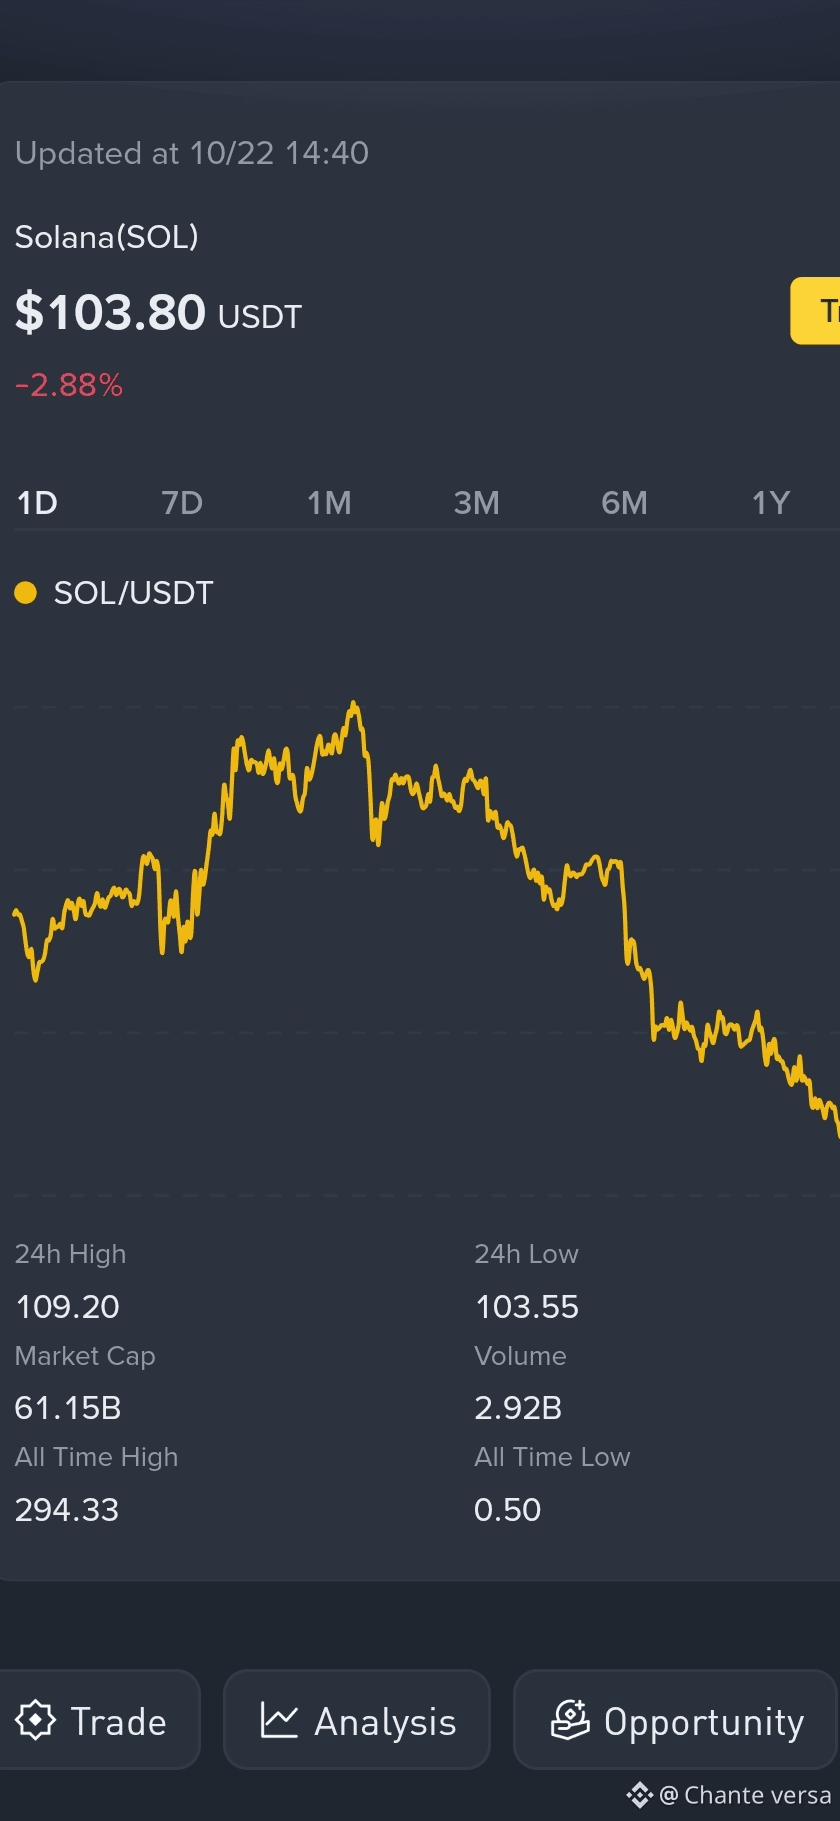
$SOL ki daily candle mein volatility nazar aa rahi hai.
Price $103.81 ke aas paas hai aur aaj ki candle open se neeche trade kar rahi hai. RSI 34 ke qareeb hai, jabke MACD abhi bearish trend show kar raha hai.
Candle ko akelay dekhne ke bajaye volume, support/resistance aur overall market trend ko bhi check karna zaroori hai.
#SOL #Crypto_Jobs🎯 o #candlestick ck #trading #TechnicalAnalys is #BİNANCE
66

$TRB Is Making Noise. Is This Another Squeeze Setup? 👀
Trading around $19-$20, up ~8% on the month. With only ~2.8M tokens circulating, TRB can swing hard, like its 42% one-day jump in April.
🔹 Support: ~$18.50
🔹 Resistance: ~$21.90
🔹 Plan: wait for a close above $21.90, with a stop-loss
💬 Breakout or fakeout? 👇
{future}(TRBUSDT)
⚠️ Not financial advice. DYOR.
#TRB #Tellor #TechnicalAnalys #BinanceSquare
$TRB Is Making Noise. Is This Another Squeeze Setup? 👀
Trading around $19-$20, up ~8% on the month. With only ~2.8M tokens circulating, TRB can swing hard, like its 42% one-day jump in April.
🔹 Support: ~$18.50
🔹 Resistance: ~$21.90
🔹 Plan: wait for a close above $21.90, with a stop-loss
💬 Breakout or fakeout? 👇
⚠️ Not financial advice. DYOR.
#TRB #Tellor #TechnicalAnalys #BinanceSquare
297
$WAL Just Broke Out, and the Shorts Got Squeezed 🚀
Up ~25% today and ~49% on the week, near $0.058 after DATA Network named Walrus its default storage. $5.67M in shorts were liquidated.
🔹 Support: $0.0559 (200-day average)
🔹 Resistance: $0.0658, then $0.075
🔹 Plan: don’t chase. Wait for a retest of $0.0559, with a stop-loss.
💬 Retest or run to $0.075? 👇
{future}(WALUSDT)
⚠️ Not financial advice. DYOR.
#WAL #Walrus #TechnicalAnalys #BinanceSquare
$WAL Just Broke Out, and the Shorts Got Squeezed 🚀
Up ~25% today and ~49% on the week, near $0.058 after DATA Network named Walrus its default storage. $5.67M in shorts were liquidated.
🔹 Support: $0.0559 (200-day average)
🔹 Resistance: $0.0658, then $0.075
🔹 Plan: don’t chase. Wait for a retest of $0.0559, with a stop-loss.
💬 Retest or run to $0.075? 👇
⚠️ Not financial advice. DYOR.
#WAL #Walrus #TechnicalAnalys #BinanceSquare
1
236
$CELO Is Holding $0.10, and the Buybacks Are Quietly Adding Up 👀
Up ~35% on the month, now around $0.10. Buybacks have reached 9.1M CELO, and Q3 revenue is up 21%.
🔹 Support: ~$0.088
🔹 Resistance: ~$0.119
🔹 Plan: wait for a close above $0.119, with a stop-loss
💬 Breakout or range? 👇
{future}(CELOUSDT)
⚠️ Not financial advice. DYOR.
#CELO #Celo #TechnicalAnalys #BinanceSquare
$CELO Is Holding $0.10, and the Buybacks Are Quietly Adding Up 👀
Up ~35% on the month, now around $0.10. Buybacks have reached 9.1M CELO, and Q3 revenue is up 21%.
🔹 Support: ~$0.088
🔹 Resistance: ~$0.119
🔹 Plan: wait for a close above $0.119, with a stop-loss
💬 Breakout or range? 👇
⚠️ Not financial advice. DYOR.
#CELO #Celo #TechnicalAnalys #BinanceSquare
Up ~35% on the month, now around $0.10. Buybacks have reached 9.1M CELO, and Q3 revenue is up 21%.
🔹 Support: ~$0.088
🔹 Resistance: ~$0.119
🔹 Plan: wait for a close above $0.119, with a stop-loss
💬 Breakout or range? 👇
⚠️ Not financial advice. DYOR.
#CELO #Celo #TechnicalAnalys #BinanceSquare
84

·
--
$ARC
{future}(ARCUSDT)
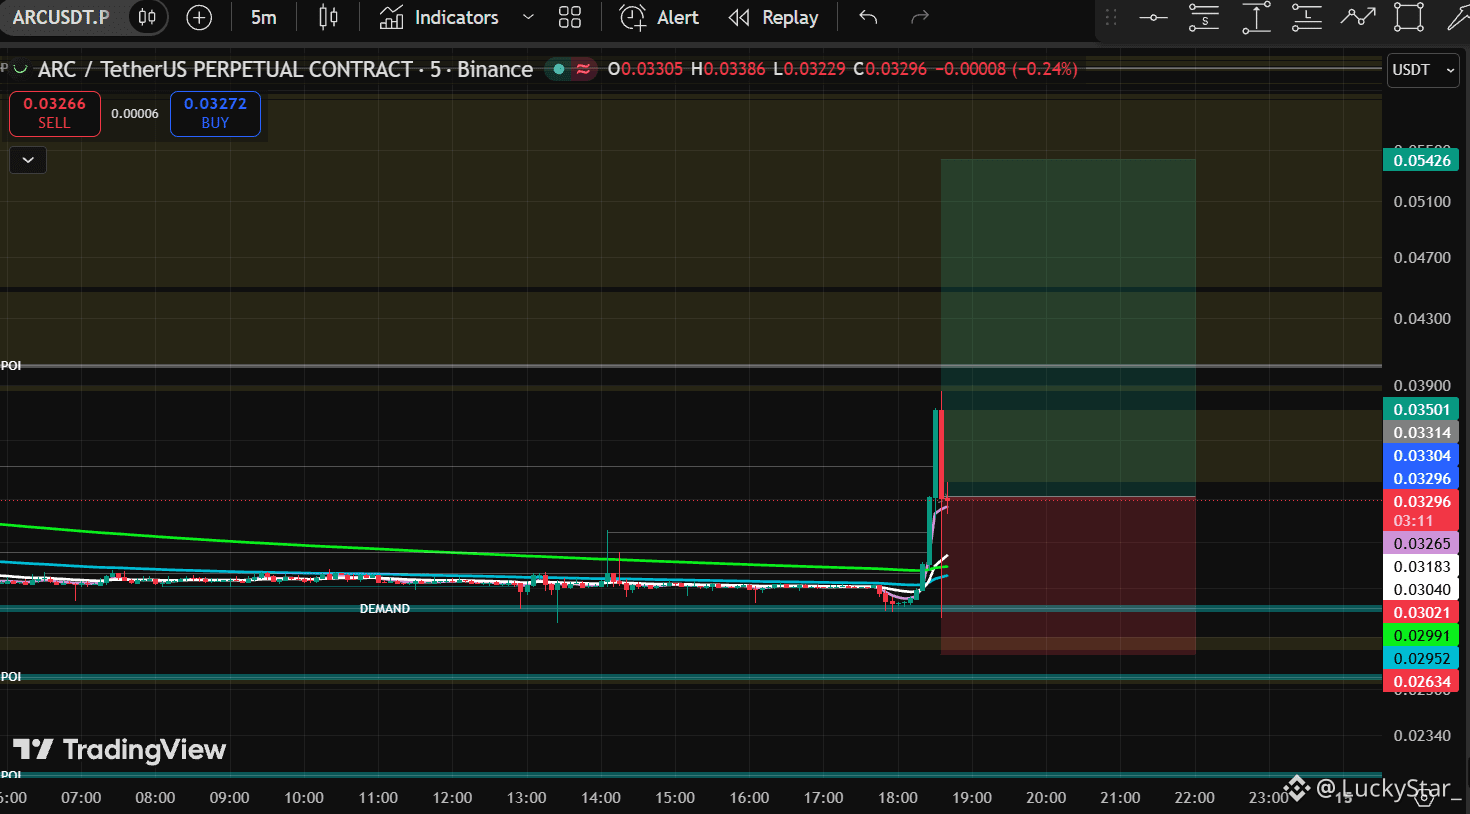
📈 It is not the strength of the movement that determines the trend, but the behavior of the price near key levels.
Each local correction is quickly bought up, preserving the upward structure. This creates good prerequisites for continued upward movement.
It is worth closely monitoring the reaction near the nearest resistance.
#ARC #TechnicalAnalys #long #Arcusdt
$ARC
📈 It is not the strength of the movement that determines the trend, but the behavior of the price near key levels.
Each local correction is quickly bought up, preserving the upward structure. This creates good prerequisites for continued upward movement.
It is worth closely monitoring the reaction near the nearest resistance.
#ARC #TechnicalAnalys #long #Arcusdt
1
29

BTCUSDT Futures: Bearish Divergence and Compressed Volume Signal Caution on 1H Chart
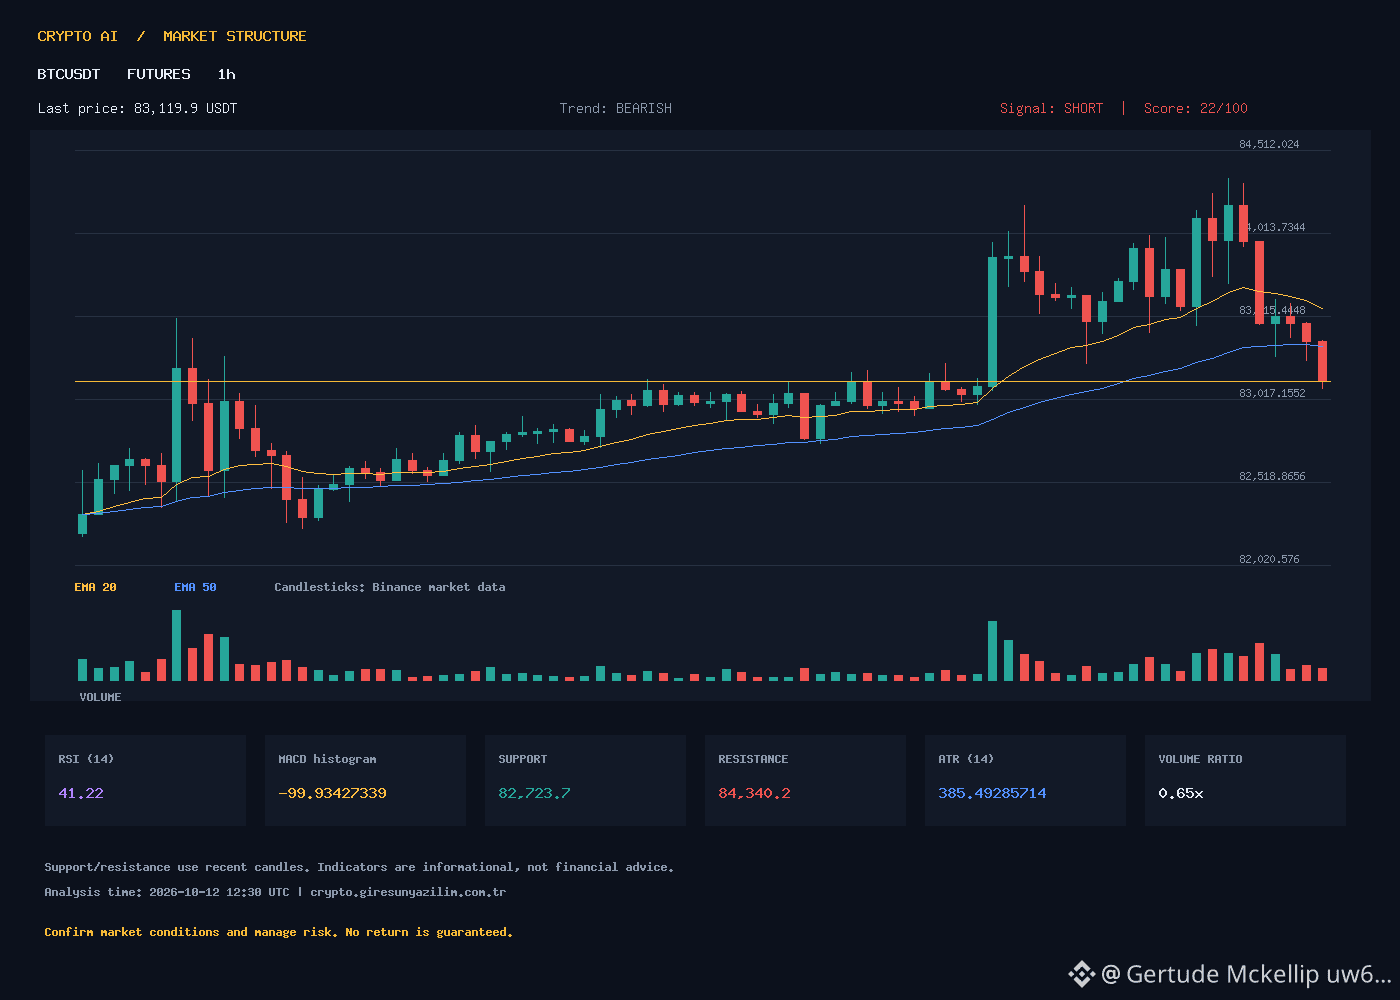
Bitcoin (BTCUSDT) futures on the 1-hour chart are exhibiting technical weakness as price consolidates below key moving averages, reflecting a fragile market structure. The most recent candle closed at $83,119.9, marking a modest decline from the session high of $83,365.5 and reinforcing the bearish short-term trend.
Price remains sandwiched between the 20-period ($83,559.9) and 50-period EMAs ($83,334.8), with the 200-period EMA looming above at $83,944.1. This descending moving average alignment highlights ongoing bearish momentum, echoed by a technical score of 22 and a "SHORT" signal from the analytics platform.
The Relative Strength Index (RSI) reads 41.22, edging closer to oversold territory but not yet confirming a reversal. Meanwhile, the MACD histogram has deepened into negative territory at -99.93, while the MACD line (37.53) continues to trail the signal line (137.46), signaling persistent bearish divergence.
Market volatility, as measured by the Average True Range (ATR) of $385.49, suggests room for sharp intraday swings, particularly if volume picks up. However, current trading volume stands at 2,767.55, only 65% of its average, indicating muted participation and increasing the risk of false breakouts.
Key support is observed at $82,723.7, while resistance sits at $84,340.2. A break below support could accelerate downside pressure toward lower levels, whereas reclaiming the 200-period EMA may shift momentum toward the bullish side.
While the structure leans bearish, low volume and compressed ranges caution against aggressive positioning. Traders should await clearer confirmation before acting on the current SHORT bias.
#BTCUSDT #Bitcoin #CryptoTrading #TechnicalAnalys
9

·
--
$SOL /USDT is currently trading at $109.46, sitting just above a critical support zone at $106.44
📊 (Long)
Entry: $109.46
Take-Profit (TP): $117.72
Stop-Loss (SL): $105.00
Manage your risk strictly and never overleverage. 📉📈
#sol #solana #cryptotrading #TechnicalAnalys
{future}(SOLUSDT)
$SOL /USDT is currently trading at $109.46, sitting just above a critical support zone at $106.44
📊 (Long)
Entry: $109.46
Take-Profit (TP): $117.72
Stop-Loss (SL): $105.00
Manage your risk strictly and never overleverage. 📉📈
#sol #solana #cryptotrading #TechnicalAnalys
📊 (Long)
Entry: $109.46
Take-Profit (TP): $117.72
Stop-Loss (SL): $105.00
Manage your risk strictly and never overleverage. 📉📈
#sol #solana #cryptotrading #TechnicalAnalys
113

·
--
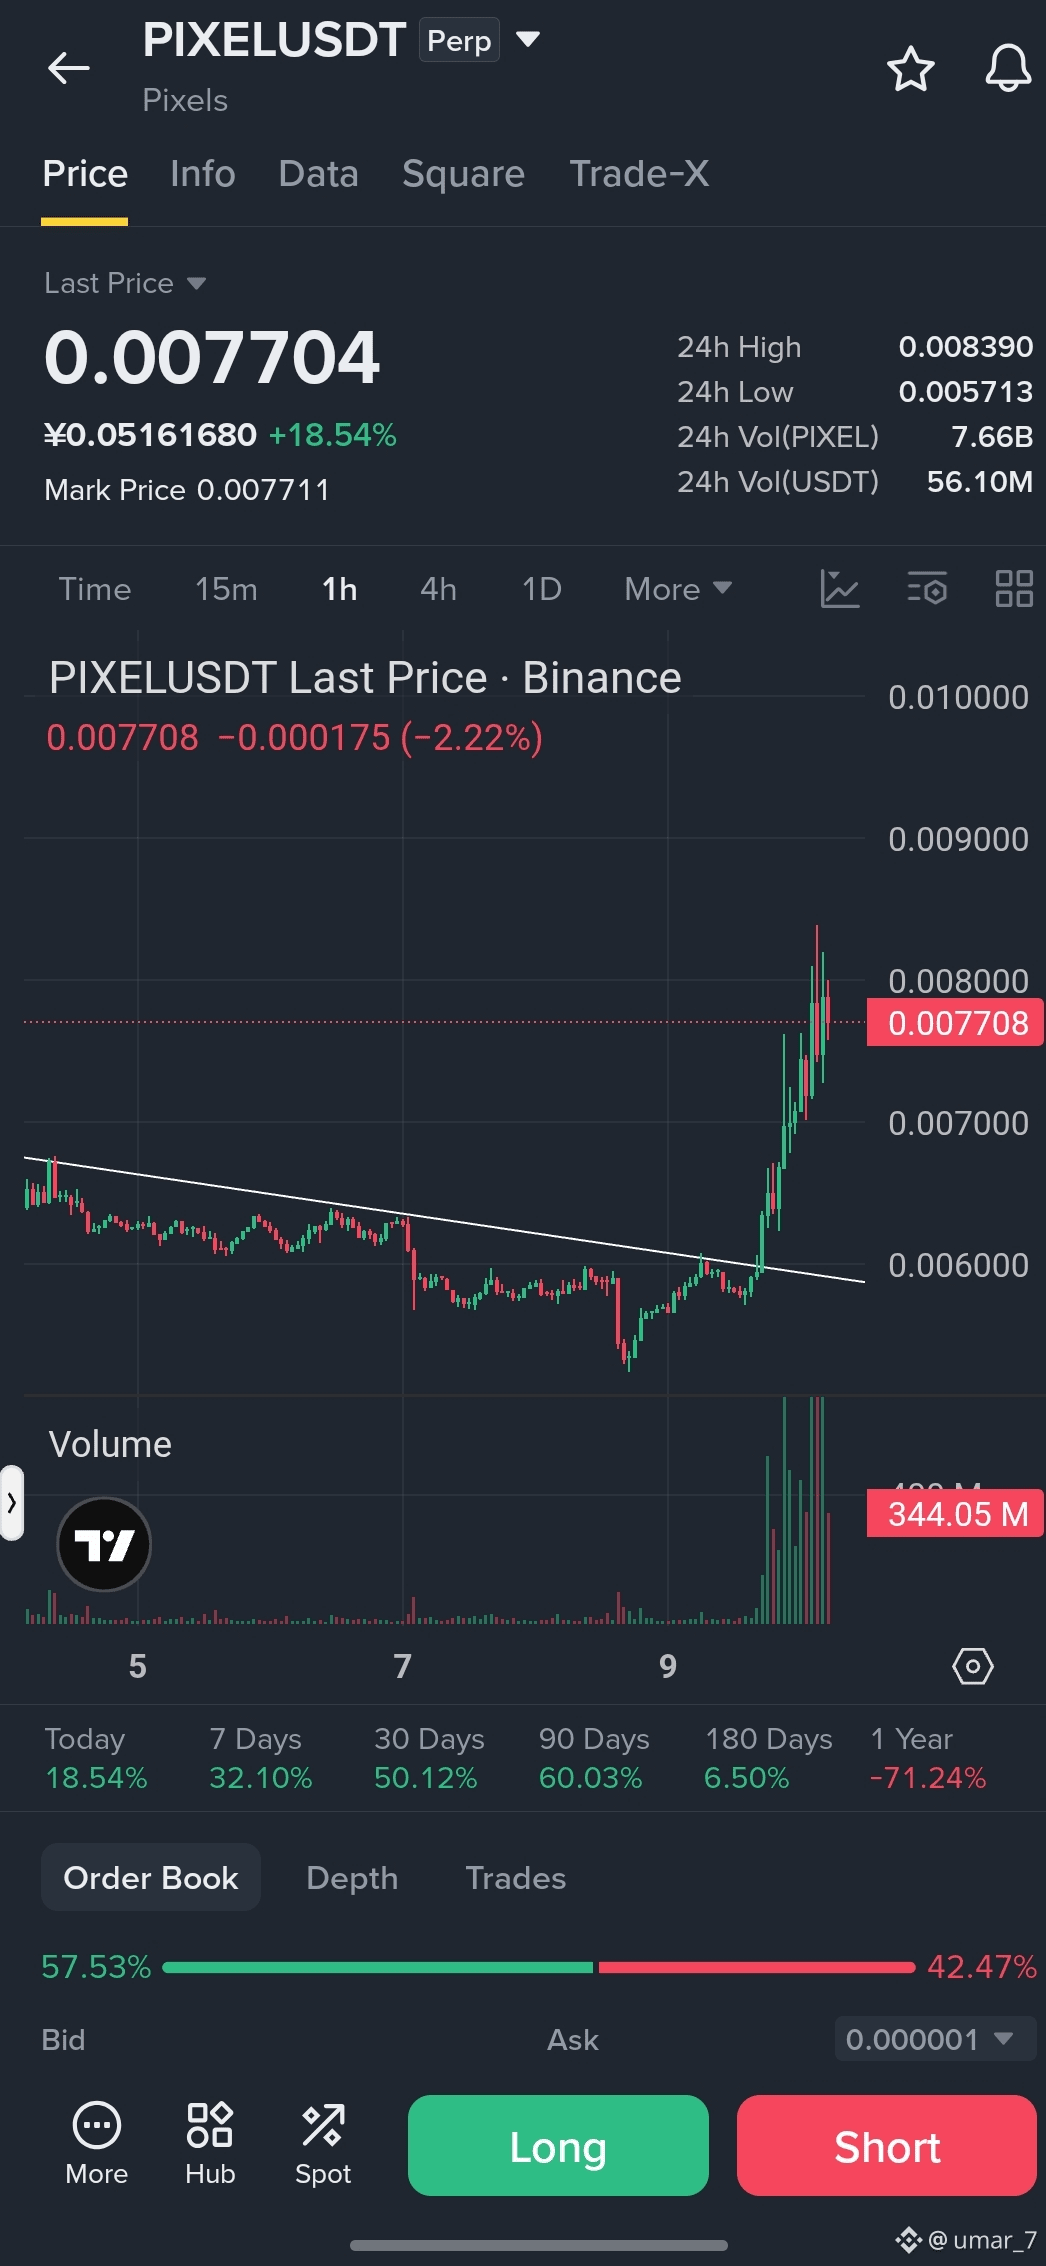
🚀 $PIXEL Breakout Expansion: Multi-Day Trendline Shattered!
Pixels ($PIXEL) is putting on a huge show on the 1-hour chart, printing a massive +18.54% daily gain and slicing right through its diagonal resistance line. Buyer volume has spiked massively to 344M+ PIXEL, with price rocketing up to hit a 24h high near $0.008390 before consolidating around $0.0077.
Current Price: ~$0.007704
24h High: ~$0.008390
Breakout Level: ~$0.00600
Sentiment: Bullish 📈
Are you riding this $PIXEL gamefi momentum or waiting for a pull-back retest? Hit Follow so you don't miss our daily breakout setups! 👇
$PIXEL
#PIXEL/USDT #CryptoSquare #TechnicalAnalys
{future}(PIXELUSDT)
🚀 $PIXEL Breakout Expansion: Multi-Day Trendline Shattered!
Pixels ($PIXEL ) is putting on a huge show on the 1-hour chart, printing a massive +18.54% daily gain and slicing right through its diagonal resistance line. Buyer volume has spiked massively to 344M+ PIXEL, with price rocketing up to hit a 24h high near $0.008390 before consolidating around $0.0077.
Current Price: ~$0.007704
24h High: ~$0.008390
Breakout Level: ~$0.00600
Sentiment: Bullish 📈
Are you riding this $PIXEL gamefi momentum or waiting for a pull-back retest? Hit Follow so you don't miss our daily breakout setups! 👇
$PIXEL
#PIXEL/USDT #CryptoSquare #TechnicalAnalys
2
157
·
--
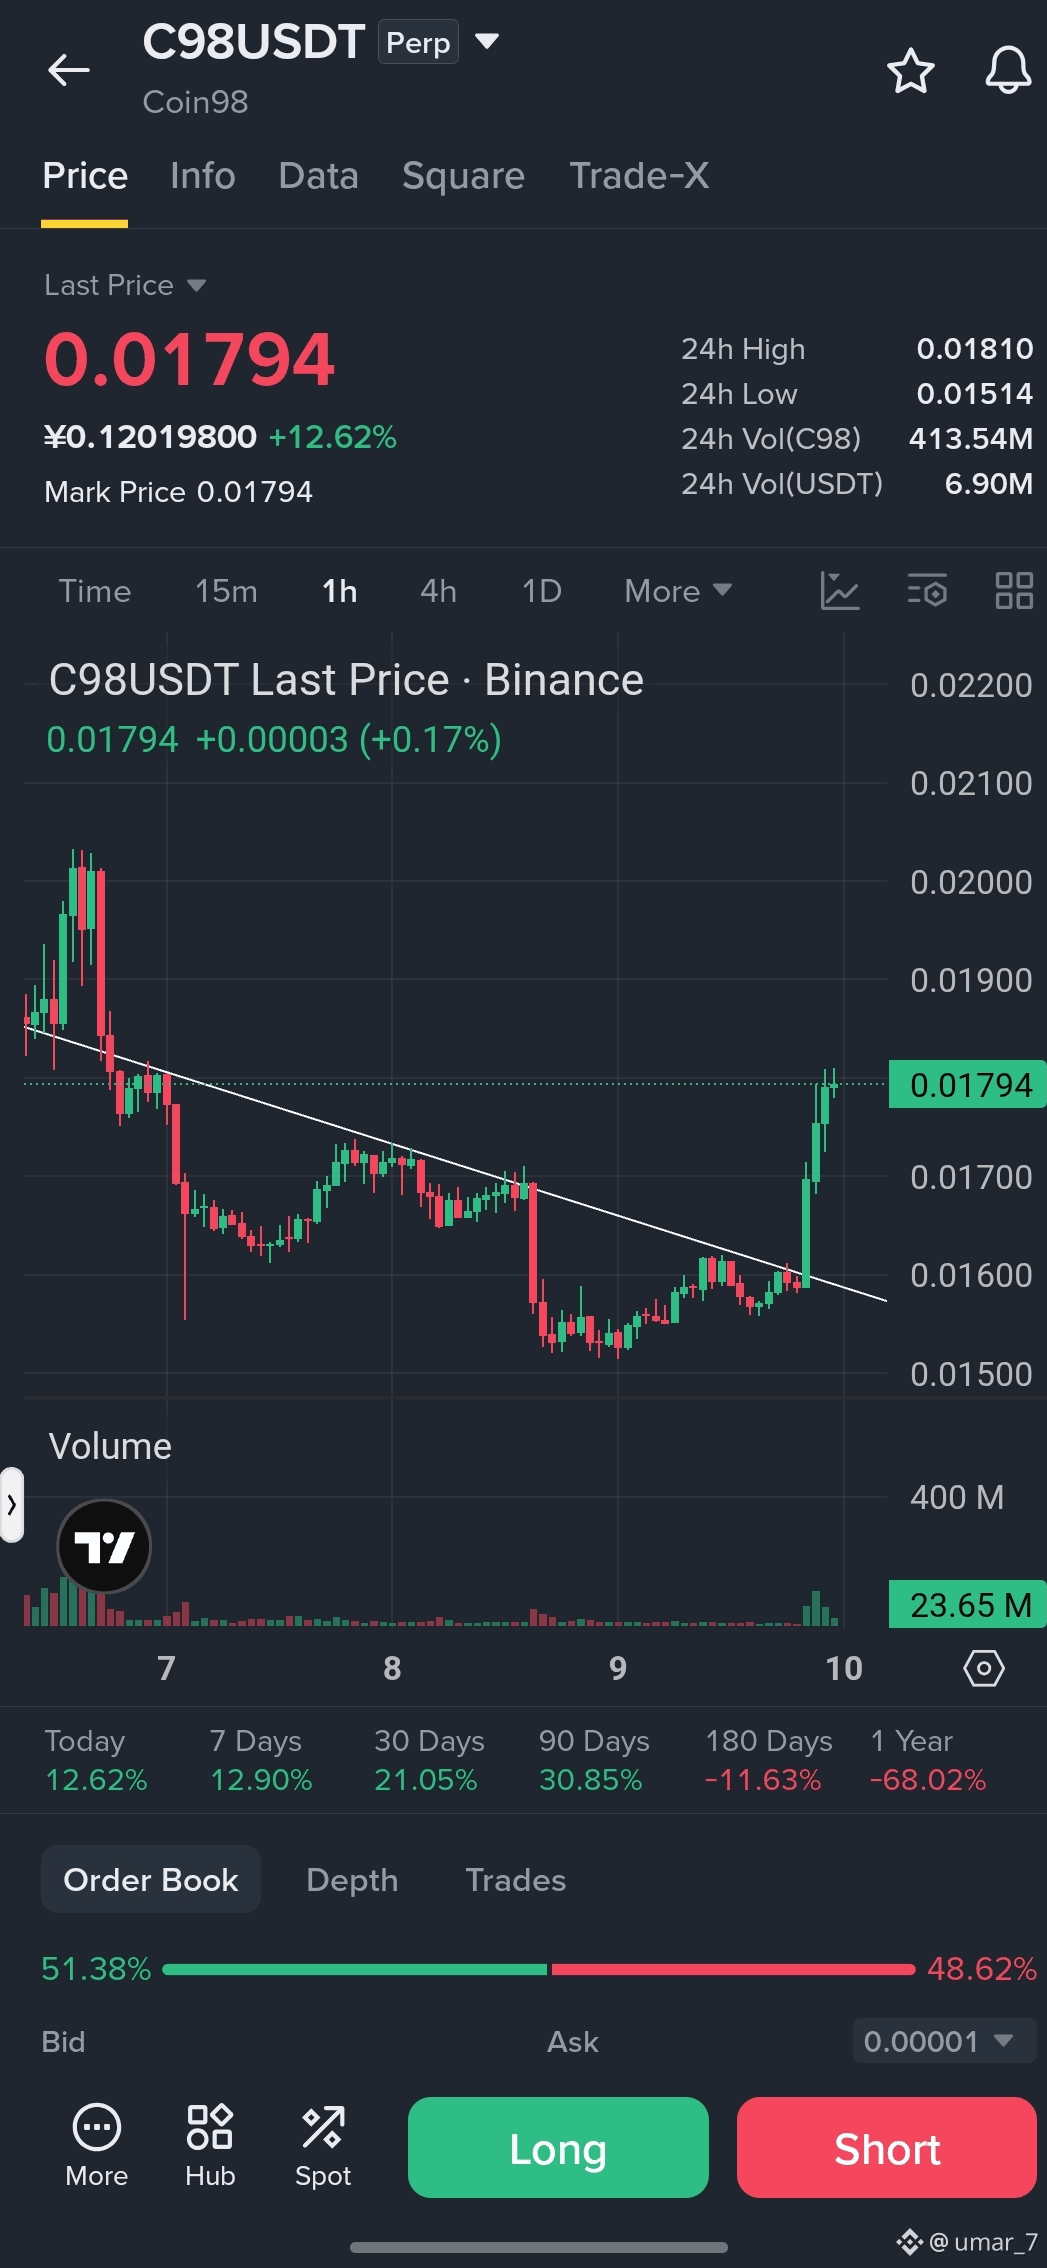
🚀 $C98 Breakout Alert: Clean 1H Diagonal Resistance Broken!
Coin98 ($C98) is showing strong bullish continuation on the 1-hour timeframe, gaining +12.62% on the day and punching cleanly above its descending trendline. With buyer volume stepping in (23.65M 24h volume) and price hovering near $0.01794, bulls are setting sights on the 24h high around $0.01810.
Current Price: ~$0.01794
Breakout Level / Support: ~$0.01600 - $0.01650
24h High: ~$0.01810
Sentiment: Bullish 📈
$C98
Are you riding this C98 breakout or waiting for a quick retest? Hit Follow so you don't miss our daily technical breakdowns! 👇
#C98/USDT #cryptosquare #TechnicalAnalys
{future}(C98USDT)
🚀 $C98 Breakout Alert: Clean 1H Diagonal Resistance Broken!
Coin98 ($C98 ) is showing strong bullish continuation on the 1-hour timeframe, gaining +12.62% on the day and punching cleanly above its descending trendline. With buyer volume stepping in (23.65M 24h volume) and price hovering near $0.01794, bulls are setting sights on the 24h high around $0.01810.
Current Price: ~$0.01794
Breakout Level / Support: ~$0.01600 - $0.01650
24h High: ~$0.01810
Sentiment: Bullish 📈
$C98
Are you riding this C98 breakout or waiting for a quick retest? Hit Follow so you don't miss our daily technical breakdowns! 👇
#C98/USDT #cryptosquare #TechnicalAnalys
1
359
·
--
බෙයාරිෂ්
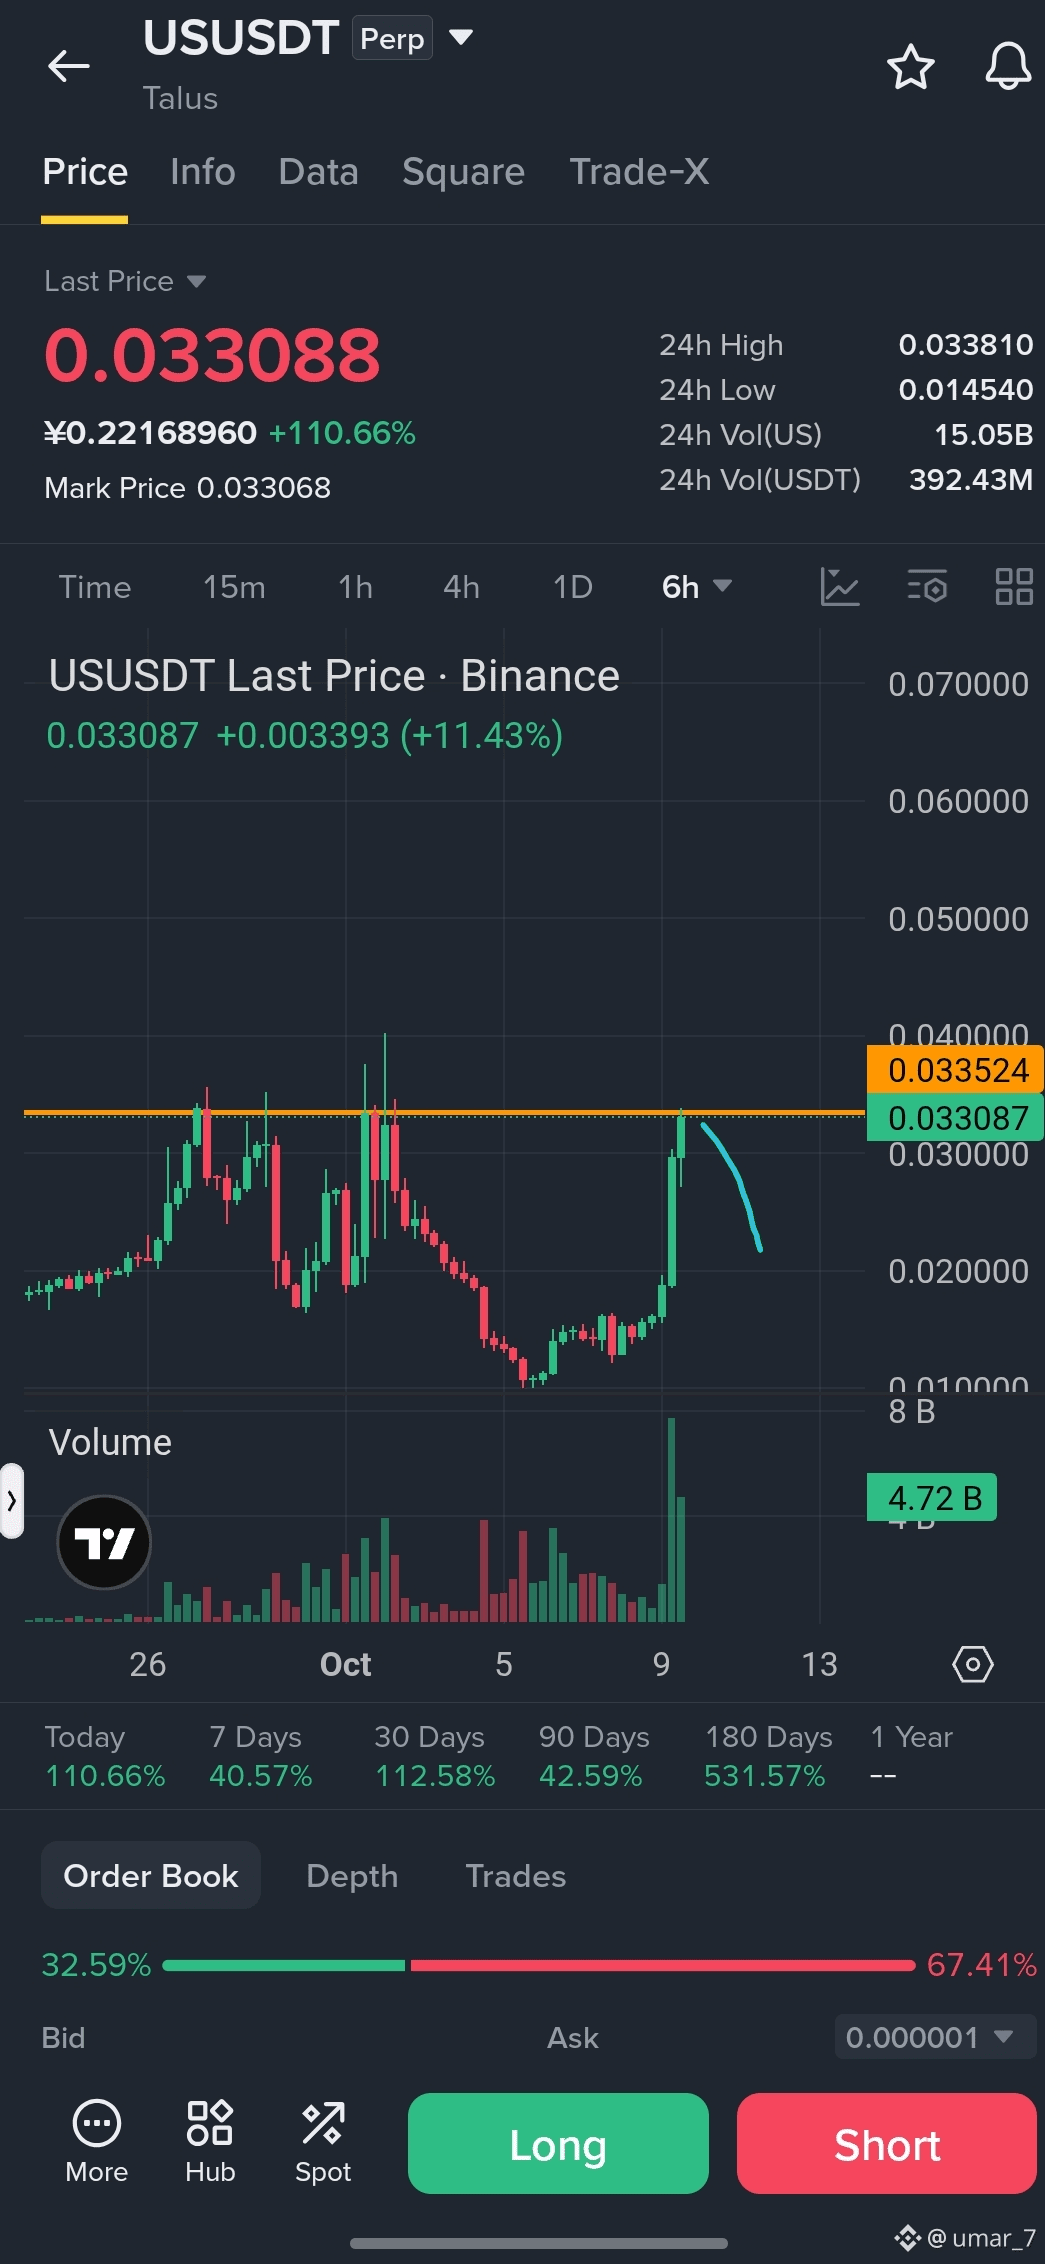
🚀 $US Explosive 6H Move: Massive +110% Surge & Volume Spike!
Talus ($US) is putting on an absolute clinic on the 6-hour timeframe, surging +110.66% on the day with massive liquidity flowing in ($392M+ 24h volume). Price is testing the key horizontal resistance zone around $0.0330, and the momentum curve is showing aggressive expansion. Bulls are driving the action here, but watch for a potential retest of lower support if momentum cools down.
Current Price: ~$0.033088
24h High Reached: ~$0.033810
Sentiment: Bullish 📈
Are you riding this $US breakout or waiting for a pullback? Hit Follow so you don't miss our daily chart breakdowns and setup updates! 👇
$US
#ususdt #TechnicalAnalys #cryptosquare
2
383

·
--
Bitcoin ($BTC) is currently trading around $85,700 after retesting resistance near $86,500.
🔑 Key Levels:
Support Zone: $84,800 – $83,300
Resistance Zone: $86,500 – $87,200
💡 Trading Scenario:
Holding above $85,000 keeps the bullish structure alive, opening room for a move towards $88,000+.
A drop below $83,300 could lead to a quick retest of lower support at $82,000.
Trade safe and keep strict stop-losses! 🛡️️
#Bitcoin #BTC #BinanceSquare #CryptoTrading #TechnicalAnalys
121

·
--
උසබ තත්ත්වය
🚀 $WLD — BULLISH BREAKOUT Setup
{future}(WLDUSDT)
$WLD is holding an important support zone around $0.54–$0.56 while approaching the key resistance area at $0.58–$0.60.
🟢 Bullish Scenario
If buyers defend $0.54–$0.56 and WLD breaks and holds above $0.59–$0.60, the next upside targets could be:
🎯 TP1: $0.65
🎯 TP2: $0.70+
📌 Key Support: $0.54–$0.56
🔥 Breakout Zone: $0.59–$0.60
✅ Confirmation: Strong 4H close above resistance.
A confirmed breakout could bring fresh bullish momentum toward the next resistance levels. 🚀
⚠️ Wait for confirmation and manage risk
#WLDUSDT #TechnicalAnalys
🚀 $WLD — BULLISH BREAKOUT Setup
$WLD is holding an important support zone around $0.54–$0.56 while approaching the key resistance area at $0.58–$0.60.
🟢 Bullish Scenario
If buyers defend $0.54–$0.56 and WLD breaks and holds above $0.59–$0.60, the next upside targets could be:
🎯 TP1: $0.65
🎯 TP2: $0.70+
📌 Key Support: $0.54–$0.56
🔥 Breakout Zone: $0.59–$0.60
✅ Confirmation: Strong 4H close above resistance.
A confirmed breakout could bring fresh bullish momentum toward the next resistance levels. 🚀
⚠️ Wait for confirmation and manage risk
#WLDUSDT #TechnicalAnalys
246

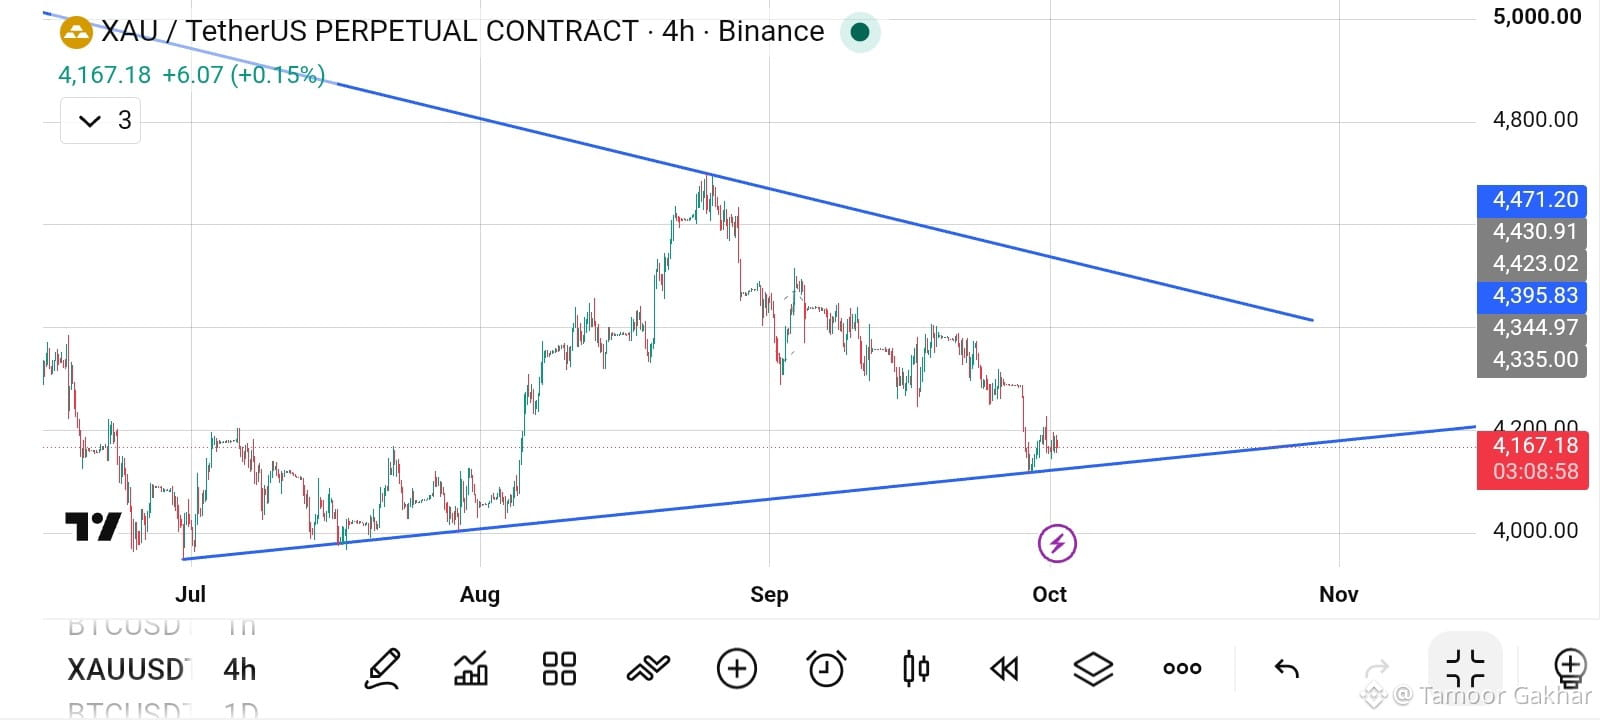
$XAU is sitting right on triangle support on the 4H. 🚨
Support: ~4,150 | Resistance: ~4,400
If the price Break TrendLine so i am Bearish Otherwise If Price Retest 4k - 4100 Level We see XAU at 44k first then 5k to 6k Final Rally.
Hold = bounce toward 4,300. Break = 4,000 in play. I'm waiting for the 4H close.
#Gold #XAU #TechnicalAnalys #TaimoorGakhar
{future}(XAUUSDT)
$XAU is sitting right on triangle support on the 4H. 🚨
Support: ~4,150 | Resistance: ~4,400
If the price Break TrendLine so i am Bearish Otherwise If Price Retest 4k - 4100 Level We see XAU at 44k first then 5k to 6k Final Rally.
Hold = bounce toward 4,300. Break = 4,000 in play. I'm waiting for the 4H close.
#Gold #XAU #TechnicalAnalys #TaimoorGakhar
Support: ~4,150 | Resistance: ~4,400
If the price Break TrendLine so i am Bearish Otherwise If Price Retest 4k - 4100 Level We see XAU at 44k first then 5k to 6k Final Rally.
Hold = bounce toward 4,300. Break = 4,000 in play. I'm waiting for the 4H close.
#Gold #XAU #TechnicalAnalys #TaimoorGakhar
176

·
--
$SOL HAS THE FLOWS NOW PRICE NEEDS TO CONFIRM
The interesting part of Solana right now isn’t just the chart.
U.S. spot Solana ETFs just posted their strongest weekly inflow since launch, pulling in about 188M USD across the five sessions through September 25. All seven funds recorded net inflows.
But price action is telling a more cautious story.
At the latest Binance market update, SOL is around 118.33 USD, with a 24h range of 116.53–121.49.
So institutional demand is strong but the market still needs to prove that demand can translate into sustained spot strength.
📊 THE LEVELS I’M WATCHING
116.5–117.0 → Near-term support
120.2–121.5 → Immediate resistance zone
Above 121.5 → Breakout needs confirmation
Below 116.5 → Short-term structure weakens
This is the key distinction:
ETF inflows show capital is entering the investment products.
They do NOT automatically guarantee that SOL price will continue higher.
For me, the next signal is simple:
Does price reclaim the upper end of the current range while liquidity stays supportive?
That reaction matters more than the headline.
What are you watching first ETF flows or the SOL chart?
#sol #Crypto #altcoins #TechnicalAnalys is #CryptoMarket

72

·
--
🔥 $SOL Eyes Recovery Above $116!Solana is showing great intraday strength, currently trading at $116.22 (+1.4%). The $113 support zone has been strongly defended by buyers.📈 The Plan: If we get a clean hourly close above $116.40, momentum can easily push $SOL toward $120+ in the short term. Volume looks ready!Attach the SOL/USDT Trading Widget below! 👇#solana #SOLUSD #CryptoTrading. #TechnicalAnalys
🔥 $SOL Eyes Recovery Above $116!Solana is showing great intraday strength, currently trading at $116.22 (+1.4%). The $113 support zone has been strongly defended by buyers.📈 The Plan: If we get a clean hourly close above $116.40, momentum can easily push $SOL toward $120+ in the short term. Volume looks ready!Attach the SOL/USDT Trading Widget below! 👇#solana #SOLUSD #CryptoTrading. #TechnicalAnalys
91

·
--
බෙයාරිෂ්
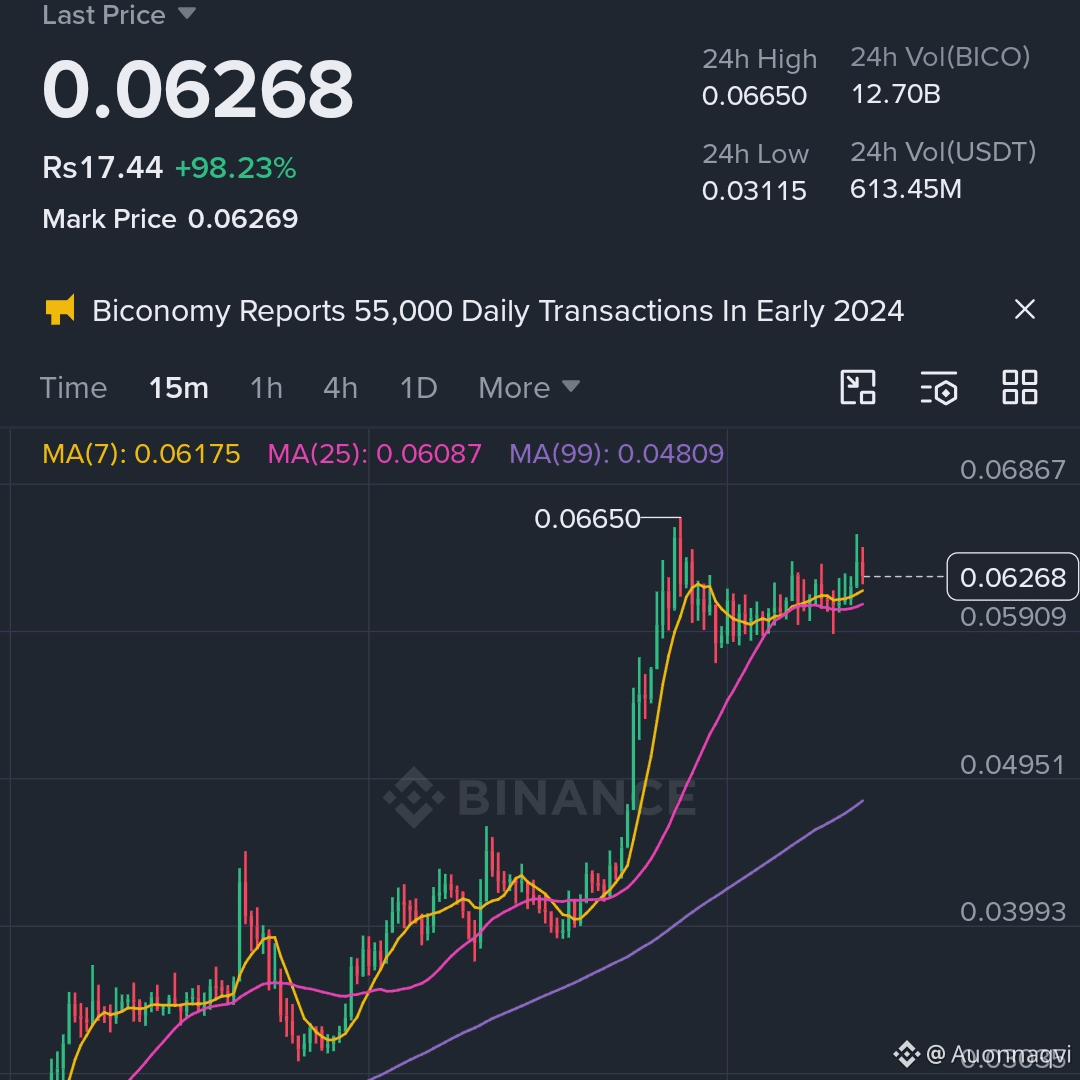
📉 SIGNAL: #BICOUSDT Perp — SHORT Entry 🔴
BICO has surged over +80% on the 1-hour chart, but order flow shows a heavy divergence. Retail is heavily longing, while large Whales have built a massive $1.89M Short position. Expect a fast, volatile push upward to clear liquidity before a sharp market correction.
Do not chase market entries; use laddered limit orders to safely catch the squeeze.
Direction: SHORT 📉
Leverage: Cross (Keep it low: 3x - 5x recommended due to high volatility)
🎯 Entry Strategy (Laddered Limits)
Entry 1 (35%): $0.06380 - 0.06450
Entry 2 (65%): $0.06620 - 0.06690 (Hunting the 24h High liquidity)
💰 Take Profit (TP)
TP 1: 0.05450 (Front-running whale support)
TP 2: 0.04850 (Dynamic 1H MA-25 support)
🛡️ Risk Management
Stop Loss (SL): 0.06850
{future}(BICOUSDT)
Disclaimer: Parabolic setups are highly volatile. Manage your margin size carefully and always trade with capital you can afford to risk.
#BICO #TechnicalAnalys #cryptosignals
📉 SIGNAL: #BICOUSDT Perp — SHORT Entry 🔴
BICO has surged over +80% on the 1-hour chart, but order flow shows a heavy divergence. Retail is heavily longing, while large Whales have built a massive $1.89M Short position. Expect a fast, volatile push upward to clear liquidity before a sharp market correction.
Do not chase market entries; use laddered limit orders to safely catch the squeeze.
Direction: SHORT 📉
Leverage: Cross (Keep it low: 3x - 5x recommended due to high volatility)
🎯 Entry Strategy (Laddered Limits)
Entry 1 (35%): $0.06380 - 0.06450
Entry 2 (65%): $0.06620 - 0.06690 (Hunting the 24h High liquidity)
💰 Take Profit (TP)
TP 1: 0.05450 (Front-running whale support)
TP 2: 0.04850 (Dynamic 1H MA-25 support)
🛡️ Risk Management
Stop Loss (SL): 0.06850
Disclaimer: Parabolic setups are highly volatile. Manage your margin size carefully and always trade with capital you can afford to risk.
#BICO #TechnicalAnalys #cryptosignals
178

·
--
$BTC
$BSB
{future}(BSBUSDT)
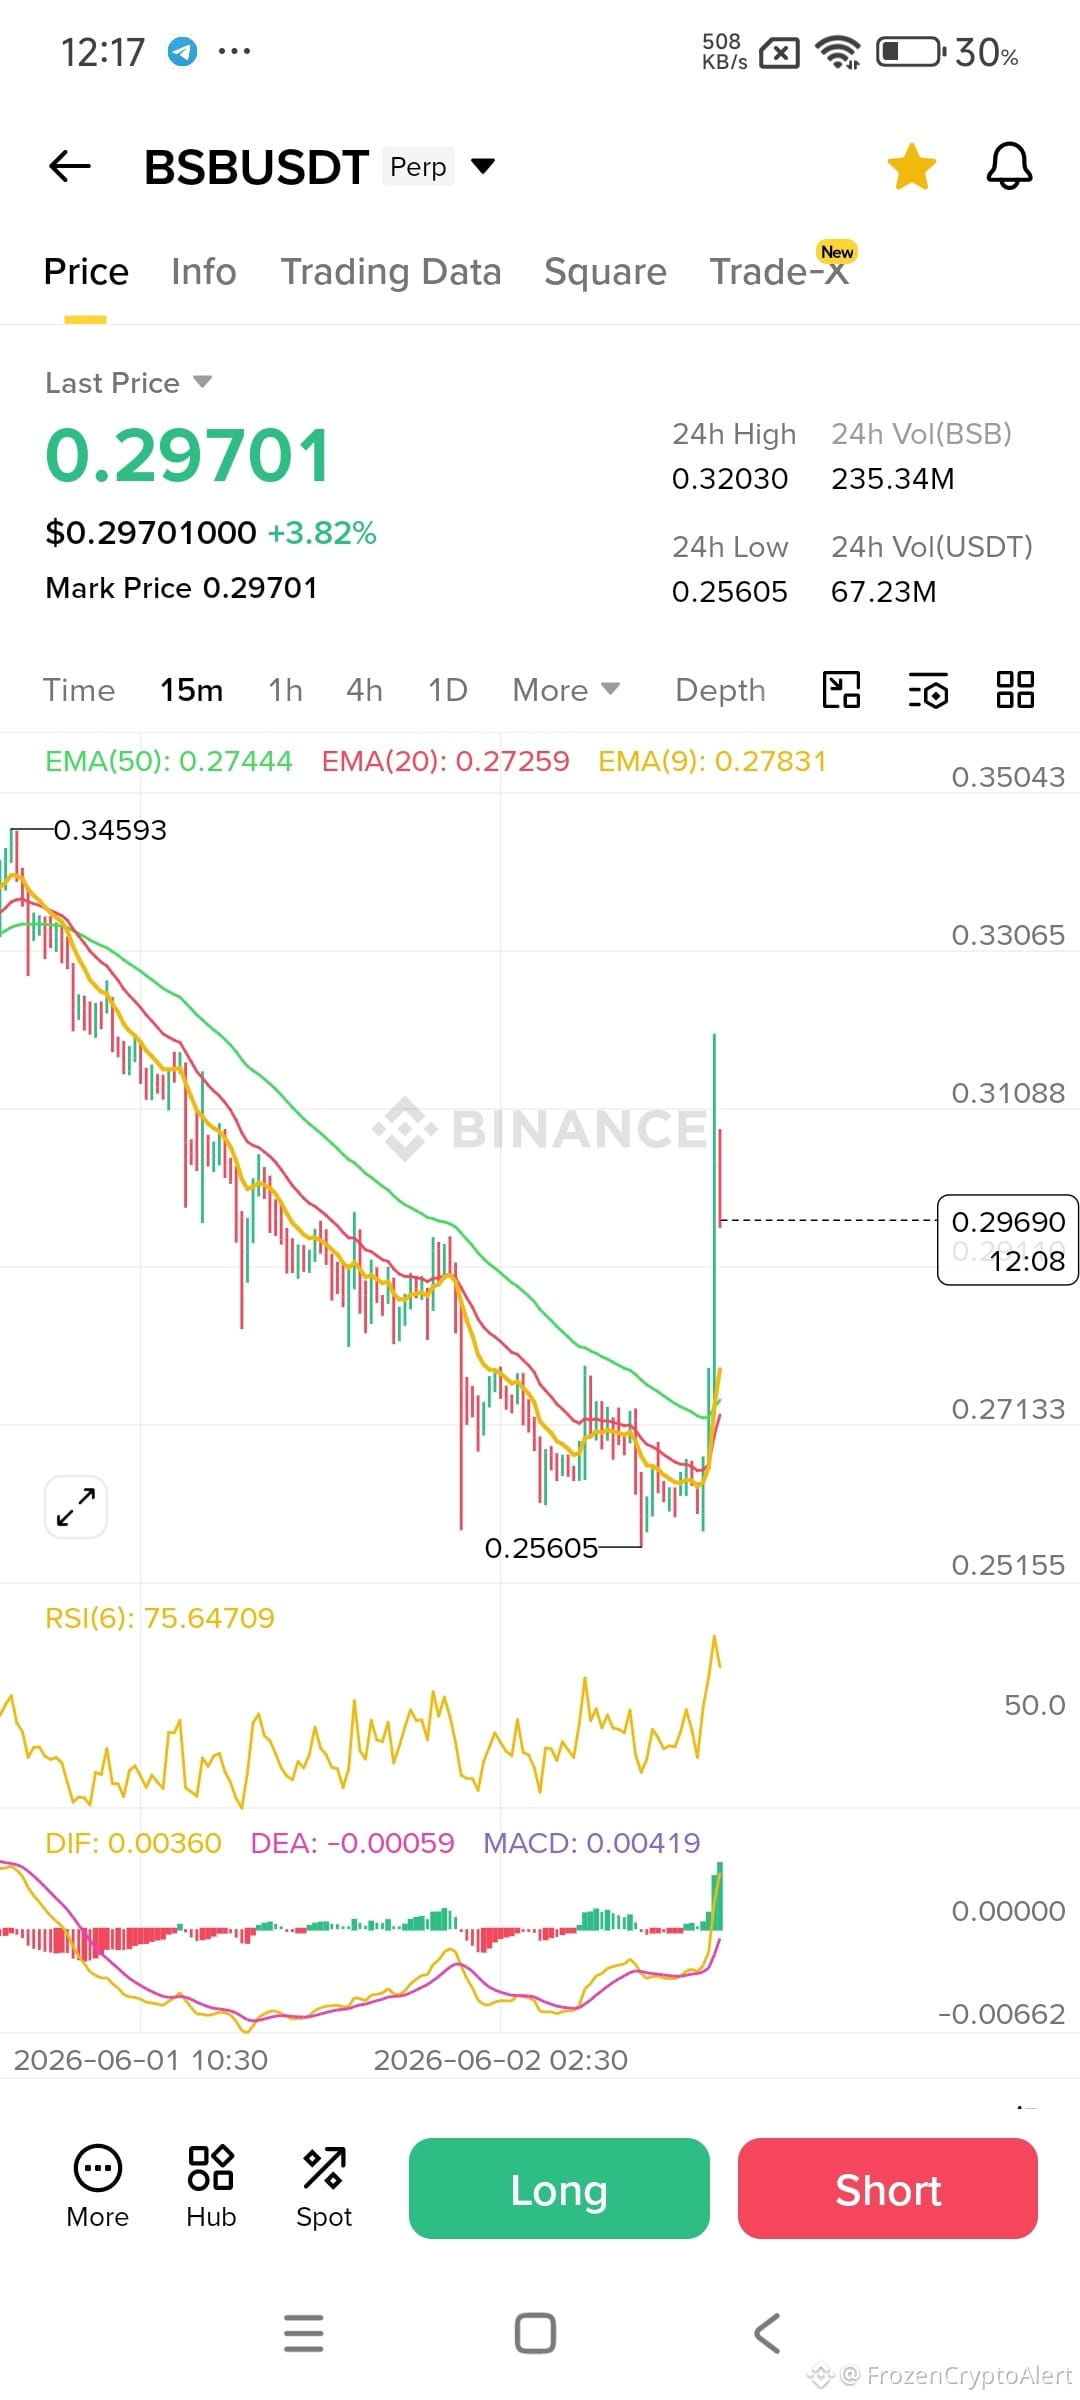
Watching BSBUSDT closely today! 📈 The chart is showing some interesting movement. Keeping an eye on the order book to see if the bulls can break through the next resistance level. Let's see if we can catch the trend!
#BSBUSDT #CryptoTradingTip #TechnicalAnalys
$BTC
$BSB
Watching BSBUSDT closely today! 📈 The chart is showing some interesting movement. Keeping an eye on the order book to see if the bulls can break through the next resistance level. Let's see if we can catch the trend!
#BSBUSDT #CryptoTradingTip #TechnicalAnalys
$BSB
Watching BSBUSDT closely today! 📈 The chart is showing some interesting movement. Keeping an eye on the order book to see if the bulls can break through the next resistance level. Let's see if we can catch the trend!
#BSBUSDT #CryptoTradingTip #TechnicalAnalys

50000shiba
FrozenCryptoAlert වෙතින්
250

·
--
බෙයාරිෂ්
$ETH 🆕 "Looks like the BEARS are cooking up another brutal plan... Keep your eyes locked to the charts! 😈🔥🐻" (09-06-2026)
SHORT ETH only below 1620
(Based on 1H candlestick chart. If 1H candle closes below 1620, it will get activated)
SL 💔- 1675 (closing basis)
Target 🎯 1552--1506--1468
Ultimate Target 🥏 1313
#PaperTrading
#TechnicalAnalys
#CryptoTrading
#CryptoAnalysis
NOTE---
***For educational purpose only. Do paper trade only.***
🔥Disclaimer 👉 This is my personal analysis for educational purposes , Buy/Sell/Trade at your own risk. I am not a Financial Advisor.
125
තවත් අන්තර්ගතයන් ගවේෂණය කිරීමට ඇතුල් වන්න
Binance චතුරශ්රය හි ගෝලීය ක්රිප්ටෝ පරිශීලකයින් හා එක්වන්න
⚡️ ක්රිප්ටෝ පිළිබඳ නවතම සහ ප්රයෝජනවත් තොරතුරු ලබා ගන්න.
💬 ලොව විශාලතම ක්රිප්ටෝ හුවමාරුව මගින් විශ්වාස කෙරේ.
👍 සත්යායනය කරන ලද නිර්මාණකරුවන්ගෙන් සැබෑ විදසුන් සොයා ගන්න.
විද්යුත් තැපෑල / දුරකථන අංකය
නැගී එන මාතෘකා
1
#BinancePick
3M නැරඹීම්
151,594 සාකච්ඡා කරමින්
2
#EarningsSeason
5.2M නැරඹීම්
25,777 සාකච්ඡා කරමින්
3
#AnthropicTTMRevenueGrewAbout1200%
18,112 නැරඹීම්
331 සාකච්ඡා කරමින්
4
#AnthropicS1ExpectedToday
19,885 නැරඹීම්
295 සාකච්ඡා කරමින්
5
#SouthKoreaReportedlyWeighsFourthCryptoTaxDelay
24,883 නැරඹීම්
416 සාකච්ඡා කරමින්
6
#FranklinTempletonFilesForTwoDividendToBitcoinETFs
32,679 නැරඹීම්
511 සාකච්ඡා කරමින්
7
#StrategyMSTRSurpassesNasdaqInMarketCap
25,186 නැරඹීම්
371 සාකච්ඡා කරමින්
8
#CanadaProposesStablecoinRedemptionWithin3BusinessDays
1,166 නැරඹීම්
34 සාකච්ඡා කරමින්
9
#ElectrumWalletBugLetRogueServersStealFunds
27,067 නැරඹීම්
448 සාකච්ඡා කරමින්
10
#ArgentineCourtDismissesLIBRACaseAgainstMilei
41,218 නැරඹීම්
553 සාකච්ඡා කරමින්