
#synusdc
synusdc
823 views
14 සාකච්ඡා කරමින්
උණුසුම්
නවතම

·
--
පරිවර්තනය බලන්න
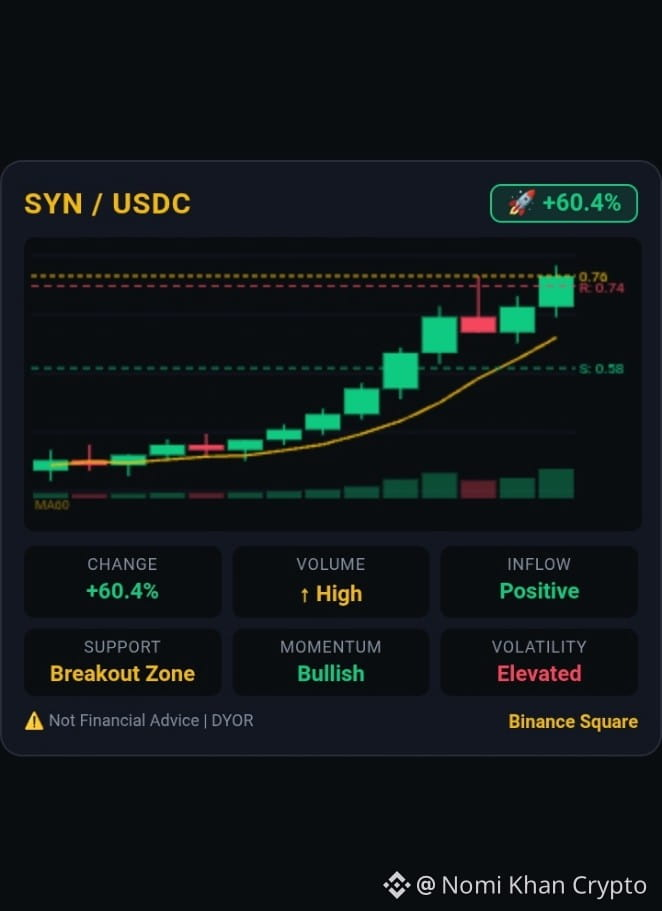
SYN/USDC — +60.4% SURGE!
💥 Strong momentum, volume expanding & capital flowing in fast!
📊 What's happening:
📈 Price: +60.4% 🔥
📦 Volume: Accelerating
💰 Capital Inflow: Positive
🎯 Watch for continuation above recent highs — pullbacks may form new support near breakout zone.
$SYN
{spot}(SYNUSDT)
⚡ Bullish momentum is strong, but volatility is elevated — manage your risk!
#SYN #SYNUSDC #SpaceXPremarketFalls4.6% #IranCutsCrudePrices
SYN/USDC — +60.4% SURGE!
💥 Strong momentum, volume expanding & capital flowing in fast!
📊 What's happening:
📈 Price: +60.4% 🔥
📦 Volume: Accelerating
💰 Capital Inflow: Positive
🎯 Watch for continuation above recent highs — pullbacks may form new support near breakout zone.
$SYN
⚡ Bullish momentum is strong, but volatility is elevated — manage your risk!
#SYN #SYNUSDC #SpaceXPremarketFalls4.6% #IranCutsCrudePrices
💥 Strong momentum, volume expanding & capital flowing in fast!
📊 What's happening:
📈 Price: +60.4% 🔥
📦 Volume: Accelerating
💰 Capital Inflow: Positive
🎯 Watch for continuation above recent highs — pullbacks may form new support near breakout zone.
$SYN
⚡ Bullish momentum is strong, but volatility is elevated — manage your risk!
#SYN #SYNUSDC #SpaceXPremarketFalls4.6% #IranCutsCrudePrices
84

·
--
උසබ තත්ත්වය
$SYN
{future}(SYNUSDT)
#SYNUSDC 2026 ဇူလိုင်လ 18 ရက်နေ့အဖြစ် Synapse (SYN) ၏ စျေးနှုန်းသည် ခန့်မှန်းအားဖြင့် $0.18 ဖြစ်ပြီး ပြီးခဲ့သော 24 နာရီအတွင်း 20% ကျော် ကျဆင်းမှုကို ကိုယ်စားပြုပါသည်။
SYN အတွက် လက်ရှိ စျေးကွက်တန်ဖိုး (market capitalization) သည် ခန့်မှန်းအားဖြင့် $41.3 million USD ဖြစ်ပြီး 24 နာရီ အရောင်းအဝယ်ပမာဏ (trading volume) မှာ ခန့်မှန်းအားဖြင့် $23.9 million USD ဖြစ်သည်။
Synapse သည် ကွဲပြားသည့် blockchain ကွန်ယက်များအကြား ဆက်သွယ်ရေးနှင့် ပိုင်ဆိုင်မှု လွှဲပြောင်းမှုများကို လွယ်ကူစေရန် ရည်ရွယ်ထားသည့် decentralized protocol တစ်ခုဖြစ်သည်။
Synapse (SYN/USDC) သည် consolidation အဆင့်တွင် အရောင်းအဝယ်ဖြစ်နေပြီး ၎င်း၏ ချက်ချင်း resistance မှာ $0.22 - $0.23 အနီးတွင် ဖြစ်သည်။ ဤအဆင့်များကို အရောင်းအဝယ်ပမာဏမြင့်မားစွာ ဖြတ်ကျော်နိုင်ပါက $0.26 - $0.28 အထိ သော မျိုးစေ့တိုတောင်း bullish လှုပ်ရှားမှုအတွက် တံခါးဖွင့်ပေးနိုင်သည်။ သို့သော် support သည် $0.19 ကြမ်းခင်း (floor) ကို အလွန်မှီခိုနေသည်။
လက်ရှိ နည်းပညာဆိုင်ရာ အဆင့်များ
လက်ရှိစျေးနှုန်း: ~ $0.19 - $0.225
ချက်ချင်း Resistance
(ပစ်မှတ်များ): $0.23 နောက် $0.26
အဓိက Support: $0.
1-နှစ် ၂-Week Range: $0.03 - $0.71
စျေးကွက်အခြေအနေSYN/USDC သည် မကြာသေးမီက mixed technical momentum ကို တွေ့ခဲ့ရပြီး 7-နေ့တာ volatility မြင့်မားမှုဖြင့် လက္ခဏာသတ်မှတ်ထားသည်။ Traders များသည် moving averages နှင့် ကျဆင်းသည့် wedge ပုံစံများကို နီးကပ်စွာ စောင့်ကြည့်နေကြပြီး၊ အကယ်၍ ပြောင်းပြန်လှည့်မှု (reversal) ကို အချက်ပြနိုင်ပါက အဆိုပါ token သည် သမိုင်းကြောင်းအရ အချိန်တို ပစ်မှတ်များကို ပိုမိုမြင့်တက်ရန် ရည်ရွယ်တတ်ကြောင်း သတိပြုထားသည်။
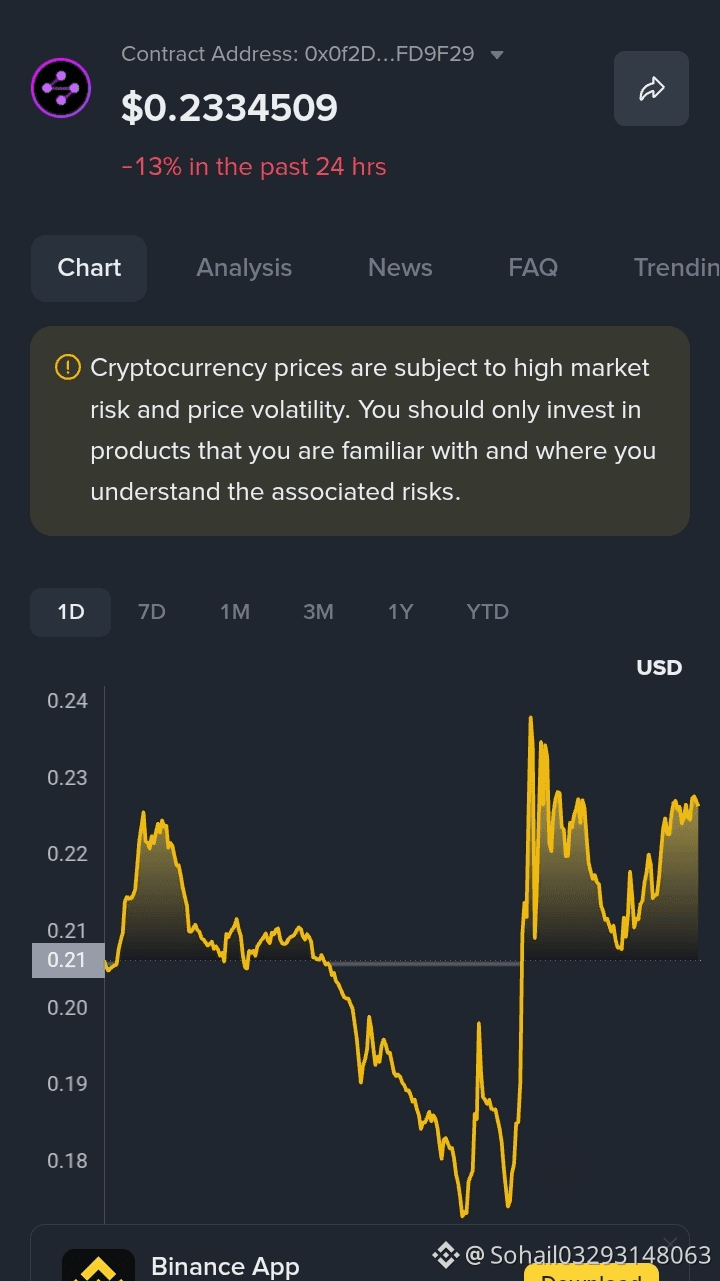
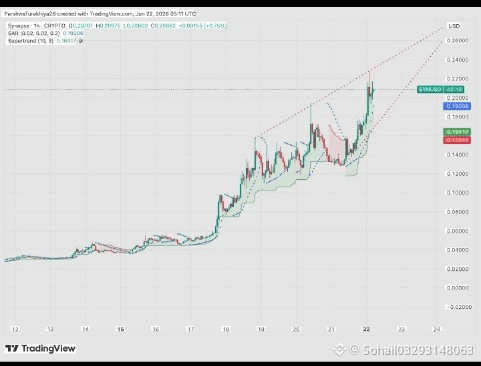
👇 ပုံသည် Synapse (SYN/USD) အတွက် 1-hour hourly chart ကို ပြသထားသည်။ 2026 ခုနှစ် ဇွန် 18 ဝန်းကျင်မှစတင်ကာ bullish လမ်းကြောင်းတစ်ခု စတင်သည်ကို ပြသထားပြီး ၎င်းမှာ parabolic structure နှင့် ascending channel အတွင်း အဆင့်လိုက် မြင့်တက်သည့် stair-stepping ပုံစံဖြင့် လက္ခဏာသတ်မှတ်ထားသည်။
အဓိက technical indicators များမှာ bullish ဖြစ်သည်—SAR သည် $0.1910 တွင်ရှိပြီး Supertrend မှာ $0.1642 ဖြစ်ကာ နှစ်ခုလုံးမှာ လက်ရှိစျေးနှုန်းအောက်တွင် တည်ရှိနေသည်။
ဇယားအရ မကြာသေးမီ resistance အဆင့်များသည် $0.22 မှ $0.2278 အနီးတွင်ရှိပြီး support အဆင့်များမှာ $0.1727 နှင့် $0.1552 အနီးတွင်ရှိသည်။
#NikkeiFalls5%WorstSinceMarch
#IraqSyriaSignPipelineDealBypassingHormuz
#SpaceXClosesBelowIPOPrice
#MoonshotKimiK3SparksChipSelloff
$SYN
#SYNUSDC 2026 ဇူလိုင်လ 18 ရက်နေ့အဖြစ် Synapse (SYN) ၏ စျေးနှုန်းသည် ခန့်မှန်းအားဖြင့် $0.18 ဖြစ်ပြီး ပြီးခဲ့သော 24 နာရီအတွင်း 20% ကျော် ကျဆင်းမှုကို ကိုယ်စားပြုပါသည်။
SYN အတွက် လက်ရှိ စျေးကွက်တန်ဖိုး (market capitalization) သည် ခန့်မှန်းအားဖြင့် $41.3 million USD ဖြစ်ပြီး 24 နာရီ အရောင်းအဝယ်ပမာဏ (trading volume) မှာ ခန့်မှန်းအားဖြင့် $23.9 million USD ဖြစ်သည်။
Synapse သည် ကွဲပြားသည့် blockchain ကွန်ယက်များအကြား ဆက်သွယ်ရေးနှင့် ပိုင်ဆိုင်မှု လွှဲပြောင်းမှုများကို လွယ်ကူစေရန် ရည်ရွယ်ထားသည့် decentralized protocol တစ်ခုဖြစ်သည်။
Synapse (SYN/USDC) သည် consolidation အဆင့်တွင် အရောင်းအဝယ်ဖြစ်နေပြီး ၎င်း၏ ချက်ချင်း resistance မှာ $0.22 - $0.23 အနီးတွင် ဖြစ်သည်။ ဤအဆင့်များကို အရောင်းအဝယ်ပမာဏမြင့်မားစွာ ဖြတ်ကျော်နိုင်ပါက $0.26 - $0.28 အထိ သော မျိုးစေ့တိုတောင်း bullish လှုပ်ရှားမှုအတွက် တံခါးဖွင့်ပေးနိုင်သည်။ သို့သော် support သည် $0.19 ကြမ်းခင်း (floor) ကို အလွန်မှီခိုနေသည်။
လက်ရှိ နည်းပညာဆိုင်ရာ အဆင့်များ
လက်ရှိစျေးနှုန်း: ~ $0.19 - $0.225
ချက်ချင်း Resistance
(ပစ်မှတ်များ): $0.23 နောက် $0.26
အဓိက Support: $0.
1-နှစ် ၂-Week Range: $0.03 - $0.71
စျေးကွက်အခြေအနေSYN/USDC သည် မကြာသေးမီက mixed technical momentum ကို တွေ့ခဲ့ရပြီး 7-နေ့တာ volatility မြင့်မားမှုဖြင့် လက္ခဏာသတ်မှတ်ထားသည်။ Traders များသည် moving averages နှင့် ကျဆင်းသည့် wedge ပုံစံများကို နီးကပ်စွာ စောင့်ကြည့်နေကြပြီး၊ အကယ်၍ ပြောင်းပြန်လှည့်မှု (reversal) ကို အချက်ပြနိုင်ပါက အဆိုပါ token သည် သမိုင်းကြောင်းအရ အချိန်တို ပစ်မှတ်များကို ပိုမိုမြင့်တက်ရန် ရည်ရွယ်တတ်ကြောင်း သတိပြုထားသည်။
👇 ပုံသည် Synapse (SYN/USD) အတွက် 1-hour hourly chart ကို ပြသထားသည်။ 2026 ခုနှစ် ဇွန် 18 ဝန်းကျင်မှစတင်ကာ bullish လမ်းကြောင်းတစ်ခု စတင်သည်ကို ပြသထားပြီး ၎င်းမှာ parabolic structure နှင့် ascending channel အတွင်း အဆင့်လိုက် မြင့်တက်သည့် stair-stepping ပုံစံဖြင့် လက္ခဏာသတ်မှတ်ထားသည်။
အဓိက technical indicators များမှာ bullish ဖြစ်သည်—SAR သည် $0.1910 တွင်ရှိပြီး Supertrend မှာ $0.1642 ဖြစ်ကာ နှစ်ခုလုံးမှာ လက်ရှိစျေးနှုန်းအောက်တွင် တည်ရှိနေသည်။
ဇယားအရ မကြာသေးမီ resistance အဆင့်များသည် $0.22 မှ $0.2278 အနီးတွင်ရှိပြီး support အဆင့်များမှာ $0.1727 နှင့် $0.1552 အနီးတွင်ရှိသည်။
#NikkeiFalls5%WorstSinceMarch
#IraqSyriaSignPipelineDealBypassingHormuz
#SpaceXClosesBelowIPOPrice
#MoonshotKimiK3SparksChipSelloff
#SYNUSDC 2026 ဇူလိုင်လ 18 ရက်နေ့အဖြစ် Synapse (SYN) ၏ စျေးနှုန်းသည် ခန့်မှန်းအားဖြင့် $0.18 ဖြစ်ပြီး ပြီးခဲ့သော 24 နာရီအတွင်း 20% ကျော် ကျဆင်းမှုကို ကိုယ်စားပြုပါသည်။
SYN အတွက် လက်ရှိ စျေးကွက်တန်ဖိုး (market capitalization) သည် ခန့်မှန်းအားဖြင့် $41.3 million USD ဖြစ်ပြီး 24 နာရီ အရောင်းအဝယ်ပမာဏ (trading volume) မှာ ခန့်မှန်းအားဖြင့် $23.9 million USD ဖြစ်သည်။
Synapse သည် ကွဲပြားသည့် blockchain ကွန်ယက်များအကြား ဆက်သွယ်ရေးနှင့် ပိုင်ဆိုင်မှု လွှဲပြောင်းမှုများကို လွယ်ကူစေရန် ရည်ရွယ်ထားသည့် decentralized protocol တစ်ခုဖြစ်သည်။
Synapse (SYN/USDC) သည် consolidation အဆင့်တွင် အရောင်းအဝယ်ဖြစ်နေပြီး ၎င်း၏ ချက်ချင်း resistance မှာ $0.22 - $0.23 အနီးတွင် ဖြစ်သည်။ ဤအဆင့်များကို အရောင်းအဝယ်ပမာဏမြင့်မားစွာ ဖြတ်ကျော်နိုင်ပါက $0.26 - $0.28 အထိ သော မျိုးစေ့တိုတောင်း bullish လှုပ်ရှားမှုအတွက် တံခါးဖွင့်ပေးနိုင်သည်။ သို့သော် support သည် $0.19 ကြမ်းခင်း (floor) ကို အလွန်မှီခိုနေသည်။
လက်ရှိ နည်းပညာဆိုင်ရာ အဆင့်များ
လက်ရှိစျေးနှုန်း: ~ $0.19 - $0.225
ချက်ချင်း Resistance
(ပစ်မှတ်များ): $0.23 နောက် $0.26
အဓိက Support: $0.
1-နှစ် ၂-Week Range: $0.03 - $0.71
စျေးကွက်အခြေအနေSYN/USDC သည် မကြာသေးမီက mixed technical momentum ကို တွေ့ခဲ့ရပြီး 7-နေ့တာ volatility မြင့်မားမှုဖြင့် လက္ခဏာသတ်မှတ်ထားသည်။ Traders များသည် moving averages နှင့် ကျဆင်းသည့် wedge ပုံစံများကို နီးကပ်စွာ စောင့်ကြည့်နေကြပြီး၊ အကယ်၍ ပြောင်းပြန်လှည့်မှု (reversal) ကို အချက်ပြနိုင်ပါက အဆိုပါ token သည် သမိုင်းကြောင်းအရ အချိန်တို ပစ်မှတ်များကို ပိုမိုမြင့်တက်ရန် ရည်ရွယ်တတ်ကြောင်း သတိပြုထားသည်။
👇 ပုံသည် Synapse (SYN/USD) အတွက် 1-hour hourly chart ကို ပြသထားသည်။ 2026 ခုနှစ် ဇွန် 18 ဝန်းကျင်မှစတင်ကာ bullish လမ်းကြောင်းတစ်ခု စတင်သည်ကို ပြသထားပြီး ၎င်းမှာ parabolic structure နှင့် ascending channel အတွင်း အဆင့်လိုက် မြင့်တက်သည့် stair-stepping ပုံစံဖြင့် လက္ခဏာသတ်မှတ်ထားသည်။
အဓိက technical indicators များမှာ bullish ဖြစ်သည်—SAR သည် $0.1910 တွင်ရှိပြီး Supertrend မှာ $0.1642 ဖြစ်ကာ နှစ်ခုလုံးမှာ လက်ရှိစျေးနှုန်းအောက်တွင် တည်ရှိနေသည်။
ဇယားအရ မကြာသေးမီ resistance အဆင့်များသည် $0.22 မှ $0.2278 အနီးတွင်ရှိပြီး support အဆင့်များမှာ $0.1727 နှင့် $0.1552 အနီးတွင်ရှိသည်။
#NikkeiFalls5%WorstSinceMarch
#IraqSyriaSignPipelineDealBypassingHormuz
#SpaceXClosesBelowIPOPrice
#MoonshotKimiK3SparksChipSelloff
1
119

·
--
උසබ තත්ත්වය
පරිවර්තනය බලන්න
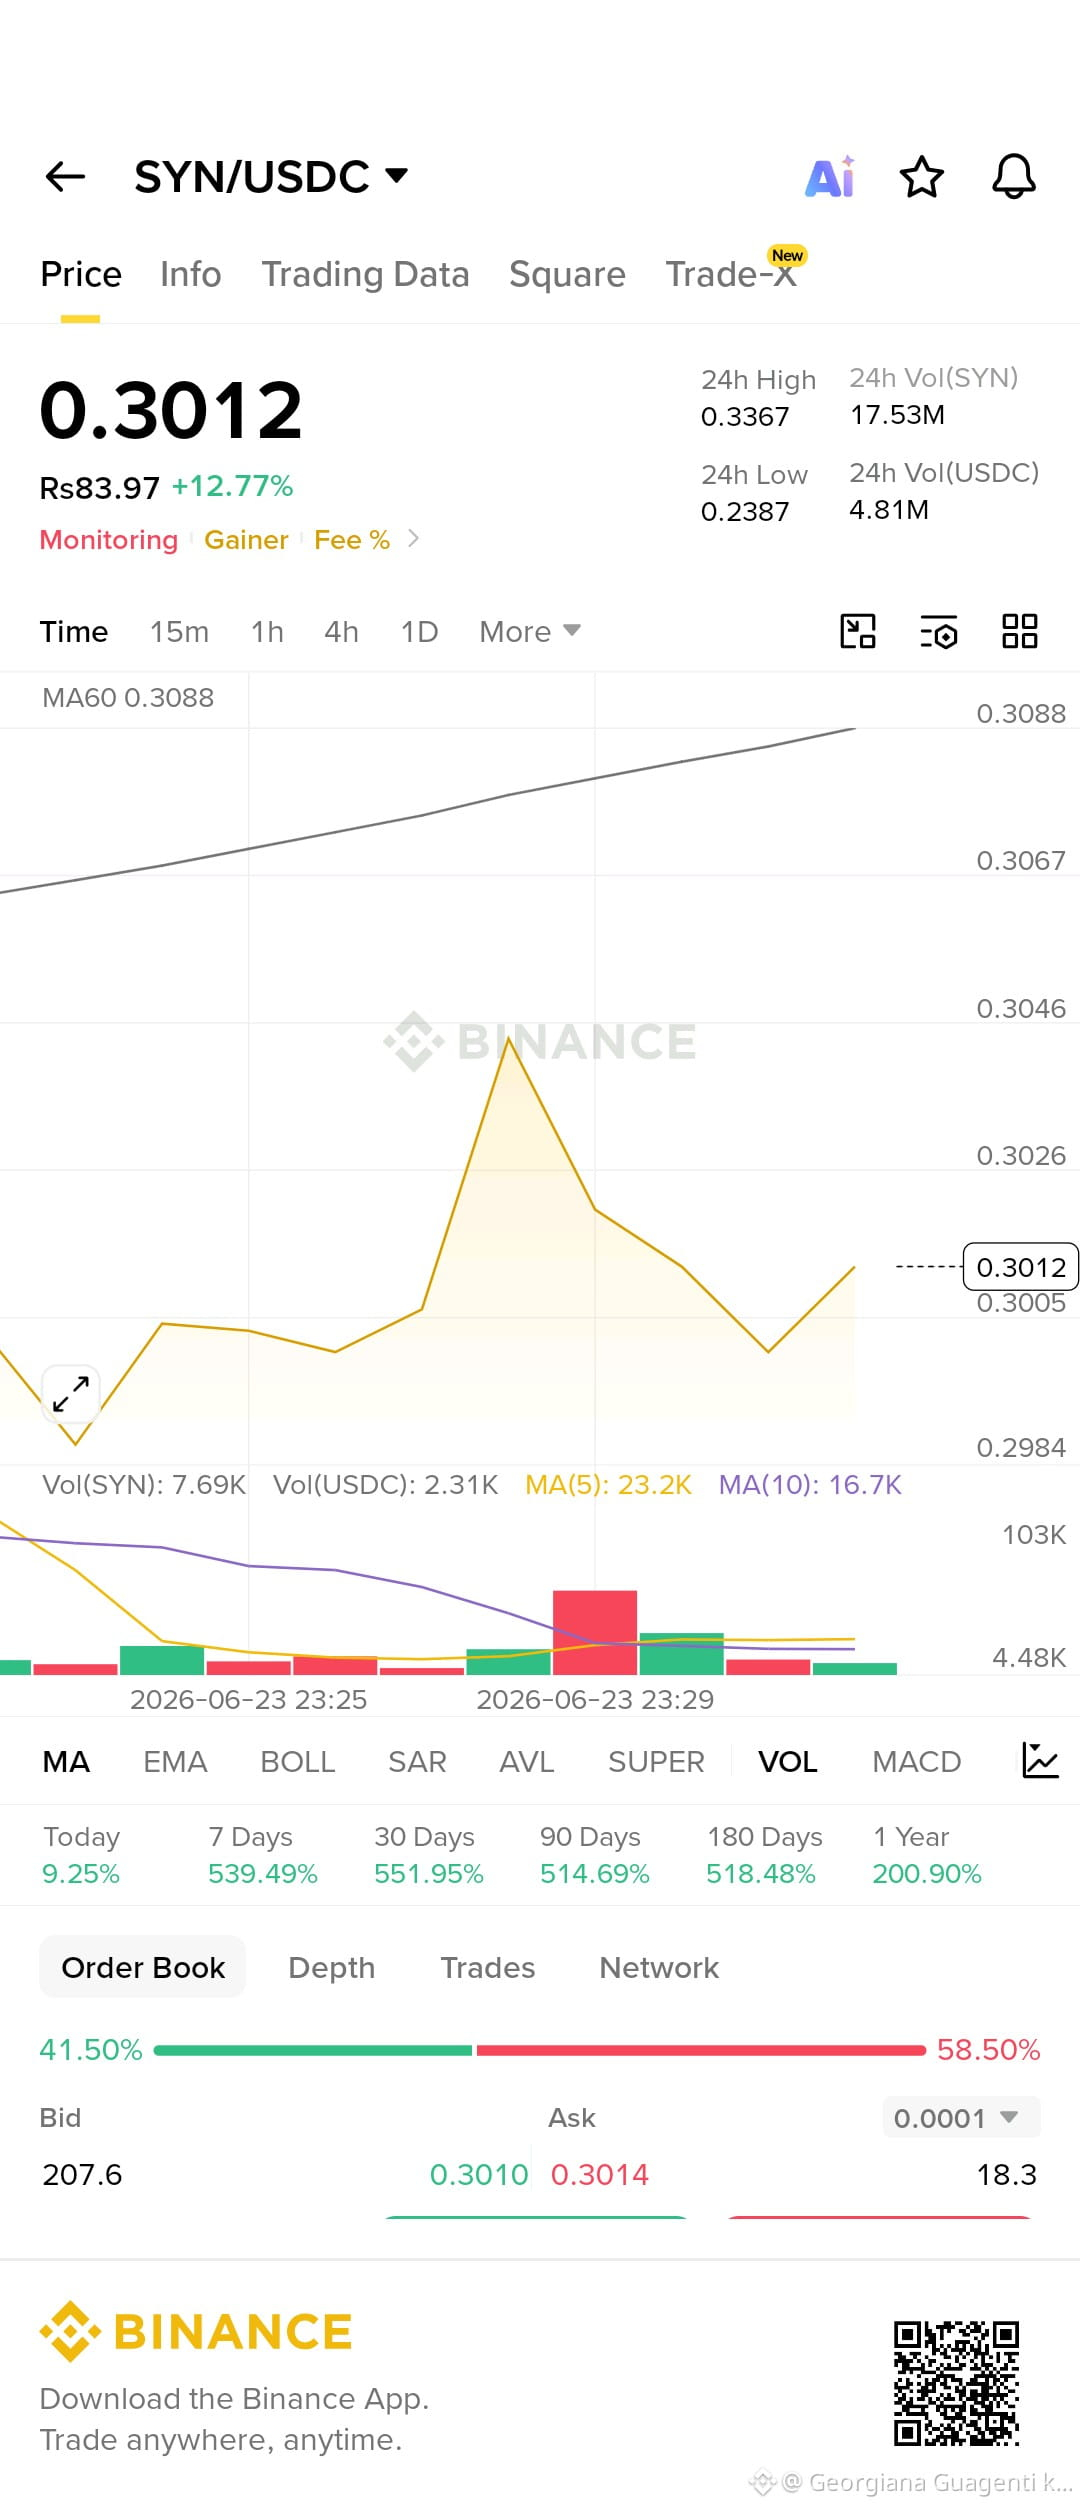
$NVDAB SYN/USDC | Market Update - 23 Jun 2026*
*Current Price*: $0.3012 (+12.77% 24h)
*24h Range*: $0.2387 - $0.3367
*24h Volume*: 4.81M USDC
*Market Trend*: Bullish / Below MA60 Retest
SYN rallied +12.77% from $0.2387 low but is stalling under MA60 at $0.3088. Price at $0.3012 is testing the 60MA from below after tapping $0.3367 high. Structure improves above $0.3000, but trend flips only on MA60 break.
*Key Levels*
*Support*: $0.3005 - $0.2984. Current base + demand zone. Hold this = bullish structure stays intact.
*Resistance*: $0.3088 - $0.3367. Rising MA60 + 24h high supply. Flip $0.3088 = bullish continuation toward $0.34+.
*Trader Insight*
SYN just ran "sweep → pump → MA60 test" price action. Bottomed at $0.2387 → spiked to $0.3367 → now consolidating under MA60 $0.3088. Order book shows 41.50% bids vs 58.50% asks = sellers pressing the MA. SYN needs a 4h close above $0.3088 to confirm trend flip. Reject there = pullback to $0.298. With +551% 30-day move, volatility is extreme. Trade confirmation, not anticipation.
Not financial advice. Structure > FOMO.
#SYN #SYNUSDC #Altcoins #MA60
$NVDAB SYN/USDC | Market Update - 23 Jun 2026*
*Current Price*: $0.3012 (+12.77% 24h)
*24h Range*: $0.2387 - $0.3367
*24h Volume*: 4.81M USDC
*Market Trend*: Bullish / Below MA60 Retest
SYN rallied +12.77% from $0.2387 low but is stalling under MA60 at $0.3088. Price at $0.3012 is testing the 60MA from below after tapping $0.3367 high. Structure improves above $0.3000, but trend flips only on MA60 break.
*Key Levels*
*Support*: $0.3005 - $0.2984. Current base + demand zone. Hold this = bullish structure stays intact.
*Resistance*: $0.3088 - $0.3367. Rising MA60 + 24h high supply. Flip $0.3088 = bullish continuation toward $0.34+.
*Trader Insight*
SYN just ran "sweep → pump → MA60 test" price action. Bottomed at $0.2387 → spiked to $0.3367 → now consolidating under MA60 $0.3088. Order book shows 41.50% bids vs 58.50% asks = sellers pressing the MA. SYN needs a 4h close above $0.3088 to confirm trend flip. Reject there = pullback to $0.298. With +551% 30-day move, volatility is extreme. Trade confirmation, not anticipation.
Not financial advice. Structure > FOMO.
#SYN #SYNUSDC #Altcoins #MA60
*Current Price*: $0.3012 (+12.77% 24h)
*24h Range*: $0.2387 - $0.3367
*24h Volume*: 4.81M USDC
*Market Trend*: Bullish / Below MA60 Retest
SYN rallied +12.77% from $0.2387 low but is stalling under MA60 at $0.3088. Price at $0.3012 is testing the 60MA from below after tapping $0.3367 high. Structure improves above $0.3000, but trend flips only on MA60 break.
*Key Levels*
*Support*: $0.3005 - $0.2984. Current base + demand zone. Hold this = bullish structure stays intact.
*Resistance*: $0.3088 - $0.3367. Rising MA60 + 24h high supply. Flip $0.3088 = bullish continuation toward $0.34+.
*Trader Insight*
SYN just ran "sweep → pump → MA60 test" price action. Bottomed at $0.2387 → spiked to $0.3367 → now consolidating under MA60 $0.3088. Order book shows 41.50% bids vs 58.50% asks = sellers pressing the MA. SYN needs a 4h close above $0.3088 to confirm trend flip. Reject there = pullback to $0.298. With +551% 30-day move, volatility is extreme. Trade confirmation, not anticipation.
Not financial advice. Structure > FOMO.
#SYN #SYNUSDC #Altcoins #MA60
141
පරිවර්තනය බලන්න
$SYN
{future}(SYNUSDT)
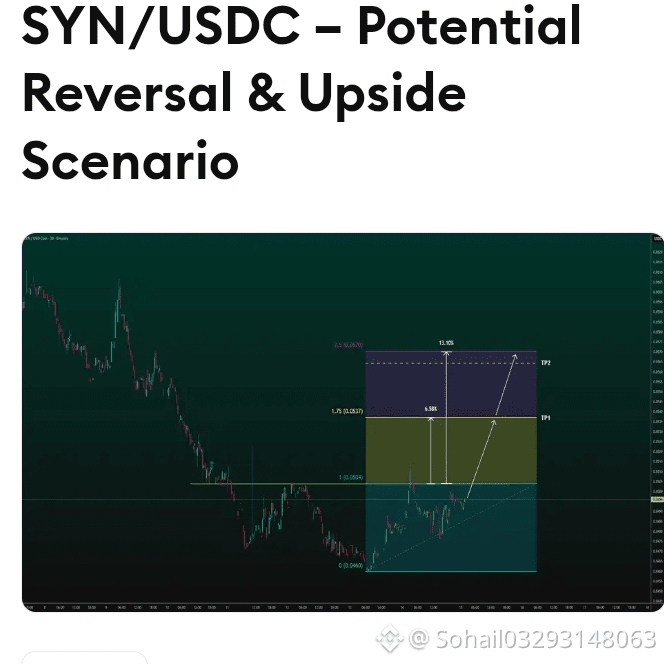
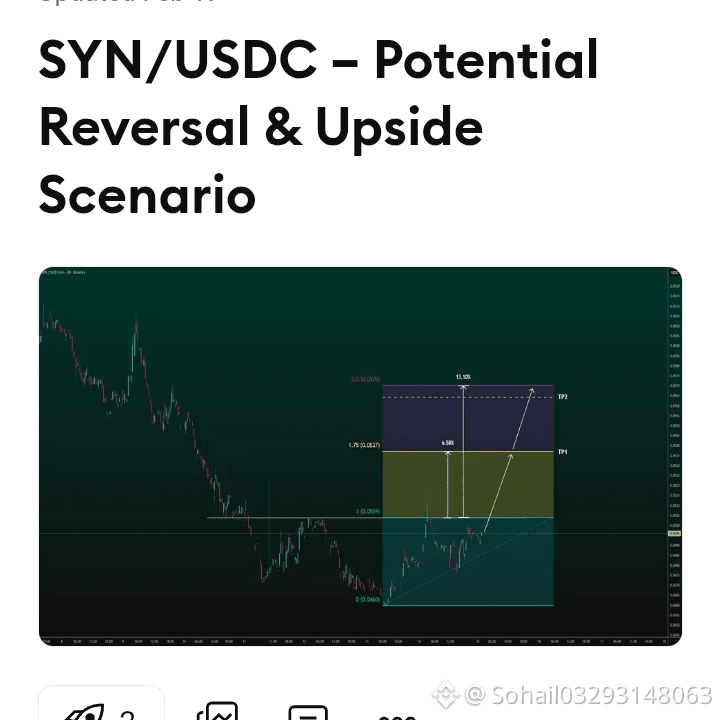
#SYNUSDC Price is forming a possible base after a downtrend, with signs of a short-term reversal. A continuation to the upside may follow if momentum holds, with projected targets at nearby resistance areas and invalidation below recent lows.
Trade active
TP1 reached at 0.0537, waiting for TP2, stop loss moved to brake even (0.0504).
#USOrdersAnthropicSuspendForeignNationalAccess
#PakistanSaysUSIranDealMayFinalize
#PakistanSaysUSIranPeaceDealTextFinalized
#SpaceXS1Discloses18712BitcoinHoldings
$SYN
#SYNUSDC Price is forming a possible base after a downtrend, with signs of a short-term reversal. A continuation to the upside may follow if momentum holds, with projected targets at nearby resistance areas and invalidation below recent lows.
Trade active
TP1 reached at 0.0537, waiting for TP2, stop loss moved to brake even (0.0504).
#USOrdersAnthropicSuspendForeignNationalAccess
#PakistanSaysUSIranDealMayFinalize
#PakistanSaysUSIranPeaceDealTextFinalized
#SpaceXS1Discloses18712BitcoinHoldings
#SYNUSDC Price is forming a possible base after a downtrend, with signs of a short-term reversal. A continuation to the upside may follow if momentum holds, with projected targets at nearby resistance areas and invalidation below recent lows.
Trade active
TP1 reached at 0.0537, waiting for TP2, stop loss moved to brake even (0.0504).
#USOrdersAnthropicSuspendForeignNationalAccess
#PakistanSaysUSIranDealMayFinalize
#PakistanSaysUSIranPeaceDealTextFinalized
#SpaceXS1Discloses18712BitcoinHoldings
1
53
පරිවර්තනය බලන්න
$SYN
{future}(SYNUSDT)
#SYNUSDC
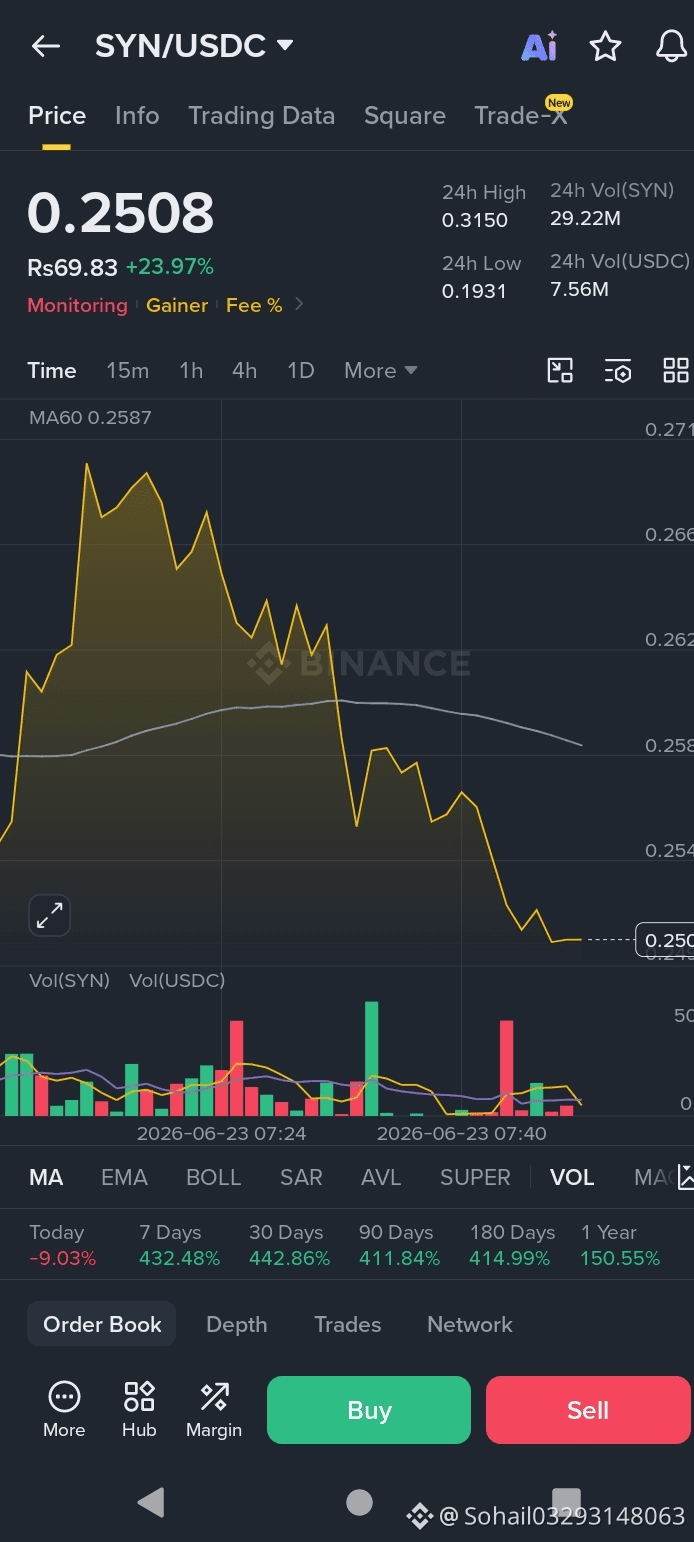
Price is forming a possible base after a downtrend, with signs of a short-term reversal. A continuation to the upside may follow if momentum holds, with projected targets at nearby resistance areas and invalidation below recent lows.
Trade active
TP1 reached at 0.0537, waiting for TP2, stop loss moved to brake even (0.0504)
#MorganStanleyToLaunchEthSolETFsAt0.14%
#BankOfEnglandSoftensStablecoinRules
#BinanceToOpenXLMSpotTrading
#OilRebounds3%
$SYN
#SYNUSDC
Price is forming a possible base after a downtrend, with signs of a short-term reversal. A continuation to the upside may follow if momentum holds, with projected targets at nearby resistance areas and invalidation below recent lows.
Trade active
TP1 reached at 0.0537, waiting for TP2, stop loss moved to brake even (0.0504)
#MorganStanleyToLaunchEthSolETFsAt0.14%
#BankOfEnglandSoftensStablecoinRules
#BinanceToOpenXLMSpotTrading
#OilRebounds3%
#SYNUSDC
Price is forming a possible base after a downtrend, with signs of a short-term reversal. A continuation to the upside may follow if momentum holds, with projected targets at nearby resistance areas and invalidation below recent lows.
Trade active
TP1 reached at 0.0537, waiting for TP2, stop loss moved to brake even (0.0504)
#MorganStanleyToLaunchEthSolETFsAt0.14%
#BankOfEnglandSoftensStablecoinRules
#BinanceToOpenXLMSpotTrading
#OilRebounds3%
1
191
·
--
උසබ තත්ත්වය
පරිවර්තනය බලන්න
$SYN
{future}(SYNUSDT)
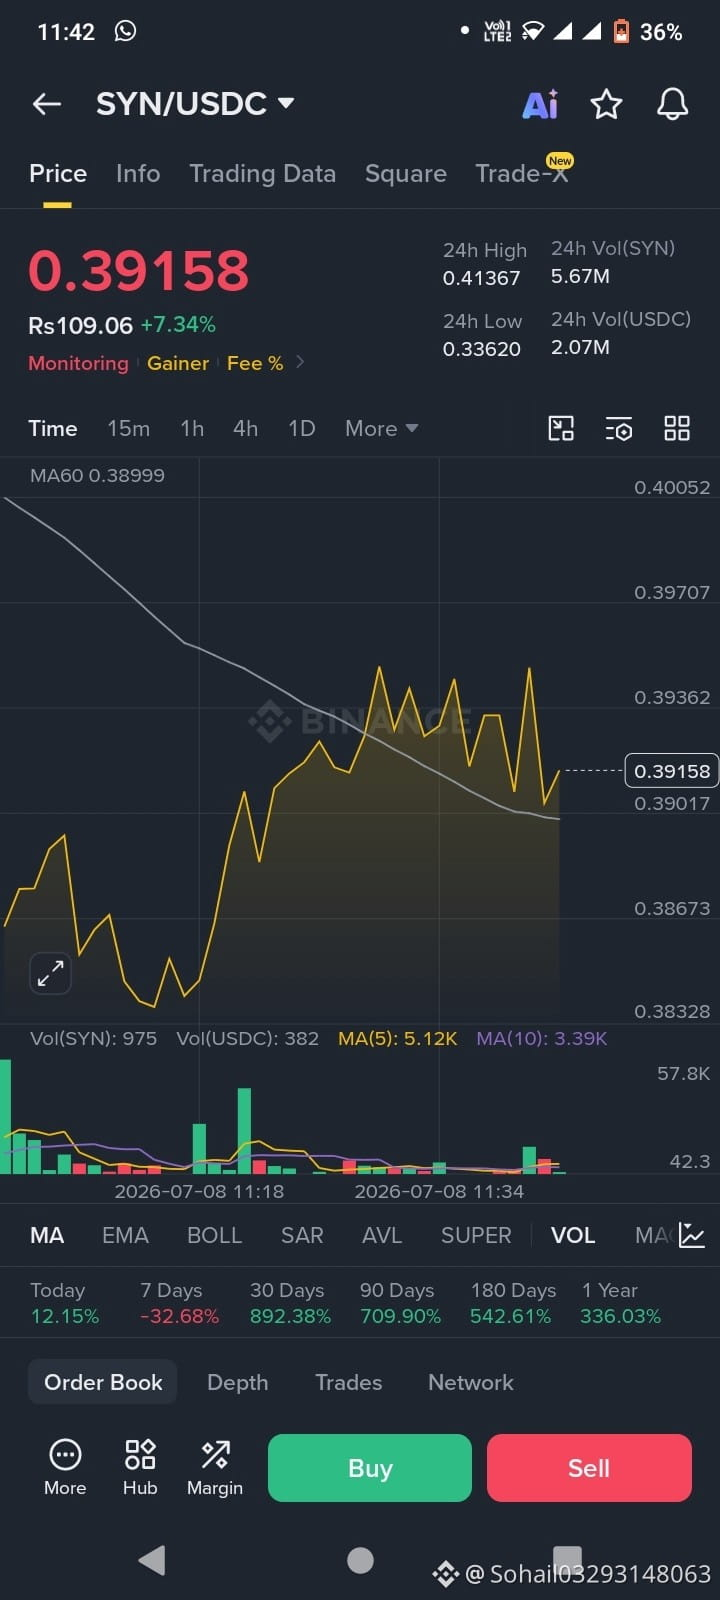
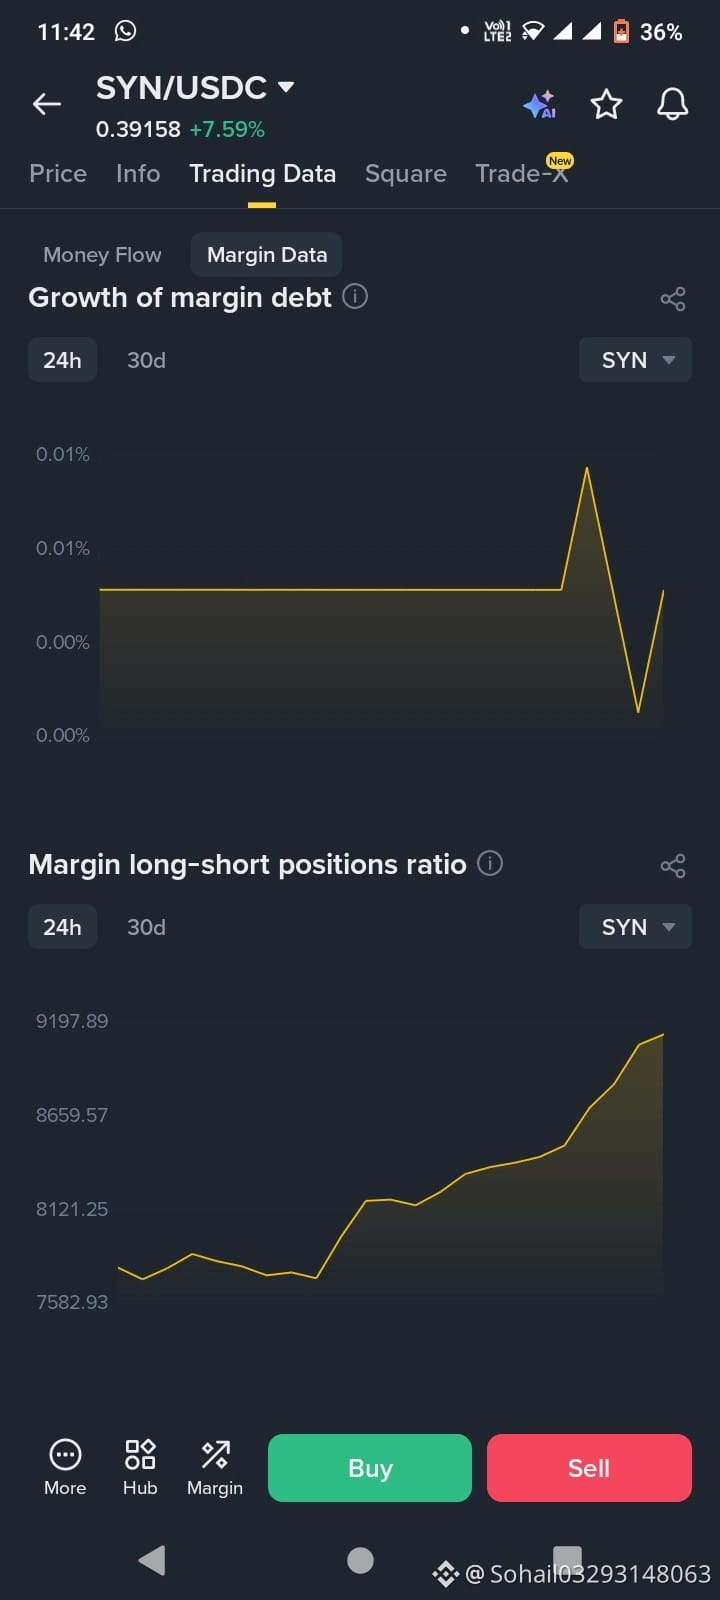
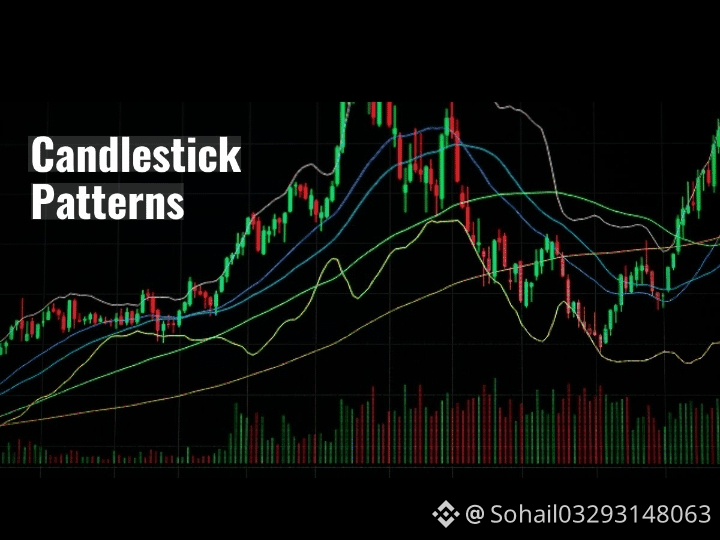
#SYNUSDC Analyzing the SYN/USDC pair involves using candlestick charts to identify market sentiment and potential price trends. Trading digital assets involves significant volatility, so understanding chart patterns is a fundamental part of technical analysis.
Key Candlestick Patterns for Analysis
Reading candlestick formations helps in understanding the historical interaction between buyers and sellers.
Bullish Engulfing: A small red candle followed by a larger green candle that completely "engulfs" the previous day's range. This often indicates a shift where buyers have gained momentum over sellers.
⭐ Morning Star: A three-candle pattern found at the bottom of a downtrend. It consists of a large red candle, a small-bodied candle (indecision), and a large green candle that closes well into the body of the first red candle.
🔨 Hammer: A candle with a small body at the top and a long lower wick. This suggests that while sellers initially pushed prices lower, strong buying pressure emerged to drive the price back up toward the open.
🧠Concepts in Market AnalysisSupport and Resistance: Traders often identify "Support," which is a historical price level where a downtrend tends to pause due to a concentration of buying demand. "Resistance" is the opposite— a level where an uptrend may pause as selling interest increases
💡Trend Confirmation: Instead of focusing on specific price targets, many analysts look for a breakout above resistance or a bounce off support accompanied by high trading volume to confirm a trend.
💵Risk Management: Using stop-loss orders is a common method to manage potential downside by automatically selling an asset if it reaches a certain price. It is generally suggested to determine a maximum percentage of capital to risk on any single position to maintain long-term portfolio stability.
#SKHynixUSListingOversubscribed
#VanguardOpensDigitalAssetsHeadSearch
#RussiaToRecognizeCryptoAsLegalProperty
#JapanBondYieldsRise
$SYN
#SYNUSDC Analyzing the SYN/USDC pair involves using candlestick charts to identify market sentiment and potential price trends. Trading digital assets involves significant volatility, so understanding chart patterns is a fundamental part of technical analysis.
Key Candlestick Patterns for Analysis
Reading candlestick formations helps in understanding the historical interaction between buyers and sellers.
Bullish Engulfing: A small red candle followed by a larger green candle that completely "engulfs" the previous day's range. This often indicates a shift where buyers have gained momentum over sellers.
⭐ Morning Star: A three-candle pattern found at the bottom of a downtrend. It consists of a large red candle, a small-bodied candle (indecision), and a large green candle that closes well into the body of the first red candle.
🔨 Hammer: A candle with a small body at the top and a long lower wick. This suggests that while sellers initially pushed prices lower, strong buying pressure emerged to drive the price back up toward the open.
🧠Concepts in Market AnalysisSupport and Resistance: Traders often identify "Support," which is a historical price level where a downtrend tends to pause due to a concentration of buying demand. "Resistance" is the opposite— a level where an uptrend may pause as selling interest increases
💡Trend Confirmation: Instead of focusing on specific price targets, many analysts look for a breakout above resistance or a bounce off support accompanied by high trading volume to confirm a trend.
💵Risk Management: Using stop-loss orders is a common method to manage potential downside by automatically selling an asset if it reaches a certain price. It is generally suggested to determine a maximum percentage of capital to risk on any single position to maintain long-term portfolio stability.
#SKHynixUSListingOversubscribed
#VanguardOpensDigitalAssetsHeadSearch
#RussiaToRecognizeCryptoAsLegalProperty
#JapanBondYieldsRise
#SYNUSDC Analyzing the SYN/USDC pair involves using candlestick charts to identify market sentiment and potential price trends. Trading digital assets involves significant volatility, so understanding chart patterns is a fundamental part of technical analysis.
Key Candlestick Patterns for Analysis
Reading candlestick formations helps in understanding the historical interaction between buyers and sellers.
Bullish Engulfing: A small red candle followed by a larger green candle that completely "engulfs" the previous day's range. This often indicates a shift where buyers have gained momentum over sellers.
⭐ Morning Star: A three-candle pattern found at the bottom of a downtrend. It consists of a large red candle, a small-bodied candle (indecision), and a large green candle that closes well into the body of the first red candle.
🔨 Hammer: A candle with a small body at the top and a long lower wick. This suggests that while sellers initially pushed prices lower, strong buying pressure emerged to drive the price back up toward the open.
🧠Concepts in Market AnalysisSupport and Resistance: Traders often identify "Support," which is a historical price level where a downtrend tends to pause due to a concentration of buying demand. "Resistance" is the opposite— a level where an uptrend may pause as selling interest increases
💡Trend Confirmation: Instead of focusing on specific price targets, many analysts look for a breakout above resistance or a bounce off support accompanied by high trading volume to confirm a trend.
💵Risk Management: Using stop-loss orders is a common method to manage potential downside by automatically selling an asset if it reaches a certain price. It is generally suggested to determine a maximum percentage of capital to risk on any single position to maintain long-term portfolio stability.
#SKHynixUSListingOversubscribed
#VanguardOpensDigitalAssetsHeadSearch
#RussiaToRecognizeCryptoAsLegalProperty
#JapanBondYieldsRise
1
121
·
--
උසබ තත්ත්වය
පරිවර්තනය බලන්න
$SYN
{future}(SYNUSDT)
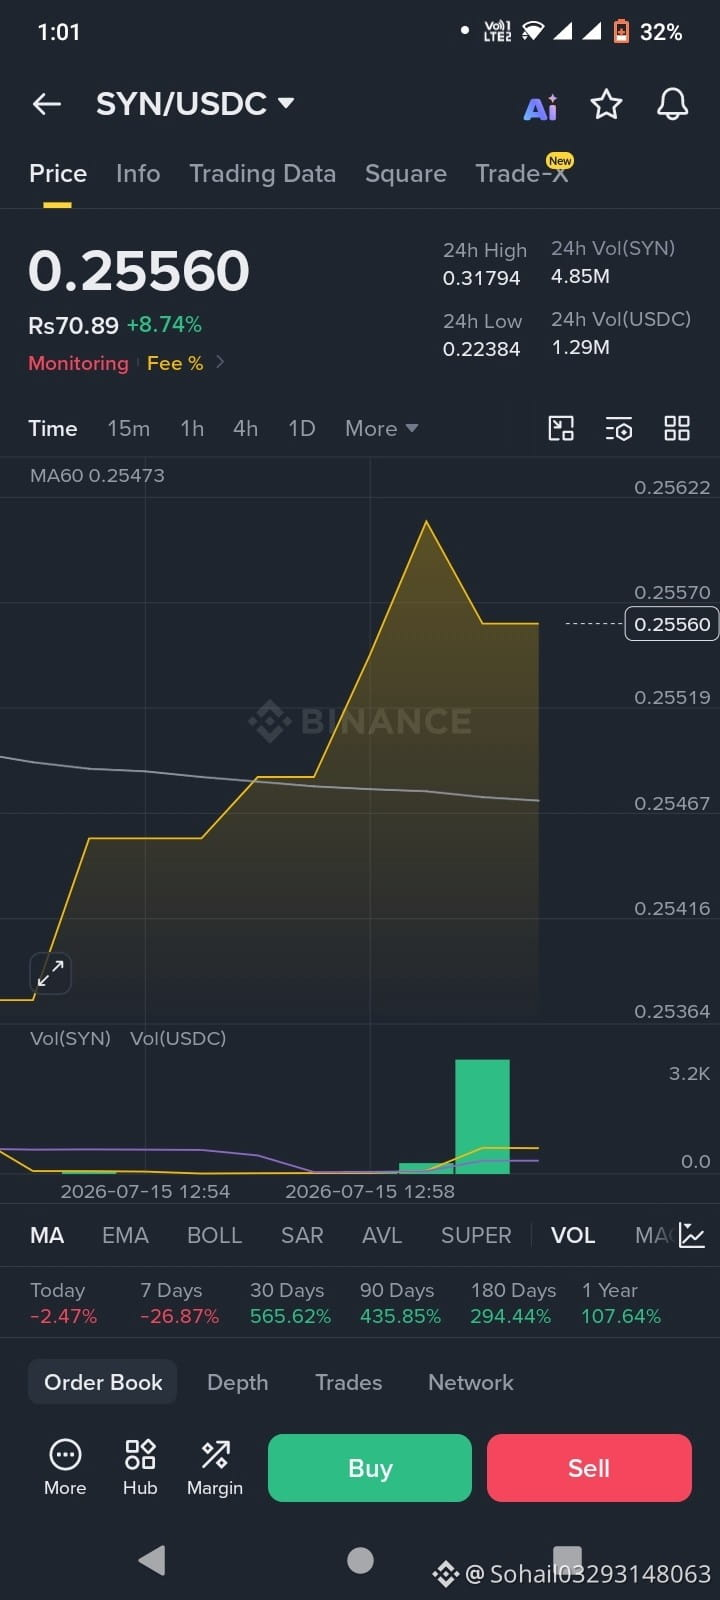
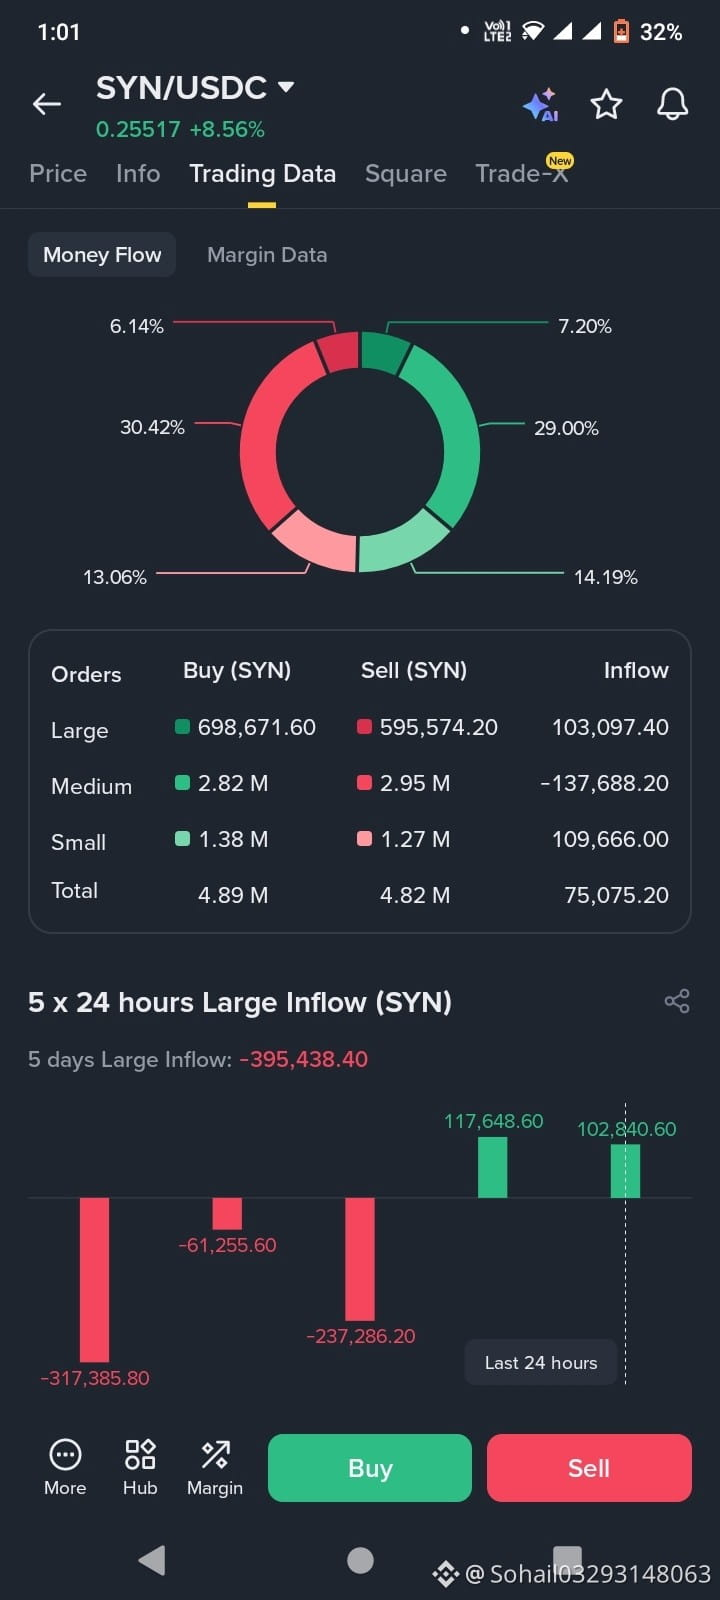
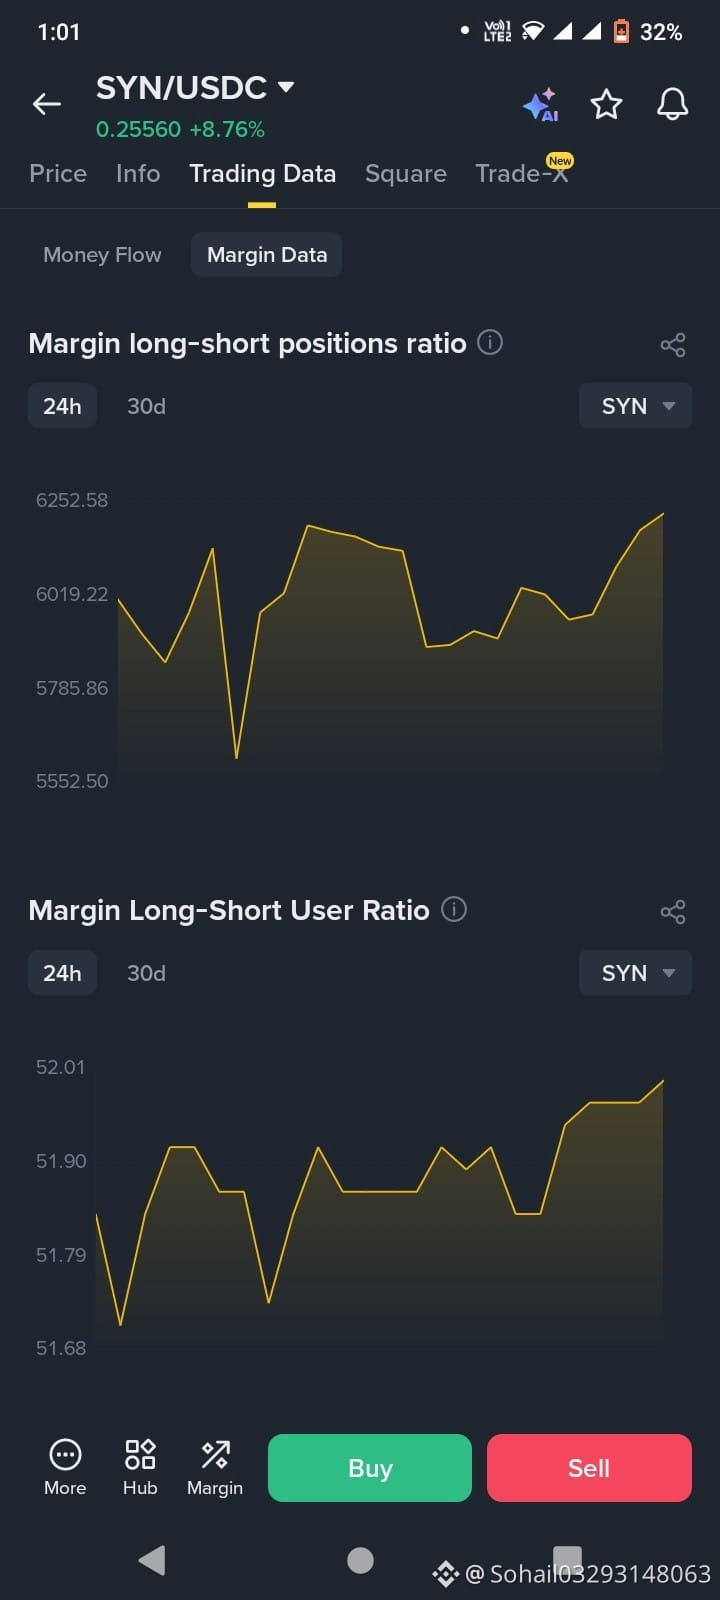
#SYNUSDC (Synapse) is currently trading in a highly volatile phase around the $0.30 - $0.32 mark. Traders are heavily watching the price action as it attempts to reverse a prolonged downtrend and clear immediate resistance zones, which would allow the asset to push toward higher targets.
🗝️ 🔐Key Technical Levels to WatchSupport Zone: $0.27 - $0.29. The price has historically shown bounces from this range, making it the primary defensive floor for bulls.Immediate Resistance: $0.36. This is the first hurdle. Breaking through this with volume will determine short-term bullish continuation.Major Breakout Target: $0.62 - $0.65. If macro bullish momentum breaks the descending trendline, this is the primary recovery zone.
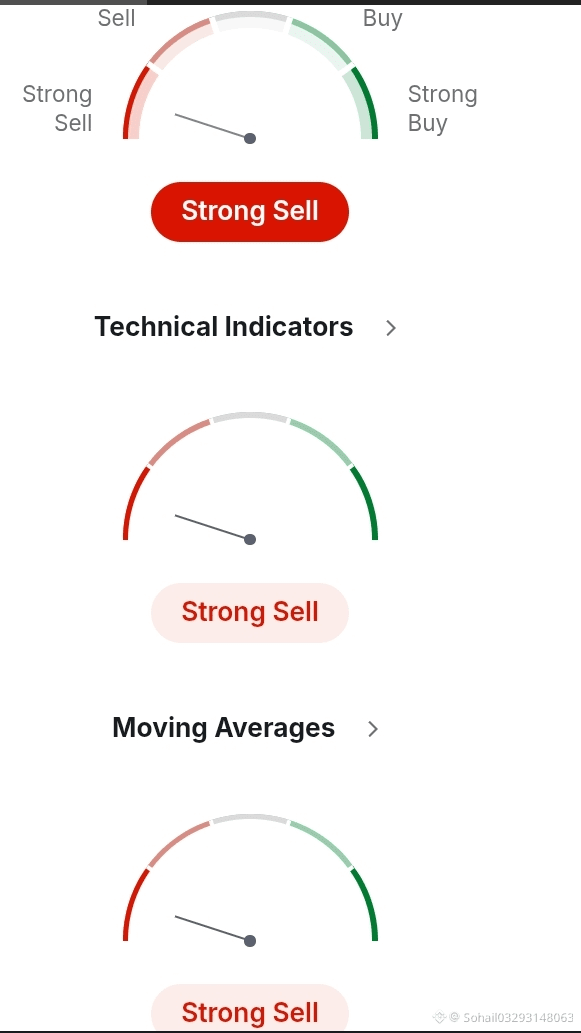
Trading Setup AnalysisThe Opportunity: SYN often displays "spring and expansion" accumulation patterns before initiating impulsive rally waves. Traders looking to enter should wait for the price to comfortably establish itself above the major moving averages (e.g., EMA 8/13/21) to confirm momentum shift.
Stop Loss (SL): A strict stop loss is critical given the asset's volatility. Many traders set SL just below the primary support (e.g., $0.25) to invalidate false breakouts
#AsianChipStocksRallyAfterUSSemiRebound
#IBMSharesFall25%
#TrumpScrapsHormuzShippingFeeAfterGulfPressure
#ChangxinTechSetsIPOPriceAtCNY8.66
$SYN
#SYNUSDC (Synapse) is currently trading in a highly volatile phase around the $0.30 - $0.32 mark. Traders are heavily watching the price action as it attempts to reverse a prolonged downtrend and clear immediate resistance zones, which would allow the asset to push toward higher targets.
🗝️ 🔐Key Technical Levels to WatchSupport Zone: $0.27 - $0.29. The price has historically shown bounces from this range, making it the primary defensive floor for bulls.Immediate Resistance: $0.36. This is the first hurdle. Breaking through this with volume will determine short-term bullish continuation.Major Breakout Target: $0.62 - $0.65. If macro bullish momentum breaks the descending trendline, this is the primary recovery zone.
Trading Setup AnalysisThe Opportunity: SYN often displays "spring and expansion" accumulation patterns before initiating impulsive rally waves. Traders looking to enter should wait for the price to comfortably establish itself above the major moving averages (e.g., EMA 8/13/21) to confirm momentum shift.
Stop Loss (SL): A strict stop loss is critical given the asset's volatility. Many traders set SL just below the primary support (e.g., $0.25) to invalidate false breakouts
#AsianChipStocksRallyAfterUSSemiRebound
#IBMSharesFall25%
#TrumpScrapsHormuzShippingFeeAfterGulfPressure
#ChangxinTechSetsIPOPriceAtCNY8.66
#SYNUSDC (Synapse) is currently trading in a highly volatile phase around the $0.30 - $0.32 mark. Traders are heavily watching the price action as it attempts to reverse a prolonged downtrend and clear immediate resistance zones, which would allow the asset to push toward higher targets.
🗝️ 🔐Key Technical Levels to WatchSupport Zone: $0.27 - $0.29. The price has historically shown bounces from this range, making it the primary defensive floor for bulls.Immediate Resistance: $0.36. This is the first hurdle. Breaking through this with volume will determine short-term bullish continuation.Major Breakout Target: $0.62 - $0.65. If macro bullish momentum breaks the descending trendline, this is the primary recovery zone.
Trading Setup AnalysisThe Opportunity: SYN often displays "spring and expansion" accumulation patterns before initiating impulsive rally waves. Traders looking to enter should wait for the price to comfortably establish itself above the major moving averages (e.g., EMA 8/13/21) to confirm momentum shift.
Stop Loss (SL): A strict stop loss is critical given the asset's volatility. Many traders set SL just below the primary support (e.g., $0.25) to invalidate false breakouts
#AsianChipStocksRallyAfterUSSemiRebound
#IBMSharesFall25%
#TrumpScrapsHormuzShippingFeeAfterGulfPressure
#ChangxinTechSetsIPOPriceAtCNY8.66
1
106

පරිවර්තනය බලන්න
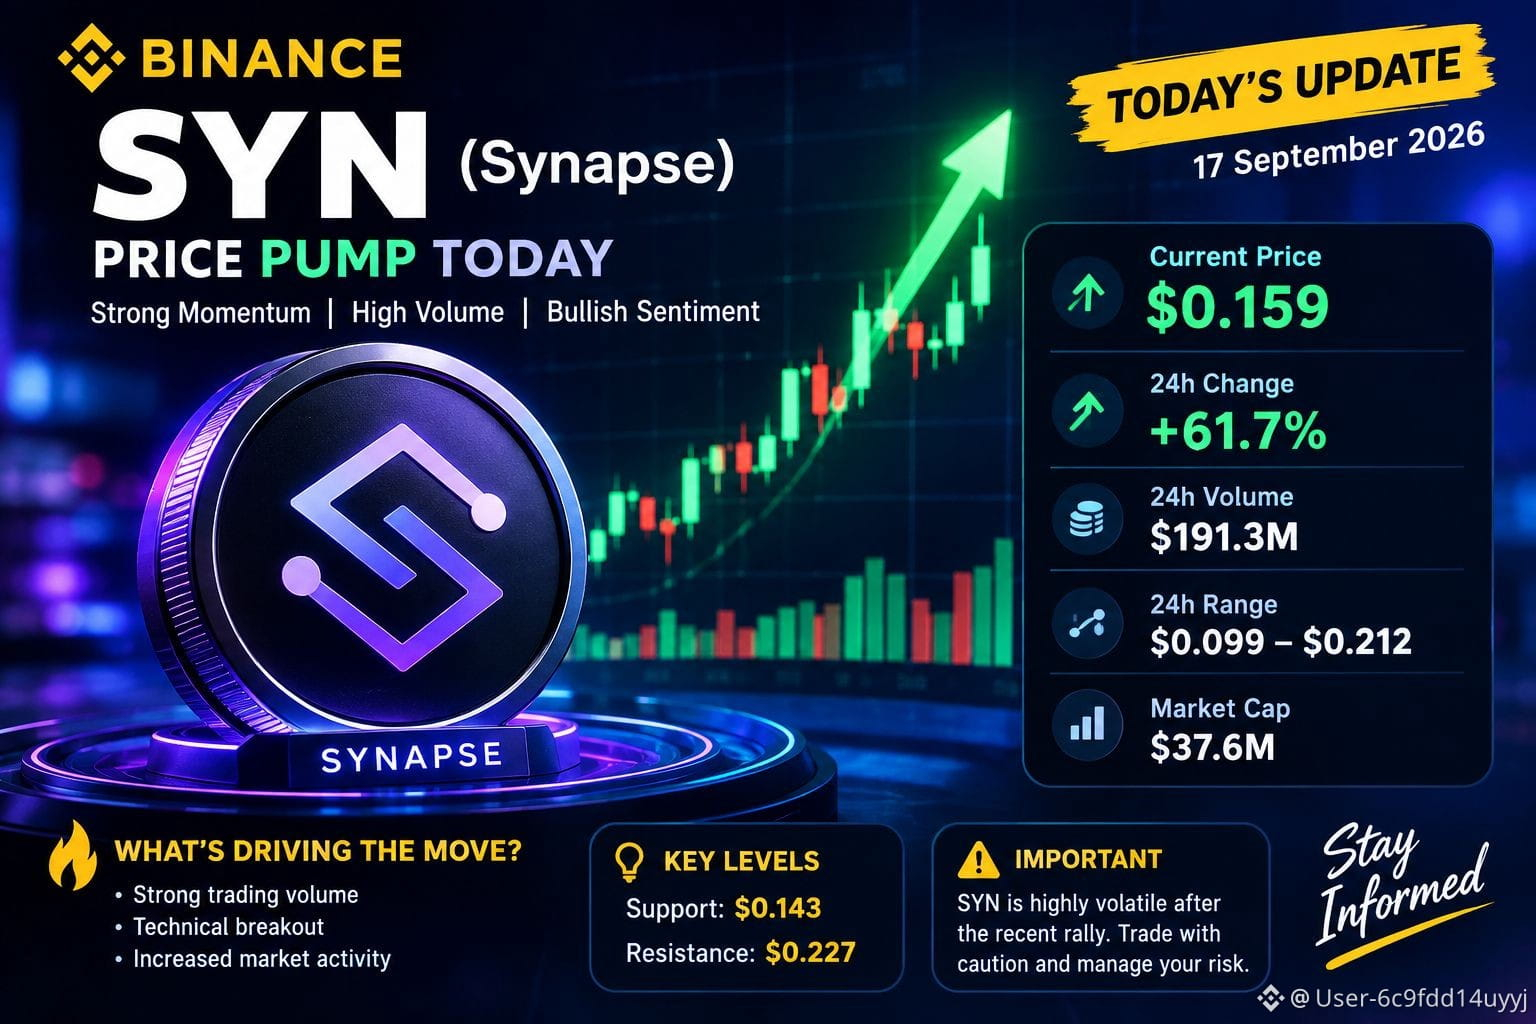
हाँ। मैंने 17 September 2026 की ताज़ा market data check की है।
🔥 $SYN (Synapse) — Today’s Update
Price: लगभग $0.159
24h change: लगभग +61.7%
24h volume: लगभग $191.3M
24h range: लगभग $0.099–$0.212
Market cap: लगभग $37.6M
$SYN में आज बहुत तेज़ momentum आया है। CoinGecko के historical data के अनुसार 16 September का close लगभग $0.1761 था, जबकि 15 September को close सिर्फ $0.1002 था—यानी पिछले कुछ sessions में move काफी तेज़ रहा है।
आज की reports के अनुसार SYN ने intraday $0.20 से ऊपर भी trade किया और volume लगभग $180–190M+ तक पहुंच गया। अभी तक इस rally के पीछे कोई स्पष्ट बड़ा$SYN -specific fundamental announcement सामने नहीं आया है।
Important levels: करीब $0.143 short-term support और $0.227 के आसपास resistance देखा जा रहा है।
इतनी तेज़ तेजी के बाद volatility बहुत high है, इसलिए केवल price pump देखकर entry लेना risky हो सकता है।#SYN #SynapseTrend #SYNUSDC #CryptoNews
हाँ। मैंने 17 September 2026 की ताज़ा market data check की है।
🔥 $SYN (Synapse) — Today’s Update
Price: लगभग $0.159
24h change: लगभग +61.7%
24h volume: लगभग $191.3M
24h range: लगभग $0.099–$0.212
Market cap: लगभग $37.6M
$SYN में आज बहुत तेज़ momentum आया है। CoinGecko के historical data के अनुसार 16 September का close लगभग $0.1761 था, जबकि 15 September को close सिर्फ $0.1002 था—यानी पिछले कुछ sessions में move काफी तेज़ रहा है।
आज की reports के अनुसार SYN ने intraday $0.20 से ऊपर भी trade किया और volume लगभग $180–190M+ तक पहुंच गया। अभी तक इस rally के पीछे कोई स्पष्ट बड़ा$SYN -specific fundamental announcement सामने नहीं आया है।
Important levels: करीब $0.143 short-term support और $0.227 के आसपास resistance देखा जा रहा है।
इतनी तेज़ तेजी के बाद volatility बहुत high है, इसलिए केवल price pump देखकर entry लेना risky हो सकता है।#SYN #SynapseTrend #SYNUSDC #CryptoNews
🔥 $SYN (Synapse) — Today’s Update
Price: लगभग $0.159
24h change: लगभग +61.7%
24h volume: लगभग $191.3M
24h range: लगभग $0.099–$0.212
Market cap: लगभग $37.6M
$SYN में आज बहुत तेज़ momentum आया है। CoinGecko के historical data के अनुसार 16 September का close लगभग $0.1761 था, जबकि 15 September को close सिर्फ $0.1002 था—यानी पिछले कुछ sessions में move काफी तेज़ रहा है।
आज की reports के अनुसार SYN ने intraday $0.20 से ऊपर भी trade किया और volume लगभग $180–190M+ तक पहुंच गया। अभी तक इस rally के पीछे कोई स्पष्ट बड़ा$SYN -specific fundamental announcement सामने नहीं आया है।
Important levels: करीब $0.143 short-term support और $0.227 के आसपास resistance देखा जा रहा है।
इतनी तेज़ तेजी के बाद volatility बहुत high है, इसलिए केवल price pump देखकर entry लेना risky हो सकता है।#SYN #SynapseTrend #SYNUSDC #CryptoNews
41
තවත් අන්තර්ගතයන් ගවේෂණය කිරීමට ඇතුල් වන්න
Binance චතුරශ්රය හි ගෝලීය ක්රිප්ටෝ පරිශීලකයින් හා එක්වන්න
⚡️ ක්රිප්ටෝ පිළිබඳ නවතම සහ ප්රයෝජනවත් තොරතුරු ලබා ගන්න.
💬 ලොව විශාලතම ක්රිප්ටෝ හුවමාරුව මගින් විශ්වාස කෙරේ.
👍 සත්යායනය කරන ලද නිර්මාණකරුවන්ගෙන් සැබෑ විදසුන් සොයා ගන්න.
විද්යුත් තැපෑල / දුරකථන අංකය
නැගී එන මාතෘකා
1
#BitcoinSurpasses$77000
16,680 views
221 සාකච්ඡා කරමින්
2
#ParadigmDisclosesZECHolding
65,096 views
1,013 සාකච්ඡා කරමින්
3
#BitcoinETFsShed$450M
25,750 views
217 සාකච්ඡා කරමින්
4
#USWeeklyJoblessClaimsFallTo196K
35,632 views
584 සාකච්ඡා කරමින්
5
#ArkhamSaysBlackRockBuys$1.5BInETH
6,512 views
71 සාකච්ඡා කරමින්
6
#ElSalvadorBTCHoldingsRiseTo7777
65,501 views
863 සාකච්ඡා කරමින්
7
#MemeLaunchpads82%OfArcDayOneVolume
65,485 views
1,024 සාකච්ඡා කරමින්
8
#OstiumLoanDisputeHearingSetInNYFederalCourt
50,948 views
728 සාකච්ඡා කරමින්
9
#HyperliquidUSDCSupplyOvertakesSolana
24,679 views
378 සාකච්ඡා කරමින්
10
#SKPoliceRefer18PolymarketUsersToProsecutors
29,069 views
525 සාකච්ඡා කරමින්