
#spcxb
spcxb
430,509 නැරඹීම්
3,847 සාකච්ඡා කරමින්
උණුසුම්
නවතම

·
--
Can $SPCXB sustain momentum above its prior $146.16 high on below-average volume?
At $146.23, up 3.23% over 24 hours with $24.26M volume, activity is steady despite hourly volume running below the recent average.
A sustained move past the $146.16 range high signals continuation, while a dip back toward the $137.07 range low warns of fading strength.
Will a confirmed breakout above 146.16 validate the current trend, or does losing 137.07 invalidate it? Check the chart to see which side holds
Tap $SPCXB for the live chart. #SPCXB #BinanceSquare
Can $SPCXB sustain momentum above its prior $146.16 high on below-average volume?
At $146.23, up 3.23% over 24 hours with $24.26M volume, activity is steady despite hourly volume running below the recent average.
A sustained move past the $146.16 range high signals continuation, while a dip back toward the $137.07 range low warns of fading strength.
Will a confirmed breakout above 146.16 validate the current trend, or does losing 137.07 invalidate it? Check the chart to see which side holds
Tap $SPCXB for the live chart. #SPCXB #BinanceSquare
At $146.23, up 3.23% over 24 hours with $24.26M volume, activity is steady despite hourly volume running below the recent average.
A sustained move past the $146.16 range high signals continuation, while a dip back toward the $137.07 range low warns of fading strength.
Will a confirmed breakout above 146.16 validate the current trend, or does losing 137.07 invalidate it? Check the chart to see which side holds
Tap $SPCXB for the live chart. #SPCXB #BinanceSquare

·
--
$SPCXB +3.21% | $TQQQB +3.13% | $INTCB +3.12%
#SPCXB is trading at $146.09, up +3.21% with $24.2 M of volume. The relatively high turnover could give it a bit more breathing room if buying pressure holds.
#TQQQB sits at $59.00, gaining +3.13% on $9.1 M of trade. Its modest volume suggests the move may be more price‑driven than backed by heavy liquidity.
#INTCB moved to $60.51, up +3.12% with $9.0 M changing hands. The narrow volume gap to TQQQB hints they’re pulling in similar interest.
🔍 Watch whether the larger SPCXB volume translates into a sustained climb, or if the tighter‑traded pairings revert to the mean.
#Write2Earn #Binance
$SPCXB +3.21% | $TQQQB +3.13% | $INTCB +3.12%
#SPCXB is trading at $146.09, up +3.21% with $24.2 M of volume. The relatively high turnover could give it a bit more breathing room if buying pressure holds.
#TQQQB sits at $59.00, gaining +3.13% on $9.1 M of trade. Its modest volume suggests the move may be more price‑driven than backed by heavy liquidity.
#INTCB moved to $60.51, up +3.12% with $9.0 M changing hands. The narrow volume gap to TQQQB hints they’re pulling in similar interest.
🔍 Watch whether the larger SPCXB volume translates into a sustained climb, or if the tighter‑traded pairings revert to the mean.
#Write2Earn #Binance
#SPCXB is trading at $146.09, up +3.21% with $24.2 M of volume. The relatively high turnover could give it a bit more breathing room if buying pressure holds.
#TQQQB sits at $59.00, gaining +3.13% on $9.1 M of trade. Its modest volume suggests the move may be more price‑driven than backed by heavy liquidity.
#INTCB moved to $60.51, up +3.12% with $9.0 M changing hands. The narrow volume gap to TQQQB hints they’re pulling in similar interest.
🔍 Watch whether the larger SPCXB volume translates into a sustained climb, or if the tighter‑traded pairings revert to the mean.
#Write2Earn #Binance

·
--
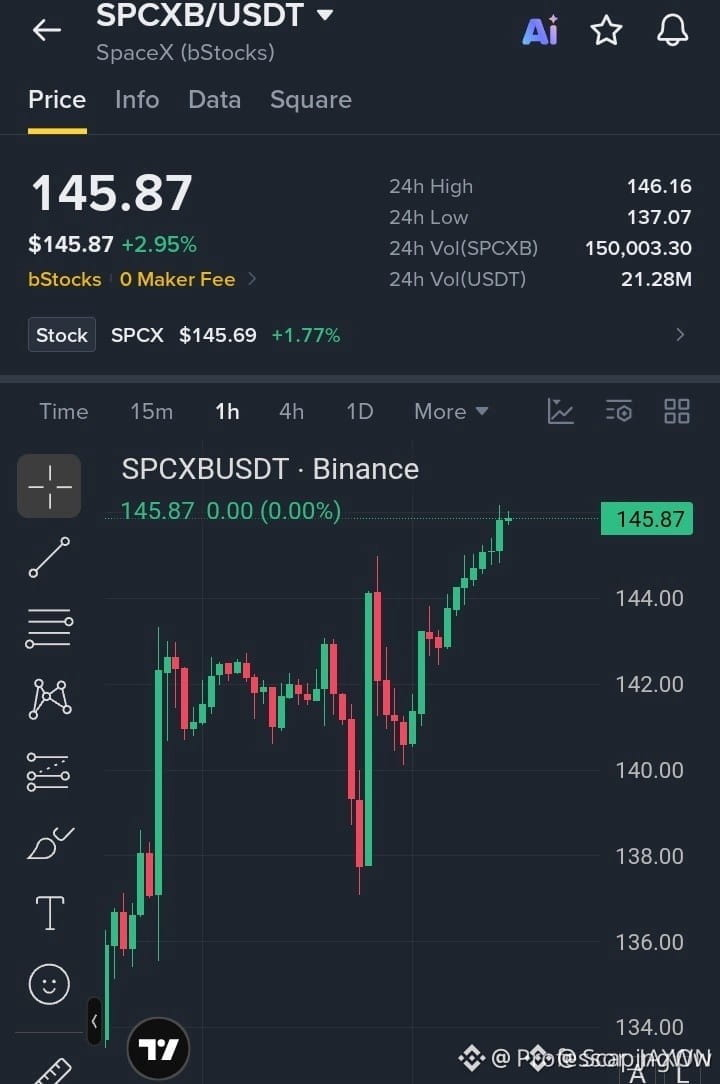
$SPCXB BULLS SQUEEZE THE ORDER BOOK AS MOMENTUM IGNITES FOR A FRESH BREAKOUT! 🚀 ⚡
Entry: 145.00–145.80 ⚡
Target: 150.00 🚀
Stop Loss: 143.70 ⚠️
Price action is coiling tight on the one-hour timeframe, printing consecutive higher highs while buyers relentlessly defend support. 📊 Holding firm above the 144.00 level keeps the bullish structure fully intact and ready to clear overhead resistance. ⚡
A decisive push past 146.16 unlocks the path toward our higher targets as late sellers get trapped in the squeeze. 🔍 Are you positioning ahead of the breakout or waiting for confirmation above resistance? 👇
⚠️ Not financial advice. Always manage your risk. 🛡️
🏷️ #SPCXB #LongSetup #Breakout #Crypto
🔥 💎
$SPCXB BULLS SQUEEZE THE ORDER BOOK AS MOMENTUM IGNITES FOR A FRESH BREAKOUT! 🚀 ⚡
Entry: 145.00–145.80 ⚡
Target: 150.00 🚀
Stop Loss: 143.70 ⚠️
Price action is coiling tight on the one-hour timeframe, printing consecutive higher highs while buyers relentlessly defend support. 📊 Holding firm above the 144.00 level keeps the bullish structure fully intact and ready to clear overhead resistance. ⚡
A decisive push past 146.16 unlocks the path toward our higher targets as late sellers get trapped in the squeeze. 🔍 Are you positioning ahead of the breakout or waiting for confirmation above resistance? 👇
⚠️ Not financial advice. Always manage your risk. 🛡️
🏷️ #SPCXB #LongSetup #Breakout #Crypto
🔥 💎
Entry: 145.00–145.80 ⚡
Target: 150.00 🚀
Stop Loss: 143.70 ⚠️
Price action is coiling tight on the one-hour timeframe, printing consecutive higher highs while buyers relentlessly defend support. 📊 Holding firm above the 144.00 level keeps the bullish structure fully intact and ready to clear overhead resistance. ⚡
A decisive push past 146.16 unlocks the path toward our higher targets as late sellers get trapped in the squeeze. 🔍 Are you positioning ahead of the breakout or waiting for confirmation above resistance? 👇
⚠️ Not financial advice. Always manage your risk. 🛡️
🏷️ #SPCXB #LongSetup #Breakout #Crypto
🔥 💎
4

·
--
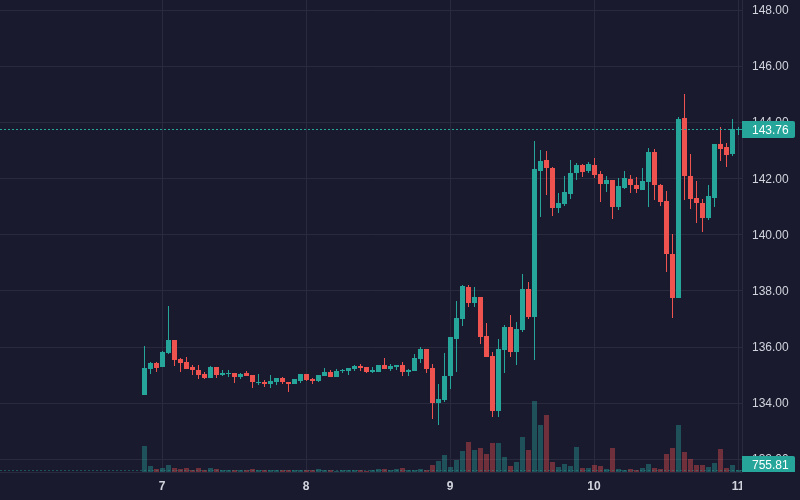
$SPCXB SPCXB is showing bullish movement: 0.91% (Crypto).
Volume: 21.32M | Last: $143.76
Key signals: high trader activity.
Bias Daily: BULLISH 🟢 | Weekly: BULLISH 🟢
SPCXB edged up 1.13% in 24 hours to $143.76, recovering from a $137.75 low amid RWA equity demand.
**RWA market expansion (High)**: Tokenized equities market cap reached $1.5B → SPCXB established as top-held tokenized asset
- **Dip rebound (High)**: Sharp rebound from $137.75 low to $144.04 with an $8.5M volume spike
- **Momentum recovery (Medium)**: MACD crossed into positive histogram (+0.116) as 6-period RSI reclaimed 65.3, confirming short-term bullish reversal
#SPCXB #BinanceSquare #PEPE #CPITestsDecemberRateOutlook #Crypto
$SPCXB SPCXB is showing bullish movement: 0.91% (Crypto).
Volume: 21.32M | Last: $143.76
Key signals: high trader activity.
Bias Daily: BULLISH 🟢 | Weekly: BULLISH 🟢
SPCXB edged up 1.13% in 24 hours to $143.76, recovering from a $137.75 low amid RWA equity demand.
**RWA market expansion (High)**: Tokenized equities market cap reached $1.5B → SPCXB established as top-held tokenized asset
- **Dip rebound (High)**: Sharp rebound from $137.75 low to $144.04 with an $8.5M volume spike
- **Momentum recovery (Medium)**: MACD crossed into positive histogram (+0.116) as 6-period RSI reclaimed 65.3, confirming short-term bullish reversal
#SPCXB #BinanceSquare #PEPE #CPITestsDecemberRateOutlook #Crypto
Volume: 21.32M | Last: $143.76
Key signals: high trader activity.
Bias Daily: BULLISH 🟢 | Weekly: BULLISH 🟢
SPCXB edged up 1.13% in 24 hours to $143.76, recovering from a $137.75 low amid RWA equity demand.
**RWA market expansion (High)**: Tokenized equities market cap reached $1.5B → SPCXB established as top-held tokenized asset
- **Dip rebound (High)**: Sharp rebound from $137.75 low to $144.04 with an $8.5M volume spike
- **Momentum recovery (Medium)**: MACD crossed into positive histogram (+0.116) as 6-period RSI reclaimed 65.3, confirming short-term bullish reversal
#SPCXB #BinanceSquare #PEPE #CPITestsDecemberRateOutlook #Crypto
24


·
--
先给结论:SPCXB 温和收涨,但还在区间里晃。
盘面数据:现价 143.16,24 小时+0.53%,成交额 0.21 亿 USDT,日内高 144.98、低 137.07,振幅 5.8%。
现价在区间中上部(77%),重心缓慢上移,属于温和转强。
价格站在 7 日均线(135.46),位于 25 日均线(142.68)上方,短期结构没坏。
位置上看,距 30 日高点 167.15 回撤 14.4%,30 日低点在 120.55,7 日累计 +1.5%。
缩量整理,这种反弹或下跌都容易被反手打回。
关键位很清楚:上方 144.98 是日内高点形成的压力,下方 137.07 是短期防守位;守住后者,多头就还有牌可打。
接下来盯两件事:低点上方能不能形成有效支撑,决定了下方空间是否打开;4 小时级别有没有出现缩量止跌的形态。
你的止盈止损挂在哪里,评论区对一下答案。
(以上为盘面复盘记录,不构成任何投资建议,合约有风险)
#SPCXB #盘面观察 #合约交易
先给结论:SPCXB 温和收涨,但还在区间里晃。
盘面数据:现价 143.16,24 小时+0.53%,成交额 0.21 亿 USDT,日内高 144.98、低 137.07,振幅 5.8%。
现价在区间中上部(77%),重心缓慢上移,属于温和转强。
价格站在 7 日均线(135.46),位于 25 日均线(142.68)上方,短期结构没坏。
位置上看,距 30 日高点 167.15 回撤 14.4%,30 日低点在 120.55,7 日累计 +1.5%。
缩量整理,这种反弹或下跌都容易被反手打回。
关键位很清楚:上方 144.98 是日内高点形成的压力,下方 137.07 是短期防守位;守住后者,多头就还有牌可打。
接下来盯两件事:低点上方能不能形成有效支撑,决定了下方空间是否打开;4 小时级别有没有出现缩量止跌的形态。
你的止盈止损挂在哪里,评论区对一下答案。
(以上为盘面复盘记录,不构成任何投资建议,合约有风险)
#SPCXB #盘面观察 #合约交易
盘面数据:现价 143.16,24 小时+0.53%,成交额 0.21 亿 USDT,日内高 144.98、低 137.07,振幅 5.8%。
现价在区间中上部(77%),重心缓慢上移,属于温和转强。
价格站在 7 日均线(135.46),位于 25 日均线(142.68)上方,短期结构没坏。
位置上看,距 30 日高点 167.15 回撤 14.4%,30 日低点在 120.55,7 日累计 +1.5%。
缩量整理,这种反弹或下跌都容易被反手打回。
关键位很清楚:上方 144.98 是日内高点形成的压力,下方 137.07 是短期防守位;守住后者,多头就还有牌可打。
接下来盯两件事:低点上方能不能形成有效支撑,决定了下方空间是否打开;4 小时级别有没有出现缩量止跌的形态。
你的止盈止损挂在哪里,评论区对一下答案。
(以上为盘面复盘记录,不构成任何投资建议,合约有风险)
#SPCXB #盘面观察 #合约交易
28
·
--
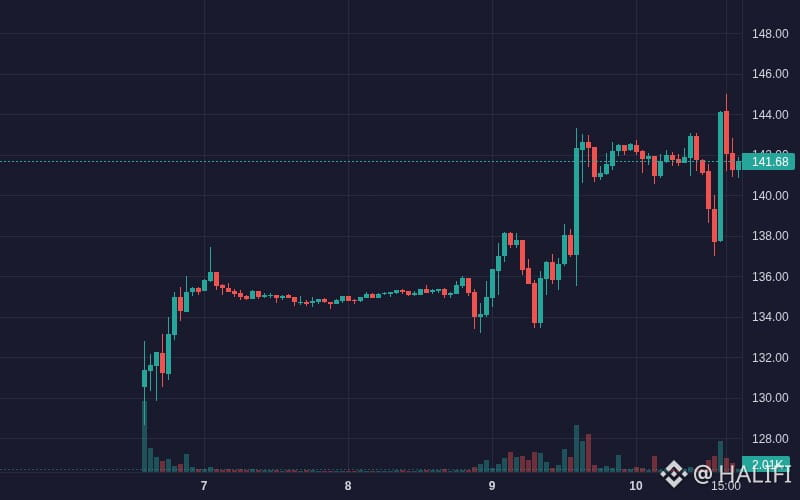
$SPCXB SPCXB is showing bullish movement: 0.30% (Crypto).
Volume: 21.29M | Last: $141.67
Key signals: high trader activity.
Bias Daily: BULLISH 🟢 | Weekly: BULLISH 🟢
SPCXB edged up 0.23% in 24h to $141.30 after dip-buyers absorbed a sharp drop to $137.75.
**Tokenized equity demand (High)**: Expanding RWA interest drives sustained liquidity into tokenized US tech assets
- **Dip-buying volume surge (High)**: High volume spike of $8.51M at $137.75 low → quick rebound to $144.04
- **Bullish trend retention (Medium)**: Price remains above EMA 99 ($137.72) despite intraday volatility
#SPCXB #CPITestsDecemberRateOutlook #TRUMP #PEPE #Crypto
$SPCXB SPCXB is showing bullish movement: 0.30% (Crypto).
Volume: 21.29M | Last: $141.67
Key signals: high trader activity.
Bias Daily: BULLISH 🟢 | Weekly: BULLISH 🟢
SPCXB edged up 0.23% in 24h to $141.30 after dip-buyers absorbed a sharp drop to $137.75.
**Tokenized equity demand (High)**: Expanding RWA interest drives sustained liquidity into tokenized US tech assets
- **Dip-buying volume surge (High)**: High volume spike of $8.51M at $137.75 low → quick rebound to $144.04
- **Bullish trend retention (Medium)**: Price remains above EMA 99 ($137.72) despite intraday volatility
#SPCXB #CPITestsDecemberRateOutlook #TRUMP #PEPE #Crypto
Volume: 21.29M | Last: $141.67
Key signals: high trader activity.
Bias Daily: BULLISH 🟢 | Weekly: BULLISH 🟢
SPCXB edged up 0.23% in 24h to $141.30 after dip-buyers absorbed a sharp drop to $137.75.
**Tokenized equity demand (High)**: Expanding RWA interest drives sustained liquidity into tokenized US tech assets
- **Dip-buying volume surge (High)**: High volume spike of $8.51M at $137.75 low → quick rebound to $144.04
- **Bullish trend retention (Medium)**: Price remains above EMA 99 ($137.72) despite intraday volatility
#SPCXB #CPITestsDecemberRateOutlook #TRUMP #PEPE #Crypto
51

·
--
🔥 $SPCXB Technical Update: Key Levels & Momentum Breakdown
📊 1. Market Snapshot
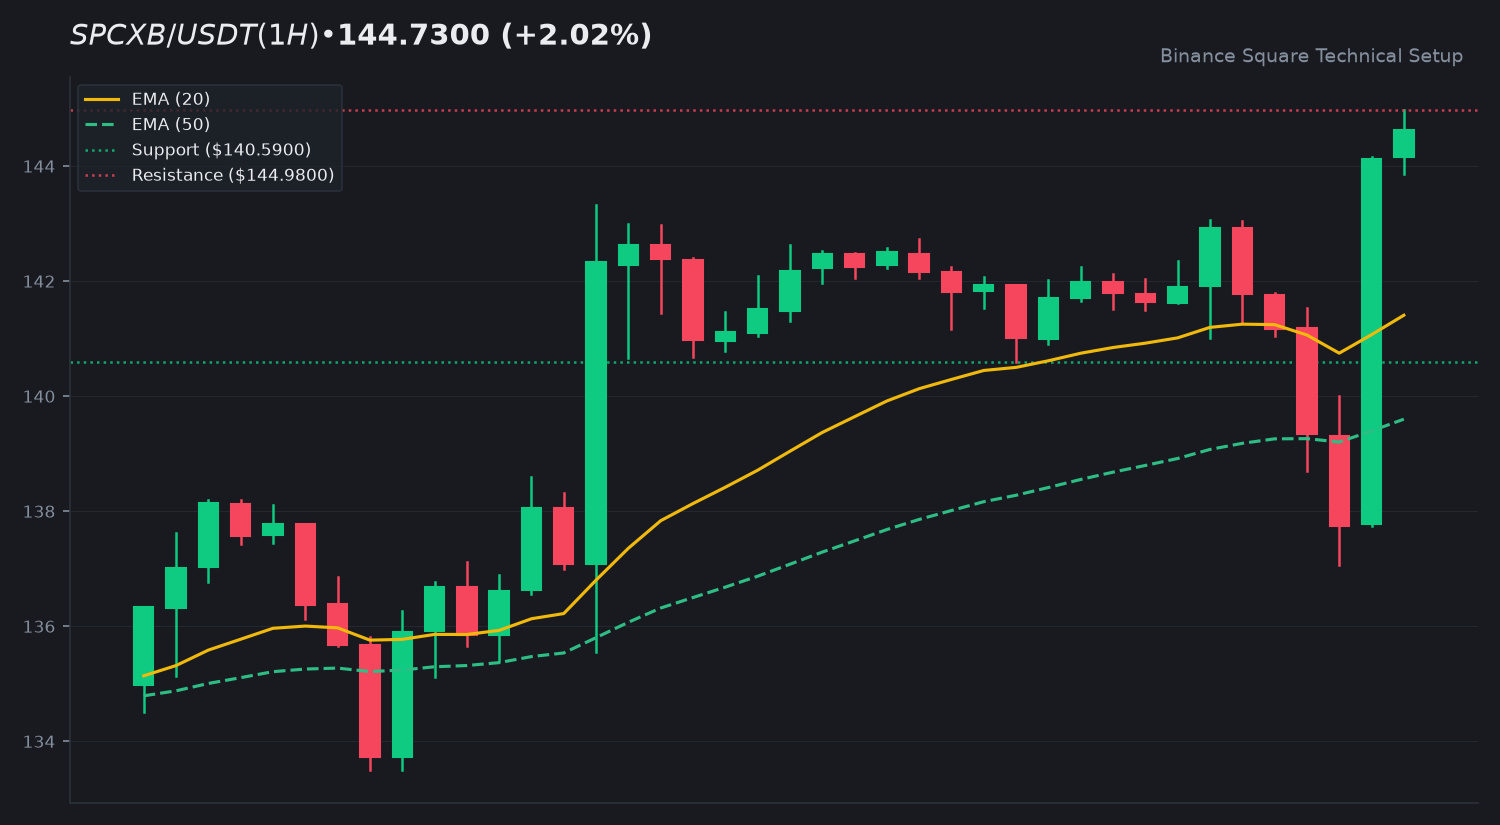
The asset $SPCXB is currently trading at 144.7300 USDT, reflecting a 24h increase of 2.02 percent. Market activity remains steady with a 24h quote volume of 27,676,929 USDT. Current price action shows the asset hovering near its daily high of 144.9800 USDT.
📈 2. Technical Momentum & Indicator Bias
The trend posture remains constructive as the price holds above the EMA 20 at 141.4076 and the EMA 50 at 139.6006. The RSI at 62.33 indicates moderate bullish momentum without reaching overbought territory. The MACD histogram is at -0.0456, showing the MACD line slightly below the signal line, suggesting a period of consolidation or a slight cooling of momentum despite the broader uptrend.
🎯 3. Key Technical Levels to Watch
• 🟢 Resistance Zone: 144.9800 is the immediate ceiling. A clean break above this could shift the technical outlook.
• 🔴 Support Zone: 140.5900 acts as the primary support floor, followed by 134.2329 as the secondary level.
• 🛡️ Pivot Confluence: The EMA 20 at 141.4076 serves as the vital pivot for short-term trend maintenance.
💡 4. Technical Takeaway & Risk Management
Price action is currently testing the upper bounds of the recent range. Traders are monitoring the relationship between the price and the EMA 20. Sustained trading above this EMA supports the current bullish trend, while a move below may invite a retest of lower support levels.
💬 5. Community Discussion
What is your technical outlook for $SPCXB this week? Are you accumulating or waiting for confirmation? Drop your thoughts below! 👇
⚠️ 6. Disclaimer
Educational technical analysis only. Not financial advice (NFA). Crypto markets involve risk. Always DYOR.
$SPCXB #SPCXB #BinanceSquare
🔥 $SPCXB Technical Update: Key Levels & Momentum Breakdown
📊 1. Market Snapshot
The asset $SPCXB is currently trading at 144.7300 USDT, reflecting a 24h increase of 2.02 percent. Market activity remains steady with a 24h quote volume of 27,676,929 USDT. Current price action shows the asset hovering near its daily high of 144.9800 USDT.
📈 2. Technical Momentum & Indicator Bias
The trend posture remains constructive as the price holds above the EMA 20 at 141.4076 and the EMA 50 at 139.6006. The RSI at 62.33 indicates moderate bullish momentum without reaching overbought territory. The MACD histogram is at -0.0456, showing the MACD line slightly below the signal line, suggesting a period of consolidation or a slight cooling of momentum despite the broader uptrend.
🎯 3. Key Technical Levels to Watch
• 🟢 Resistance Zone: 144.9800 is the immediate ceiling. A clean break above this could shift the technical outlook.
• 🔴 Support Zone: 140.5900 acts as the primary support floor, followed by 134.2329 as the secondary level.
• 🛡️ Pivot Confluence: The EMA 20 at 141.4076 serves as the vital pivot for short-term trend maintenance.
💡 4. Technical Takeaway & Risk Management
Price action is currently testing the upper bounds of the recent range. Traders are monitoring the relationship between the price and the EMA 20. Sustained trading above this EMA supports the current bullish trend, while a move below may invite a retest of lower support levels.
💬 5. Community Discussion
What is your technical outlook for $SPCXB this week? Are you accumulating or waiting for confirmation? Drop your thoughts below! 👇
⚠️ 6. Disclaimer
Educational technical analysis only. Not financial advice (NFA). Crypto markets involve risk. Always DYOR.
$SPCXB #SPCXB #BinanceSquare
📊 1. Market Snapshot
The asset $SPCXB is currently trading at 144.7300 USDT, reflecting a 24h increase of 2.02 percent. Market activity remains steady with a 24h quote volume of 27,676,929 USDT. Current price action shows the asset hovering near its daily high of 144.9800 USDT.
📈 2. Technical Momentum & Indicator Bias
The trend posture remains constructive as the price holds above the EMA 20 at 141.4076 and the EMA 50 at 139.6006. The RSI at 62.33 indicates moderate bullish momentum without reaching overbought territory. The MACD histogram is at -0.0456, showing the MACD line slightly below the signal line, suggesting a period of consolidation or a slight cooling of momentum despite the broader uptrend.
🎯 3. Key Technical Levels to Watch
• 🟢 Resistance Zone: 144.9800 is the immediate ceiling. A clean break above this could shift the technical outlook.
• 🔴 Support Zone: 140.5900 acts as the primary support floor, followed by 134.2329 as the secondary level.
• 🛡️ Pivot Confluence: The EMA 20 at 141.4076 serves as the vital pivot for short-term trend maintenance.
💡 4. Technical Takeaway & Risk Management
Price action is currently testing the upper bounds of the recent range. Traders are monitoring the relationship between the price and the EMA 20. Sustained trading above this EMA supports the current bullish trend, while a move below may invite a retest of lower support levels.
💬 5. Community Discussion
What is your technical outlook for $SPCXB this week? Are you accumulating or waiting for confirmation? Drop your thoughts below! 👇
⚠️ 6. Disclaimer
Educational technical analysis only. Not financial advice (NFA). Crypto markets involve risk. Always DYOR.
$SPCXB #SPCXB #BinanceSquare
88

·
--
一个小时拉了 2.57%,$SPCXB 报 141.09,可它一整天其实只跌了 0.33%——这个位置,多空已经吵起来了。
说人话:拿了一整天的人,账面几乎没动;刚打开行情的人,还以为它在拉升。过去这一小时的涨幅比全天加起来都大,24 小时高点 143.33 就在头顶上,摸一下就知道是真要往上走,还是冲一下就回来。
我偏向先看着不动,因为一小时的脉冲说不清是启动还是诱多,143.33 这道坎还没真正碰过;但要是它真站上 143.33、下一小时还继续放量,我立马改主意,承认这波是有人在往里推。
一小时拉了 2.57%,你们觉得这是刚启动,还是就这一小时热闹?
$SPCXB
#SPCXB #行情分析
一个小时拉了 2.57%,$SPCXB 报 141.09,可它一整天其实只跌了 0.33%——这个位置,多空已经吵起来了。
说人话:拿了一整天的人,账面几乎没动;刚打开行情的人,还以为它在拉升。过去这一小时的涨幅比全天加起来都大,24 小时高点 143.33 就在头顶上,摸一下就知道是真要往上走,还是冲一下就回来。
我偏向先看着不动,因为一小时的脉冲说不清是启动还是诱多,143.33 这道坎还没真正碰过;但要是它真站上 143.33、下一小时还继续放量,我立马改主意,承认这波是有人在往里推。
一小时拉了 2.57%,你们觉得这是刚启动,还是就这一小时热闹?
$SPCXB
#SPCXB #行情分析
说人话:拿了一整天的人,账面几乎没动;刚打开行情的人,还以为它在拉升。过去这一小时的涨幅比全天加起来都大,24 小时高点 143.33 就在头顶上,摸一下就知道是真要往上走,还是冲一下就回来。
我偏向先看着不动,因为一小时的脉冲说不清是启动还是诱多,143.33 这道坎还没真正碰过;但要是它真站上 143.33、下一小时还继续放量,我立马改主意,承认这波是有人在往里推。
一小时拉了 2.57%,你们觉得这是刚启动,还是就这一小时热闹?
$SPCXB
#SPCXB #行情分析
1


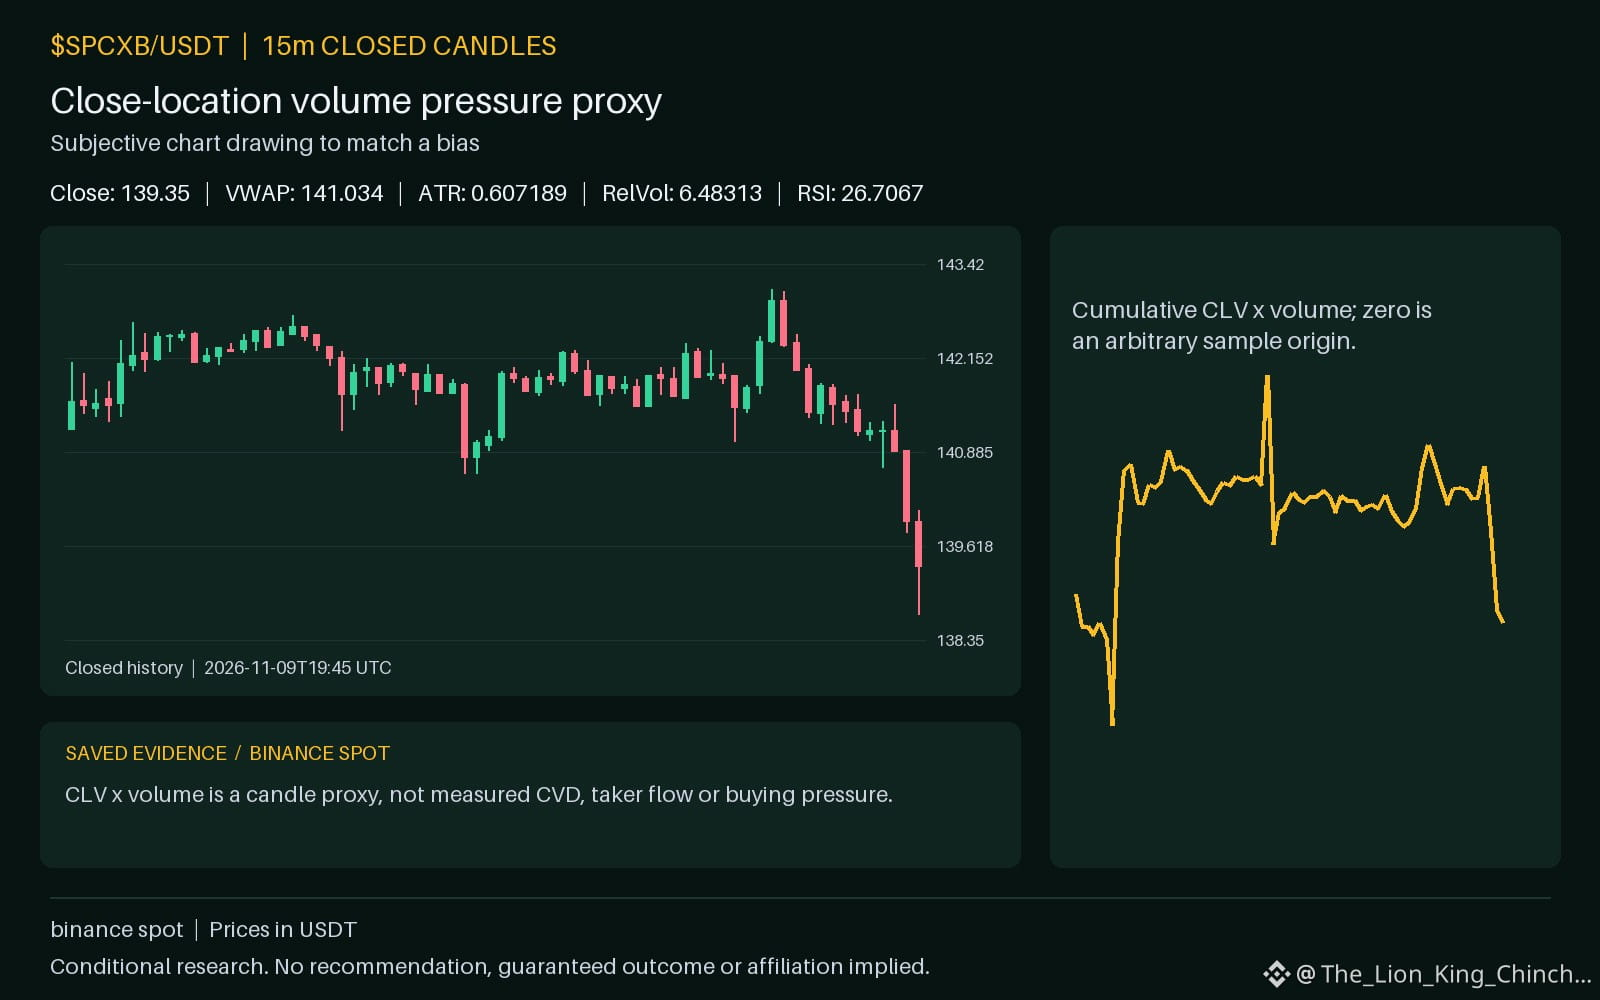
$SPCXB: Subjective Charting and Expectancy Bias
The current market data for $SPCXB shows the price at 139.35, positioned below the primary support of 139.8. With an RSI of 26.7067 and a daily change of 0.941688, the asset is moving with relative volume at 6.48313. These numbers provide a snapshot of a range break, but how we interpret them often depends on our internal state.
When a researcher expects a bounce, they might face the observer-expectancy effect. This is the tendency to subconsciously manipulate data to reach a desired conclusion. For instance, if the hourly direction is down, a person might move a support line lower on the chart to avoid admitting a breakdown has occurred. This subjective adjustment creates a false sense of security.
A hypothetical counterexample would be a researcher who draws multiple trendlines and ignores the one that was breached, focusing instead on a steeper line that remains intact. To check this bias, ask yourself: would I draw this line exactly the same way if I had no stake in the outcome? Try removing all drawings and starting fresh with only hard metrics like 141.247 or the daily VWAP of 141.034. Comparing your original drawing to one made with neutral rules helps identify if you are adjusting the chart to fit a bias.
Probabilistic market research, not a recommendation or guaranteed return.
Have you ever caught yourself slightly adjusting a trendline just to make a chart look like it hasn't broken down yet?
#SPCXB #TradingPsychology #CryptoLearning
$SPCXB : Subjective Charting and Expectancy Bias
The current market data for $SPCXB shows the price at 139.35, positioned below the primary support of 139.8. With an RSI of 26.7067 and a daily change of 0.941688, the asset is moving with relative volume at 6.48313. These numbers provide a snapshot of a range break, but how we interpret them often depends on our internal state.
When a researcher expects a bounce, they might face the observer-expectancy effect. This is the tendency to subconsciously manipulate data to reach a desired conclusion. For instance, if the hourly direction is down, a person might move a support line lower on the chart to avoid admitting a breakdown has occurred. This subjective adjustment creates a false sense of security.
A hypothetical counterexample would be a researcher who draws multiple trendlines and ignores the one that was breached, focusing instead on a steeper line that remains intact. To check this bias, ask yourself: would I draw this line exactly the same way if I had no stake in the outcome? Try removing all drawings and starting fresh with only hard metrics like 141.247 or the daily VWAP of 141.034. Comparing your original drawing to one made with neutral rules helps identify if you are adjusting the chart to fit a bias.
Probabilistic market research, not a recommendation or guaranteed return.
Have you ever caught yourself slightly adjusting a trendline just to make a chart look like it hasn't broken down yet?
#SPCXB #TradingPsychology #CryptoLearning
The current market data for $SPCXB shows the price at 139.35, positioned below the primary support of 139.8. With an RSI of 26.7067 and a daily change of 0.941688, the asset is moving with relative volume at 6.48313. These numbers provide a snapshot of a range break, but how we interpret them often depends on our internal state.
When a researcher expects a bounce, they might face the observer-expectancy effect. This is the tendency to subconsciously manipulate data to reach a desired conclusion. For instance, if the hourly direction is down, a person might move a support line lower on the chart to avoid admitting a breakdown has occurred. This subjective adjustment creates a false sense of security.
A hypothetical counterexample would be a researcher who draws multiple trendlines and ignores the one that was breached, focusing instead on a steeper line that remains intact. To check this bias, ask yourself: would I draw this line exactly the same way if I had no stake in the outcome? Try removing all drawings and starting fresh with only hard metrics like 141.247 or the daily VWAP of 141.034. Comparing your original drawing to one made with neutral rules helps identify if you are adjusting the chart to fit a bias.
Probabilistic market research, not a recommendation or guaranteed return.
Have you ever caught yourself slightly adjusting a trendline just to make a chart look like it hasn't broken down yet?
#SPCXB #TradingPsychology #CryptoLearning
32


·
--
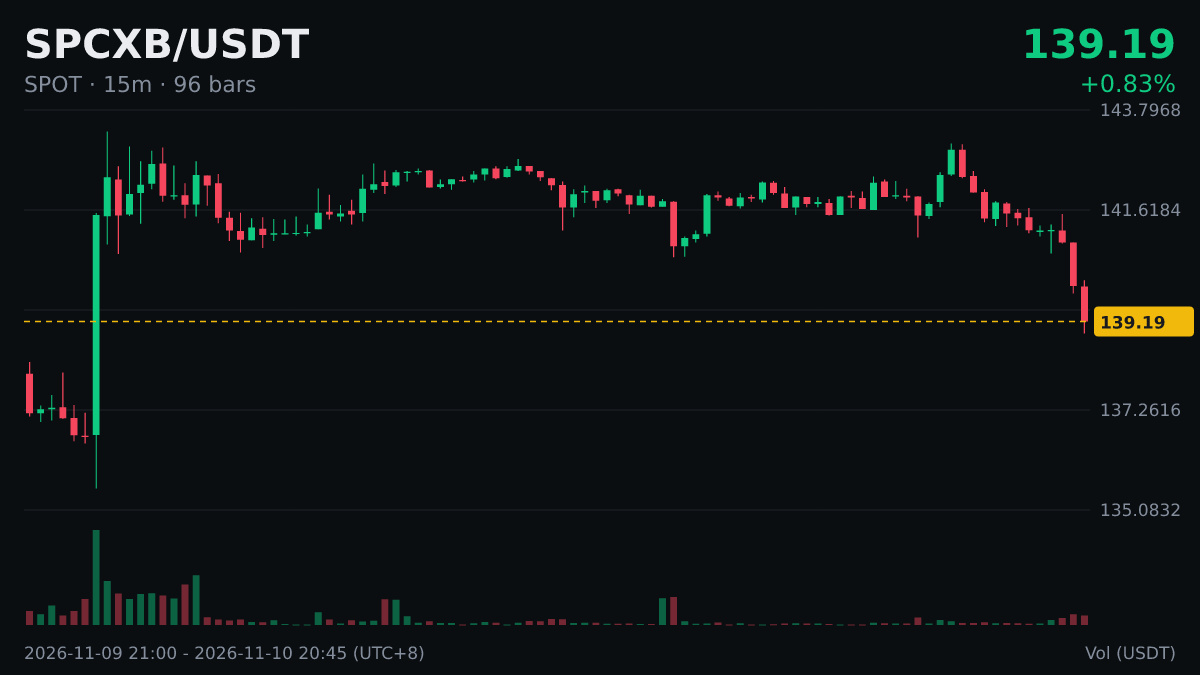
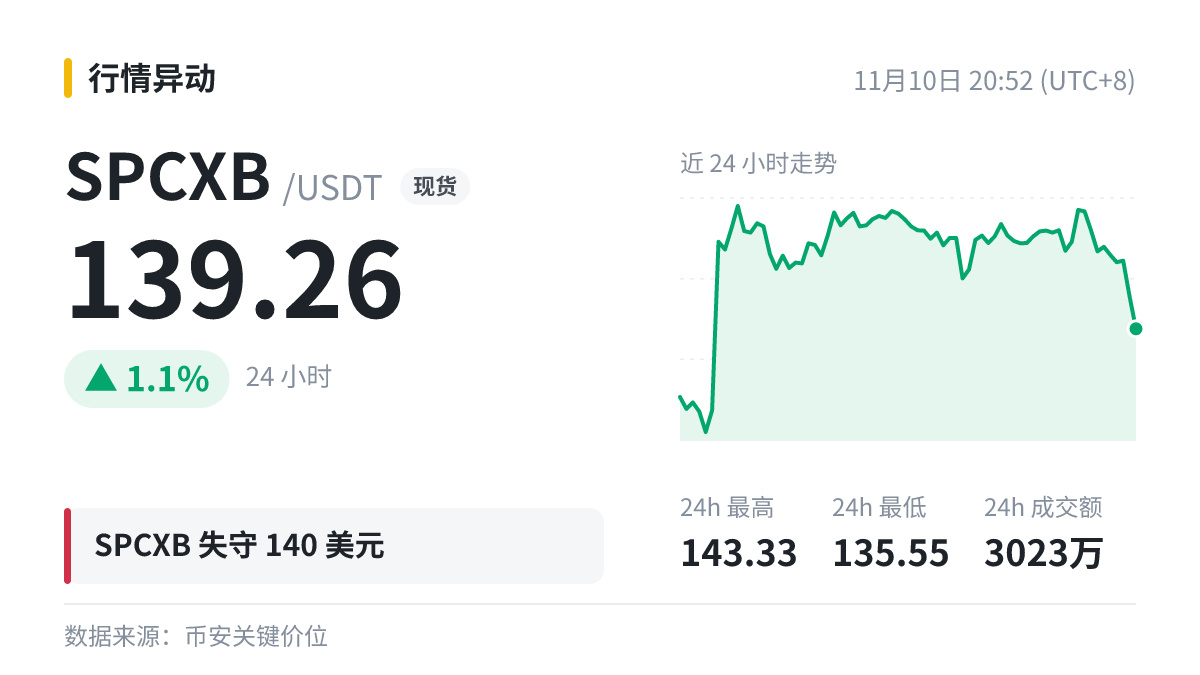
$SPCXB |失守 140 关口
看仓位之前,先搞懂整数关口。
前高与前低是比较常用的关键价位:上次在这里被挡回来或跌不下去的记忆,往往会影响再次来到这一位置时的决策。
突破后的第一次回踩往往被看作试金石:如果能在关口附近站住,压力转为支撑的说法就更成立。
合约仓位多留保证金,别让一根插针直接把仓位清出局。
#SPCXB
$SPCXB |失守 140 关口
看仓位之前,先搞懂整数关口。
前高与前低是比较常用的关键价位:上次在这里被挡回来或跌不下去的记忆,往往会影响再次来到这一位置时的决策。
突破后的第一次回踩往往被看作试金石:如果能在关口附近站住,压力转为支撑的说法就更成立。
合约仓位多留保证金,别让一根插针直接把仓位清出局。
#SPCXB
看仓位之前,先搞懂整数关口。
前高与前低是比较常用的关键价位:上次在这里被挡回来或跌不下去的记忆,往往会影响再次来到这一位置时的决策。
突破后的第一次回踩往往被看作试金石:如果能在关口附近站住,压力转为支撑的说法就更成立。
合约仓位多留保证金,别让一根插针直接把仓位清出局。
#SPCXB
12


·
--
Can $SPCXB sustain its 2.75% daily gain near the top of its range?
Volume has cooled significantly, dropping to 0.16x the average rate as the price trades at $141.45.
A move past the 143.33 high acts as a conditional breakout trigger, while a slip below the 135.55 low invalidates current momentum.
Will you wait for a confirmed volume breakout above 143.33, or step aside as hourly activity slows?
Tap $SPCXB for the live chart. #SPCXB #BinanceSquare
Can $SPCXB sustain its 2.75% daily gain near the top of its range?
Volume has cooled significantly, dropping to 0.16x the average rate as the price trades at $141.45.
A move past the 143.33 high acts as a conditional breakout trigger, while a slip below the 135.55 low invalidates current momentum.
Will you wait for a confirmed volume breakout above 143.33, or step aside as hourly activity slows?
Tap $SPCXB for the live chart. #SPCXB #BinanceSquare
Volume has cooled significantly, dropping to 0.16x the average rate as the price trades at $141.45.
A move past the 143.33 high acts as a conditional breakout trigger, while a slip below the 135.55 low invalidates current momentum.
Will you wait for a confirmed volume breakout above 143.33, or step aside as hourly activity slows?
Tap $SPCXB for the live chart. #SPCXB #BinanceSquare

SpaceX Tokenized bStocks ($SPCXB ) is trading around $141.45 USD (approximately Rs. 39,180 PKR), consolidating steadily as institutional interest in pre-IPO equity exposure and Real-World Asset (RWA) tokenization continues to expand across major trading venues.
Key Technical Levels & Market Metrics
Support Zones: Immediate technical support rests between $132.00 and $135.00, acting as a strong demand floor where buyers consistently step in. A structural failure below this zone risks a broader retracement toward the $124.00 base level.
Resistance Barriers: Overhead supply and selling pressure are clustered tightly between $148.00 and $152.00. A volume-backed breakout above this range is required to open a clear technical path toward retesting mid-term high targets near $165.00+.
Volume & Fundamental Context: Daily trading turnover remains solid, averaging around $89M to $94M USD, driven by sustained investor appetite for tokenized private equity exposure and broader RWA market adoption.
$SPCXB
#spcxb #BitcoinFiveWeeklyLosses #CPITestsDecemberRateOutlook #NvidiaInvestigatesAfterHuang’sAffairApology #AnthropicRejectsIPODelayValuationinQuestion
{spot}(SPCXBUSDT)
SpaceX Tokenized bStocks ($SPCXB ) is trading around $141.45 USD (approximately Rs. 39,180 PKR), consolidating steadily as institutional interest in pre-IPO equity exposure and Real-World Asset (RWA) tokenization continues to expand across major trading venues.
Key Technical Levels & Market Metrics
Support Zones: Immediate technical support rests between $132.00 and $135.00, acting as a strong demand floor where buyers consistently step in. A structural failure below this zone risks a broader retracement toward the $124.00 base level.
Resistance Barriers: Overhead supply and selling pressure are clustered tightly between $148.00 and $152.00. A volume-backed breakout above this range is required to open a clear technical path toward retesting mid-term high targets near $165.00+.
Volume & Fundamental Context: Daily trading turnover remains solid, averaging around $89M to $94M USD, driven by sustained investor appetite for tokenized private equity exposure and broader RWA market adoption.
$SPCXB
#spcxb #BitcoinFiveWeeklyLosses #CPITestsDecemberRateOutlook #NvidiaInvestigatesAfterHuang’sAffairApology #AnthropicRejectsIPODelayValuationinQuestion
Key Technical Levels & Market Metrics
Support Zones: Immediate technical support rests between $132.00 and $135.00, acting as a strong demand floor where buyers consistently step in. A structural failure below this zone risks a broader retracement toward the $124.00 base level.
Resistance Barriers: Overhead supply and selling pressure are clustered tightly between $148.00 and $152.00. A volume-backed breakout above this range is required to open a clear technical path toward retesting mid-term high targets near $165.00+.
Volume & Fundamental Context: Daily trading turnover remains solid, averaging around $89M to $94M USD, driven by sustained investor appetite for tokenized private equity exposure and broader RWA market adoption.
$SPCXB
#spcxb #BitcoinFiveWeeklyLosses #CPITestsDecemberRateOutlook #NvidiaInvestigatesAfterHuang’sAffairApology #AnthropicRejectsIPODelayValuationinQuestion
85

·
--
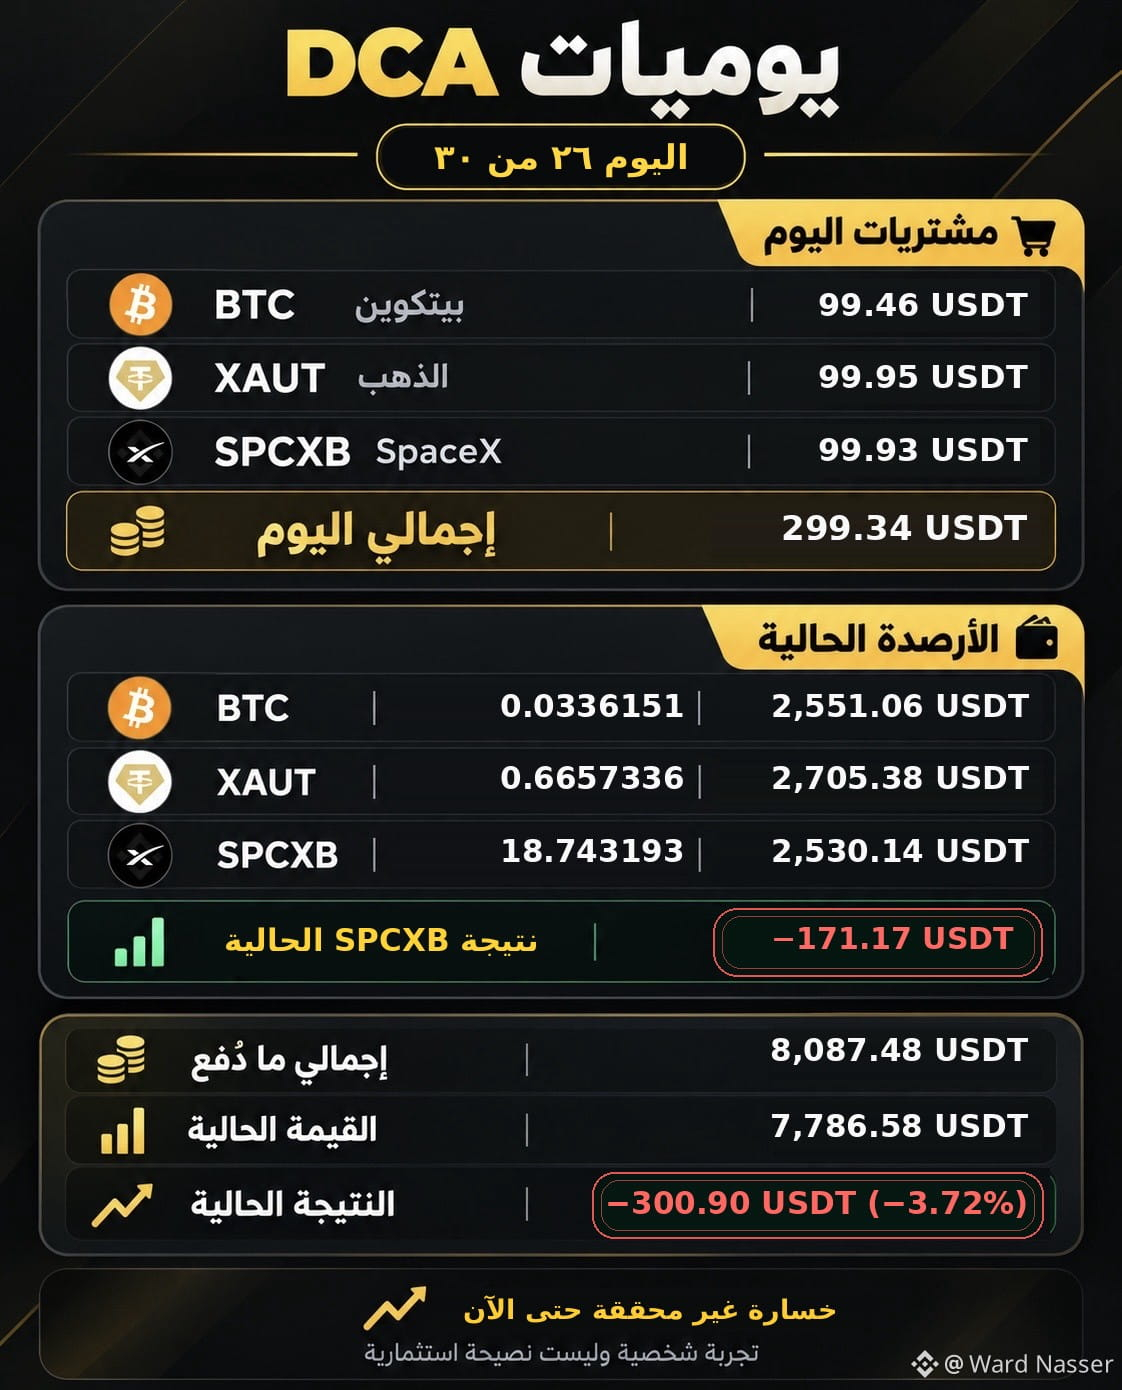
اليوم ٢٦ من ٣٠ في تجربة الاستثمار الدوري 📊
مشتريات اليوم: ₿ بيتكوين: 99.46 USDT 🥇 الذهب الرقمي XAUT: 99.95 USDT 🚀 SPCXB: 99.93 USDT
إجمالي مشتريات اليوم: 299.34 USDT
إجمالي ما دفعته حتى الآن: 8,087.48 USDT القيمة الحالية للمحفظة: 7,786.58 USDT النتيجة الحالية: خسارة غير محققة 300.90 USDT، أي 3.72%−
قيمة SPCXB الحالية أقل من تكلفة شرائه التراكمية بنحو 171.17 USDT.
أواصل توثيق التجربة يومًا بيوم، وهذه أرقام محفظتي وليست توصية استثمارية.
#بيتكوين #الذهب #استثمار #DCA #SPCXB
اليوم ٢٦ من ٣٠ في تجربة الاستثمار الدوري 📊
مشتريات اليوم: ₿ بيتكوين: 99.46 USDT 🥇 الذهب الرقمي XAUT: 99.95 USDT 🚀 SPCXB: 99.93 USDT
إجمالي مشتريات اليوم: 299.34 USDT
إجمالي ما دفعته حتى الآن: 8,087.48 USDT القيمة الحالية للمحفظة: 7,786.58 USDT النتيجة الحالية: خسارة غير محققة 300.90 USDT، أي 3.72%−
قيمة SPCXB الحالية أقل من تكلفة شرائه التراكمية بنحو 171.17 USDT.
أواصل توثيق التجربة يومًا بيوم، وهذه أرقام محفظتي وليست توصية استثمارية.
#بيتكوين #الذهب #استثمار #DCA #SPCXB
مشتريات اليوم: ₿ بيتكوين: 99.46 USDT 🥇 الذهب الرقمي XAUT: 99.95 USDT 🚀 SPCXB: 99.93 USDT
إجمالي مشتريات اليوم: 299.34 USDT
إجمالي ما دفعته حتى الآن: 8,087.48 USDT القيمة الحالية للمحفظة: 7,786.58 USDT النتيجة الحالية: خسارة غير محققة 300.90 USDT، أي 3.72%−
قيمة SPCXB الحالية أقل من تكلفة شرائه التراكمية بنحو 171.17 USDT.
أواصل توثيق التجربة يومًا بيوم، وهذه أرقام محفظتي وليست توصية استثمارية.
#بيتكوين #الذهب #استثمار #DCA #SPCXB
4
203

·
--
Not every crypto opportunity needs hype to get my attention. Sometimes the real story is what a project is building behind the scenes.
I'm keeping $INIT and $SPCXB on my radar. What interests me most is whether their ecosystems can turn attention into genuine usage and long-term demand.
I prefer watching development, adoption, and market behavior rather than chasing every sudden pump. Potential is worth watching, but risk management matters more than excitement. Always do your own research and avoid risking more than you can afford to lose.
Which one has stronger potential in your opinion, $INIT or $SPCXB? Are you holding either one?
#INIT #SPCXB #crypto #BinanceSquare
{future}(INITUSDT)
{spot}(SPCXBUSDT)
Not every crypto opportunity needs hype to get my attention. Sometimes the real story is what a project is building behind the scenes.
I'm keeping $INIT and $SPCXB on my radar. What interests me most is whether their ecosystems can turn attention into genuine usage and long-term demand.
I prefer watching development, adoption, and market behavior rather than chasing every sudden pump. Potential is worth watching, but risk management matters more than excitement. Always do your own research and avoid risking more than you can afford to lose.
Which one has stronger potential in your opinion, $INIT or $SPCXB ? Are you holding either one?
#INIT #SPCXB #crypto #BinanceSquare
I'm keeping $INIT and $SPCXB on my radar. What interests me most is whether their ecosystems can turn attention into genuine usage and long-term demand.
I prefer watching development, adoption, and market behavior rather than chasing every sudden pump. Potential is worth watching, but risk management matters more than excitement. Always do your own research and avoid risking more than you can afford to lose.
Which one has stronger potential in your opinion, $INIT or $SPCXB ? Are you holding either one?
#INIT #SPCXB #crypto #BinanceSquare
$INIT
63%
$SPCXB
37%
30 ඡන්ද • ඡන්දය අවසන්
1.9k
·
--
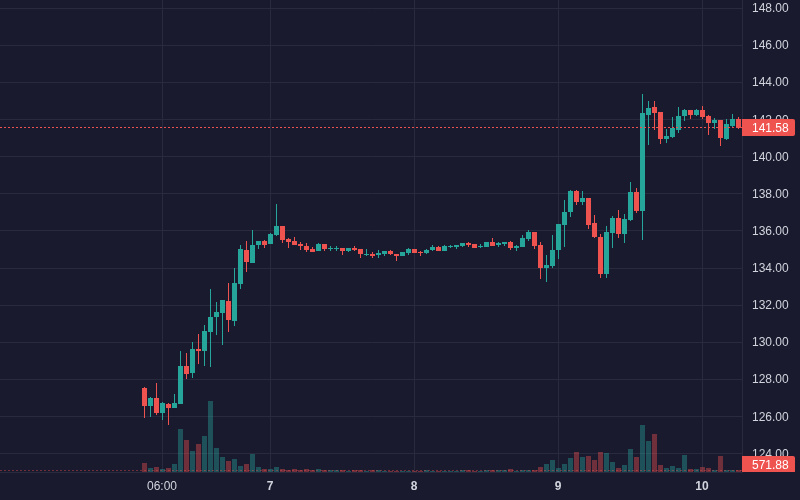
$SPCXB SPCXB is showing bullish movement: 3.63% (Crypto).
Volume: 38.76M | Last: $141.65
Key signals: strong momentum, high trader activity.
Bias Daily: BULLISH 🟢 | Weekly: BULLISH 🟢
SPCXB gained 3.93% over 24h, reaching $141.71, though recent institutional net outflows signal near-term consolidation risks.
**Institutional large order inflow (High)**: Over +$2.42M in large inflows fueled a volume surge past $12.8M → price jumped from $137.08 to $142.49.
- **Dividend eligibility demand (Medium)**: Balance incentives for holdings above 10,000 units stimulated underlying demand.
- **Bullish trend alignment (Low)**: Short-term moving averages held above the 99-period EMA ($136.70) → technical follow-through supported consolidation near $141-$142.
#SPCXB #BinanceSquare #AIChipSlumpNasdaq #NVIDIA #Crypto
$SPCXB SPCXB is showing bullish movement: 3.63% (Crypto).
Volume: 38.76M | Last: $141.65
Key signals: strong momentum, high trader activity.
Bias Daily: BULLISH 🟢 | Weekly: BULLISH 🟢
SPCXB gained 3.93% over 24h, reaching $141.71, though recent institutional net outflows signal near-term consolidation risks.
**Institutional large order inflow (High)**: Over +$2.42M in large inflows fueled a volume surge past $12.8M → price jumped from $137.08 to $142.49.
- **Dividend eligibility demand (Medium)**: Balance incentives for holdings above 10,000 units stimulated underlying demand.
- **Bullish trend alignment (Low)**: Short-term moving averages held above the 99-period EMA ($136.70) → technical follow-through supported consolidation near $141-$142.
#SPCXB #BinanceSquare #AIChipSlumpNasdaq #NVIDIA #Crypto
Volume: 38.76M | Last: $141.65
Key signals: strong momentum, high trader activity.
Bias Daily: BULLISH 🟢 | Weekly: BULLISH 🟢
SPCXB gained 3.93% over 24h, reaching $141.71, though recent institutional net outflows signal near-term consolidation risks.
**Institutional large order inflow (High)**: Over +$2.42M in large inflows fueled a volume surge past $12.8M → price jumped from $137.08 to $142.49.
- **Dividend eligibility demand (Medium)**: Balance incentives for holdings above 10,000 units stimulated underlying demand.
- **Bullish trend alignment (Low)**: Short-term moving averages held above the 99-period EMA ($136.70) → technical follow-through supported consolidation near $141-$142.
#SPCXB #BinanceSquare #AIChipSlumpNasdaq #NVIDIA #Crypto
42
·
--
Volume for $SPCXB sits at $42.26M, with hourly turnover running 1.21x above the daily average.
The asset trades at $141.27, following a 2.73% daily gain and a recent 23-hour span bounded by 133.51 and 143.33. This combination of higher hourly participation within an established range points to active market re-evaluation.
As a conditional watch scenario, sustained holding above the mid-range could invite tests toward 143.33. Conversely, dropping beneath 133.51 would invalidate this structure and signal fading buyer interest.
Will rising volume confirm a push past 143.33, or does a drop below 133.51 invalidate the setup?
Tap $SPCXB for the live chart. #SPCXB #BinanceSquare
Volume for $SPCXB sits at $42.26M, with hourly turnover running 1.21x above the daily average.
The asset trades at $141.27, following a 2.73% daily gain and a recent 23-hour span bounded by 133.51 and 143.33. This combination of higher hourly participation within an established range points to active market re-evaluation.
As a conditional watch scenario, sustained holding above the mid-range could invite tests toward 143.33. Conversely, dropping beneath 133.51 would invalidate this structure and signal fading buyer interest.
Will rising volume confirm a push past 143.33, or does a drop below 133.51 invalidate the setup?
Tap $SPCXB for the live chart. #SPCXB #BinanceSquare
The asset trades at $141.27, following a 2.73% daily gain and a recent 23-hour span bounded by 133.51 and 143.33. This combination of higher hourly participation within an established range points to active market re-evaluation.
As a conditional watch scenario, sustained holding above the mid-range could invite tests toward 143.33. Conversely, dropping beneath 133.51 would invalidate this structure and signal fading buyer interest.
Will rising volume confirm a push past 143.33, or does a drop below 133.51 invalidate the setup?
Tap $SPCXB for the live chart. #SPCXB #BinanceSquare
1
·
--
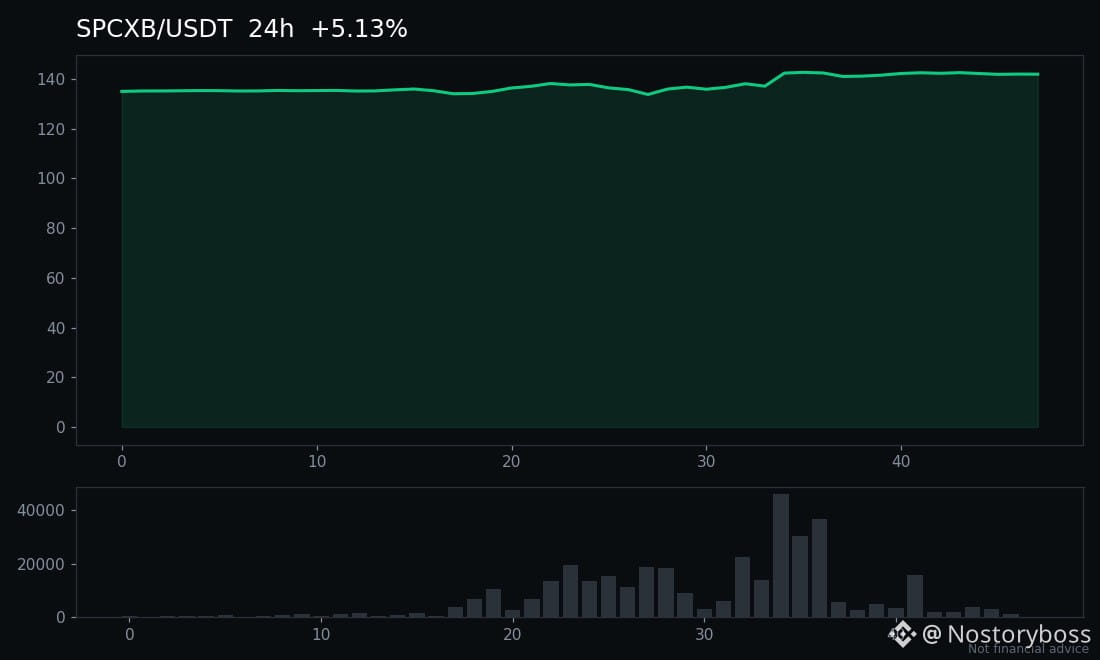
$SPCXB is holding its ground at $141.89, up 2.75% in the last 24 hours on $43.2M of volume. That is not a spike driven by a single burst of buying — the tape shows steady participation through the day, which tells you traders are still happy to own it at these levels rather than chasing a headline. The next thing to watch is whether buyers defend this zone if the wider market turns choppy again. A clean hold keeps the momentum story alive; a slip under it and the tone changes fast. Volume is the tell here. #BinanceSquare #SPCXB #CryptoMarkets
Not financial advice.
$SPCXB is holding its ground at $141.89, up 2.75% in the last 24 hours on $43.2M of volume. That is not a spike driven by a single burst of buying — the tape shows steady participation through the day, which tells you traders are still happy to own it at these levels rather than chasing a headline. The next thing to watch is whether buyers defend this zone if the wider market turns choppy again. A clean hold keeps the momentum story alive; a slip under it and the tone changes fast. Volume is the tell here. #BinanceSquare #SPCXB #CryptoMarkets
Not financial advice.
Not financial advice.
47
තවත් අන්තර්ගතයන් ගවේෂණය කිරීමට ඇතුල් වන්න
Binance චතුරශ්රය හි ගෝලීය ක්රිප්ටෝ පරිශීලකයින් හා එක්වන්න
⚡️ ක්රිප්ටෝ පිළිබඳ නවතම සහ ප්රයෝජනවත් තොරතුරු ලබා ගන්න.
💬 ලොව විශාලතම ක්රිප්ටෝ හුවමාරුව මගින් විශ්වාස කෙරේ.
👍 සත්යායනය කරන ලද නිර්මාණකරුවන්ගෙන් සැබෑ විදසුන් සොයා ගන්න.
විද්යුත් තැපෑල / දුරකථන අංකය
නැගී එන මාතෘකා
1
#HotCPIDecemberHikePriced
153,639 නැරඹීම්
1,713 සාකච්ඡා කරමින්
2
#StrategyFaces$2.8BSelloffRiskFromMSCIRemoval
624 නැරඹීම්
10 සාකච්ඡා කරමින්
3
#AnthropicRejectsIPODelayValuationinQuestion
263,382 නැරඹීම්
2,236 සාකච්ඡා කරමින්
4
#CanNvidiaEarningsEaseMarketConcerns?
55,984 නැරඹීම්
774 සාකච්ඡා කරමින්
5
#BitcoinFiveWeeklyLosses
610,053 නැරඹීම්
3,760 සාකච්ඡා කරමින්
6
#JapanFSAStudyGroupDiscussesDeFiRegulation
0 නැරඹීම්
3 සාකච්ඡා කරමින්
7
#DeutscheBankLaunchesDigitalAssetCustodyForBTCETH
653 නැරඹීම්
19 සාකච්ඡා කරමින්
8
#TrumpMediaAdds1510BTCInQ3
30,483 නැරඹීම්
278 සාකච්ඡා කරමින්
9
#TradFiForBeginners
451,668 නැරඹීම්
2,984 සාකච්ඡා කරමින්
10
#NvidiaInvestigatesAfterHuang’sAffairApology
563,855 නැරඹීම්
3,352 සාකච්ඡා කරමින්