

#liquidationmap
liquidationmap
397,639 views
823 සාකච්ඡා කරමින්
උණුසුම්
නවතම

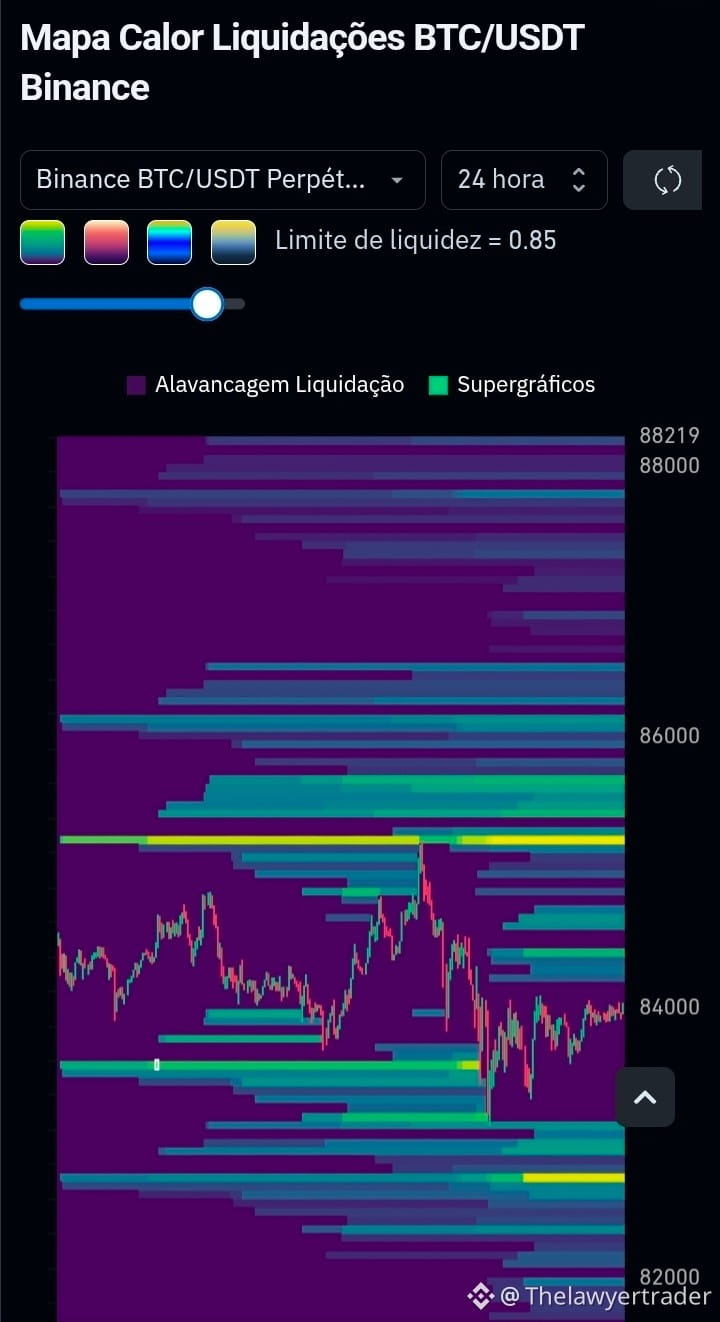
BTC/USDT — Análise de Liquidez (24h)
O preço segue consolidado na faixa dos 84.000, preso entre duas zonas de liquidez relevantes.
Zonas de interesse:
Resistência: ~85.000 – 85.500 (liquidez densa acima do preço)
Suporte: ~83.000 (acúmulo de ordens abaixo)
Leitura do gráfico:
Não há padrão gráfico clássico (triângulo, cabeçalho-ombros) claramente formado. O que se observa é uma consolidação entre zonas de liquidez, comportamento comum antes de definir direção.
Probabilidade (estimativa):
Teste da zona de 85.000 antes de direção clara: alta (~65%)
Rompimento sustentado acima de 85.500: moderada (~40%)
Perda do suporte de 83.000: baixa-moderada (~30%)
Conclusão:
O mercado tende a "buscar" a liquidez acumulada. O cenário mais provável é um teste da resistência de 85.000, com decisão de direção após esse movimento. Aguardar confirmação de volume antes de posicionar.
⚠️ Análise informativa, não é recomendação de investimento. Criptoativos são voláteis.
#liquidationmap #liquidez
BTC/USDT — Análise de Liquidez (24h)
O preço segue consolidado na faixa dos 84.000, preso entre duas zonas de liquidez relevantes.
Zonas de interesse:
Resistência: ~85.000 – 85.500 (liquidez densa acima do preço)
Suporte: ~83.000 (acúmulo de ordens abaixo)
Leitura do gráfico:
Não há padrão gráfico clássico (triângulo, cabeçalho-ombros) claramente formado. O que se observa é uma consolidação entre zonas de liquidez, comportamento comum antes de definir direção.
Probabilidade (estimativa):
Teste da zona de 85.000 antes de direção clara: alta (~65%)
Rompimento sustentado acima de 85.500: moderada (~40%)
Perda do suporte de 83.000: baixa-moderada (~30%)
Conclusão:
O mercado tende a "buscar" a liquidez acumulada. O cenário mais provável é um teste da resistência de 85.000, com decisão de direção após esse movimento. Aguardar confirmação de volume antes de posicionar.
⚠️ Análise informativa, não é recomendação de investimento. Criptoativos são voláteis.
#liquidationmap #liquidez
O preço segue consolidado na faixa dos 84.000, preso entre duas zonas de liquidez relevantes.
Zonas de interesse:
Resistência: ~85.000 – 85.500 (liquidez densa acima do preço)
Suporte: ~83.000 (acúmulo de ordens abaixo)
Leitura do gráfico:
Não há padrão gráfico clássico (triângulo, cabeçalho-ombros) claramente formado. O que se observa é uma consolidação entre zonas de liquidez, comportamento comum antes de definir direção.
Probabilidade (estimativa):
Teste da zona de 85.000 antes de direção clara: alta (~65%)
Rompimento sustentado acima de 85.500: moderada (~40%)
Perda do suporte de 83.000: baixa-moderada (~30%)
Conclusão:
O mercado tende a "buscar" a liquidez acumulada. O cenário mais provável é um teste da resistência de 85.000, com decisão de direção após esse movimento. Aguardar confirmação de volume antes de posicionar.
⚠️ Análise informativa, não é recomendação de investimento. Criptoativos são voláteis.
#liquidationmap #liquidez
Giovanna Truden xNFM:
Bitcoin irá cair aos 71 K
2
236

·
--
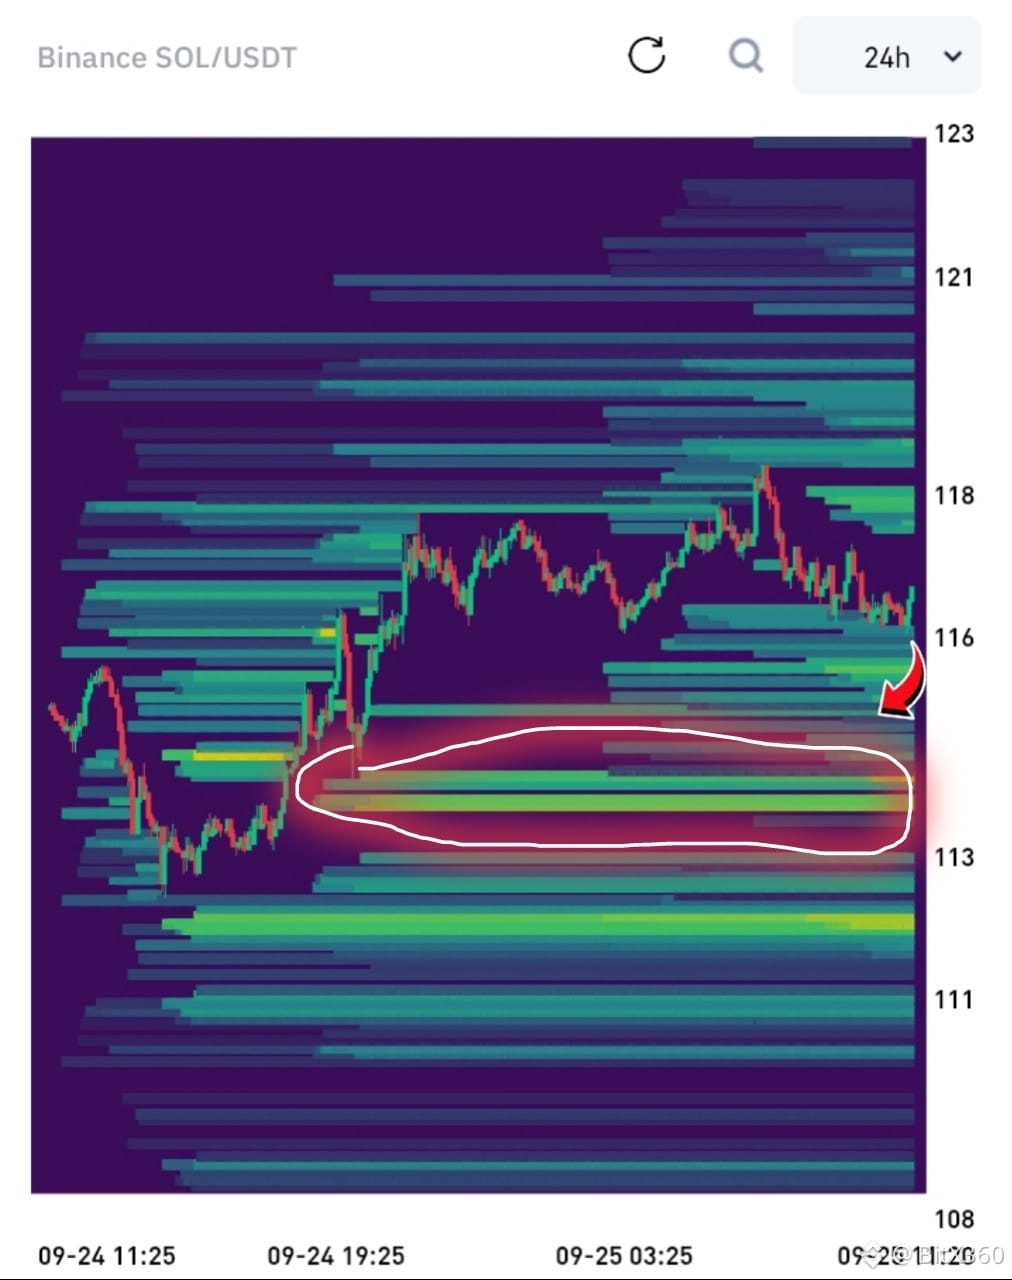
$SOL liquidation map just exposed everything The heaviest liquidity is sitting at 113-115 This is the biggest long liquidation zone If price drops into this area, a large number of long positions will get wiped out There’s also short liquidity stacked between 118-121
But the real density and intensity is clearly below
Two paths left:
Either hunt the longs below
Or push up and liquidate the shorts
The market is about to decide
{future}(SOLUSDT)
#SOL #LiquidationMap #Crypto
$SOL liquidation map just exposed everything The heaviest liquidity is sitting at 113-115 This is the biggest long liquidation zone If price drops into this area, a large number of long positions will get wiped out There’s also short liquidity stacked between 118-121
But the real density and intensity is clearly below
Two paths left:
Either hunt the longs below
Or push up and liquidate the shorts
The market is about to decide
#SOL #LiquidationMap #Crypto
But the real density and intensity is clearly below
Two paths left:
Either hunt the longs below
Or push up and liquidate the shorts
The market is about to decide
#SOL #LiquidationMap #Crypto
3
206

💣$BTC
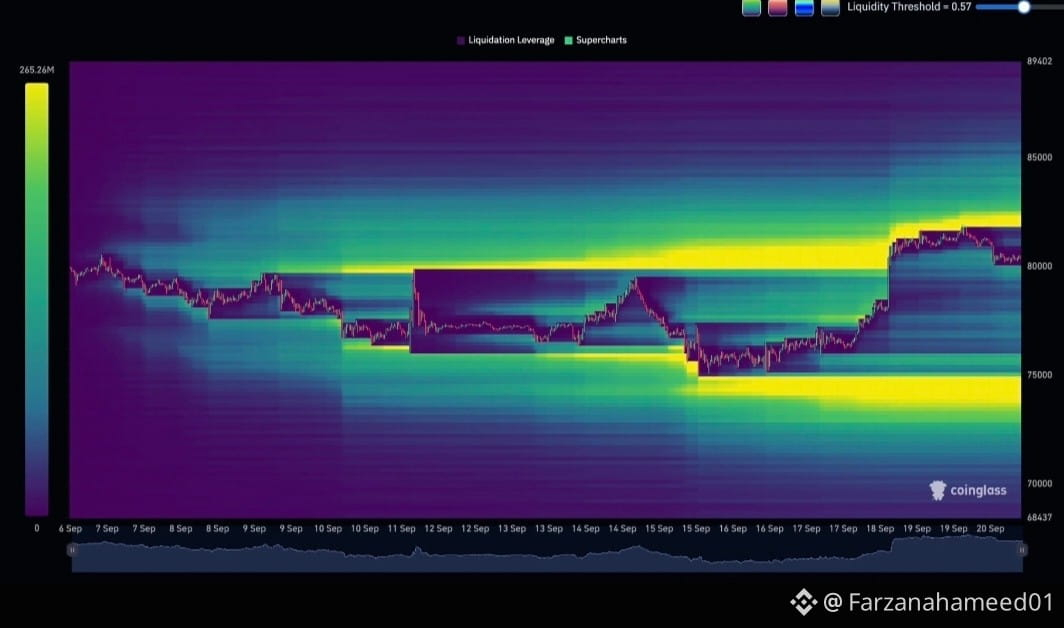
BTC LIQUIDATION TRAP ACTIVATED! $75K or $83K First? 👀
The BTC Liquidation Heatmap is showing massive liquidity on both sides!
Heavy yellow zones at $83K (short liquidations) and $75K (long liquidations).
Bitcoin always hunts liquidity. The question is, which side gets hunted first?
My bias: $83K taps first to grab liquidity, then a sharp reversal towards $75K. Pump first, then dump.
What do you think will hit first?
A) $83K
B) $75K
Drop your prediction below 👇
Not Financial Advice.
#BTC #Bitcoin #Crypto #LiquidationMap #cryptotrading
💣$BTC
BTC LIQUIDATION TRAP ACTIVATED! $75K or $83K First? 👀
The BTC Liquidation Heatmap is showing massive liquidity on both sides!
Heavy yellow zones at $83K (short liquidations) and $75K (long liquidations).
Bitcoin always hunts liquidity. The question is, which side gets hunted first?
My bias: $83K taps first to grab liquidity, then a sharp reversal towards $75K. Pump first, then dump.
What do you think will hit first?
A) $83K
B) $75K
Drop your prediction below 👇
Not Financial Advice.
#BTC #Bitcoin #Crypto #LiquidationMap #cryptotrading
BTC LIQUIDATION TRAP ACTIVATED! $75K or $83K First? 👀
The BTC Liquidation Heatmap is showing massive liquidity on both sides!
Heavy yellow zones at $83K (short liquidations) and $75K (long liquidations).
Bitcoin always hunts liquidity. The question is, which side gets hunted first?
My bias: $83K taps first to grab liquidity, then a sharp reversal towards $75K. Pump first, then dump.
What do you think will hit first?
A) $83K
B) $75K
Drop your prediction below 👇
Not Financial Advice.
#BTC #Bitcoin #Crypto #LiquidationMap #cryptotrading
1
1
108

#liquidationmap
🚀 $BTC /USDT Market Analysis: What is the Market Maker Planning?
A very interesting setup is currently forming on the $BTC charts. On one hand, we see solid consolidation; on the other, the liquidation map is practically flashing "appetizing pools" for big players.
📊 What do the metrics show?
Technical picture: The price is squeezed within the $76,000 – $77,200 range. Moving averages (EMA 5/10/30) are tightly coiled—a classic sign of building momentum before a breakout.
Open Interest (OI): Holding at high levels (~108K–109K BTC). Traders continue to build positions in both directions, bracing for a breakout.
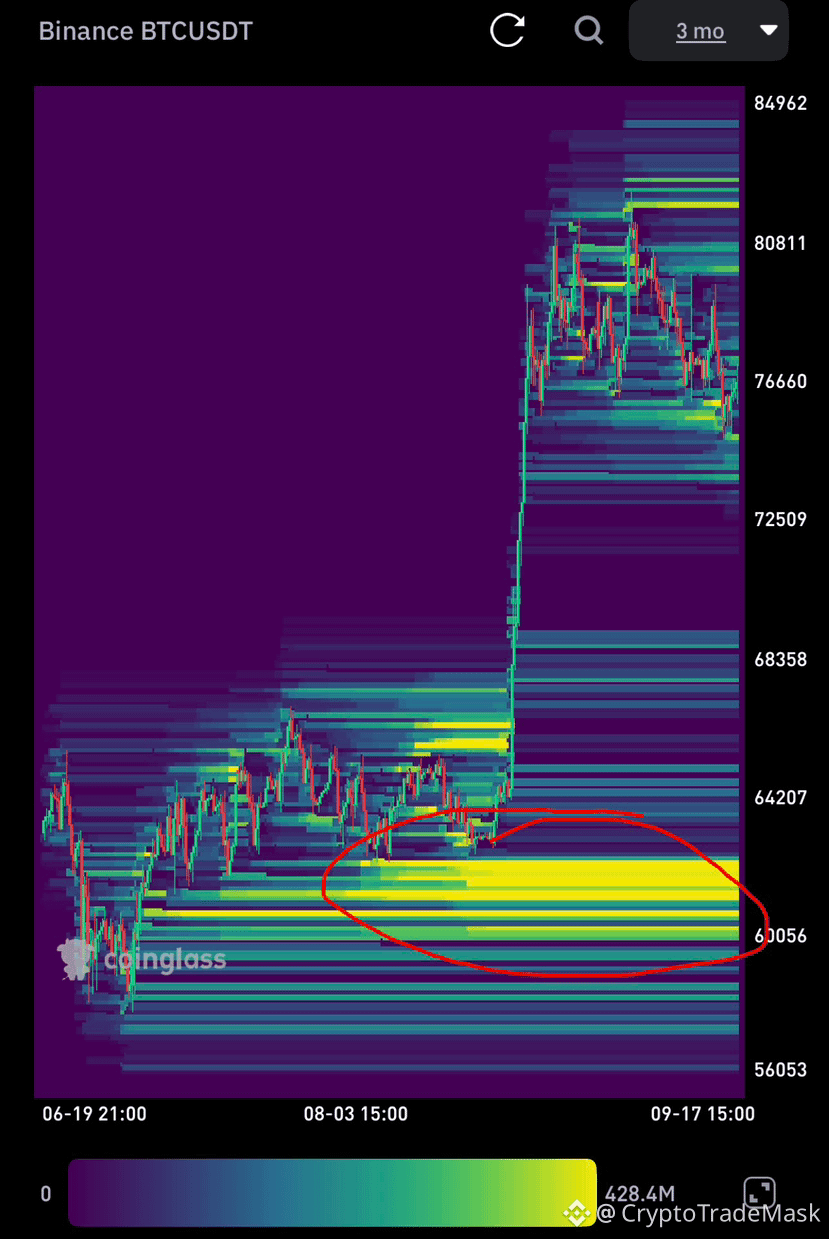
Liquidation Map (Heatmap):
Upside: The $80,000 – $82,000 zone, with a moderate accumulation of short-seller stop-losses.
Downside: A massive "gold mine" cluster at $60,000 – $62,000 (over $400M in liquidity).
🎯 Will the price head toward the lower cluster ($60k)?
Right now—unlikely. A 20% drop requires a powerful fundamental trigger or a cascading sell-off. Market makers prefer the path of least resistance.
Primary scenario:
1. Local liquidity sweep: A quick stop-run in the $74,900 – $75,500 area.
2. Upside breakout: A move to target short positions in the $80,000 – $82,000 range. 3. Global correction: Only after a definitive high is established and retail buyers are lured into long positions at the peak will the market be ready for a deep pullback to the $60,000–$62,000 range.
⚠️ Summary: Do not rush to go "all-in" on a short position expecting $60k right now. Most likely, the market maker will first sweep local highs and only then trigger a massive market flush.
{future}(BTCUSDT)
#liquidationmap
🚀 $BTC /USDT Market Analysis: What is the Market Maker Planning?
A very interesting setup is currently forming on the $BTC charts. On one hand, we see solid consolidation; on the other, the liquidation map is practically flashing "appetizing pools" for big players.
📊 What do the metrics show?
Technical picture: The price is squeezed within the $76,000 – $77,200 range. Moving averages (EMA 5/10/30) are tightly coiled—a classic sign of building momentum before a breakout.
Open Interest (OI): Holding at high levels (~108K–109K BTC). Traders continue to build positions in both directions, bracing for a breakout.
Liquidation Map (Heatmap):
Upside: The $80,000 – $82,000 zone, with a moderate accumulation of short-seller stop-losses.
Downside: A massive "gold mine" cluster at $60,000 – $62,000 (over $400M in liquidity).
🎯 Will the price head toward the lower cluster ($60k)?
Right now—unlikely. A 20% drop requires a powerful fundamental trigger or a cascading sell-off. Market makers prefer the path of least resistance.
Primary scenario:
1. Local liquidity sweep: A quick stop-run in the $74,900 – $75,500 area.
2. Upside breakout: A move to target short positions in the $80,000 – $82,000 range. 3. Global correction: Only after a definitive high is established and retail buyers are lured into long positions at the peak will the market be ready for a deep pullback to the $60,000–$62,000 range.
⚠️ Summary: Do not rush to go "all-in" on a short position expecting $60k right now. Most likely, the market maker will first sweep local highs and only then trigger a massive market flush.
🚀 $BTC /USDT Market Analysis: What is the Market Maker Planning?
A very interesting setup is currently forming on the $BTC charts. On one hand, we see solid consolidation; on the other, the liquidation map is practically flashing "appetizing pools" for big players.
📊 What do the metrics show?
Technical picture: The price is squeezed within the $76,000 – $77,200 range. Moving averages (EMA 5/10/30) are tightly coiled—a classic sign of building momentum before a breakout.
Open Interest (OI): Holding at high levels (~108K–109K BTC). Traders continue to build positions in both directions, bracing for a breakout.
Liquidation Map (Heatmap):
Upside: The $80,000 – $82,000 zone, with a moderate accumulation of short-seller stop-losses.
Downside: A massive "gold mine" cluster at $60,000 – $62,000 (over $400M in liquidity).
🎯 Will the price head toward the lower cluster ($60k)?
Right now—unlikely. A 20% drop requires a powerful fundamental trigger or a cascading sell-off. Market makers prefer the path of least resistance.
Primary scenario:
1. Local liquidity sweep: A quick stop-run in the $74,900 – $75,500 area.
2. Upside breakout: A move to target short positions in the $80,000 – $82,000 range. 3. Global correction: Only after a definitive high is established and retail buyers are lured into long positions at the peak will the market be ready for a deep pullback to the $60,000–$62,000 range.
⚠️ Summary: Do not rush to go "all-in" on a short position expecting $60k right now. Most likely, the market maker will first sweep local highs and only then trigger a massive market flush.
37

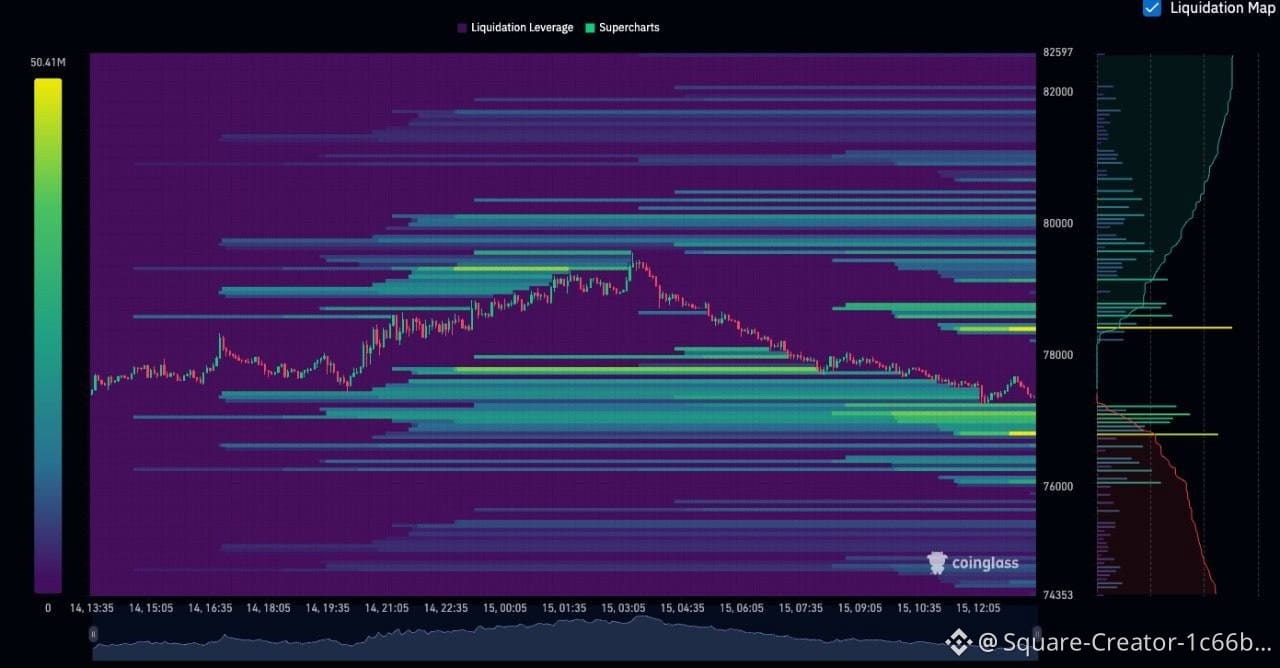
🚨 تحديث خريطة تصفيات بيتكوين (BTC)
يتداول بيتكوين حاليًا قرب 77,000 دولار، مع تركز واضح للسيولة على جانبي السعر.
🔼 السيولة في الاتجاه الصاعد • 78,800 – 79,500 دولار: كتلة سيولة قوية
• فوق 80,000 دولار: سيولة إضافية أعلى السعر
🔽 السيولة في الاتجاه الهابط • 76,500 – 77,000 دولار: منطقة سيولة قريبة ومهمة
• 75,000 – 76,000 دولار: منطقة سيولة أعمق
📌 المستوى المحوري: يحتاج BTC إلى استعادة مستوى 78,000 دولار لدعم تحرك محتمل باتجاه السيولة العلوية. أما إذا تم كسر 76,500 دولار، فقد تزداد احتمالات توجه السعر لاختبار مناطق السيولة السفلية التالية.
⚠️ خريطة التصفية تعكس مناطق محتملة لتجمع السيولة وليست ضمانًا لاتجاه السعر. راقب حجم التداول، الزخم، وحركة السوق العامة قبل اتخاذ أي قرار.
$BTC
{future}(BTCUSDT)
#BTC #Bitcoin #LiquidationMap #Crypto #CryptoTrading #تحليل_فني #بيتكوين #العملات_الرقمية #تداول #سوق_الكريبتو
🚨 تحديث خريطة تصفيات بيتكوين (BTC)
يتداول بيتكوين حاليًا قرب 77,000 دولار، مع تركز واضح للسيولة على جانبي السعر.
🔼 السيولة في الاتجاه الصاعد • 78,800 – 79,500 دولار: كتلة سيولة قوية
• فوق 80,000 دولار: سيولة إضافية أعلى السعر
🔽 السيولة في الاتجاه الهابط • 76,500 – 77,000 دولار: منطقة سيولة قريبة ومهمة
• 75,000 – 76,000 دولار: منطقة سيولة أعمق
📌 المستوى المحوري: يحتاج BTC إلى استعادة مستوى 78,000 دولار لدعم تحرك محتمل باتجاه السيولة العلوية. أما إذا تم كسر 76,500 دولار، فقد تزداد احتمالات توجه السعر لاختبار مناطق السيولة السفلية التالية.
⚠️ خريطة التصفية تعكس مناطق محتملة لتجمع السيولة وليست ضمانًا لاتجاه السعر. راقب حجم التداول، الزخم، وحركة السوق العامة قبل اتخاذ أي قرار.
$BTC
#BTC #Bitcoin #LiquidationMap #Crypto #CryptoTrading #تحليل_فني #بيتكوين #العملات_الرقمية #تداول #سوق_الكريبتو
يتداول بيتكوين حاليًا قرب 77,000 دولار، مع تركز واضح للسيولة على جانبي السعر.
🔼 السيولة في الاتجاه الصاعد • 78,800 – 79,500 دولار: كتلة سيولة قوية
• فوق 80,000 دولار: سيولة إضافية أعلى السعر
🔽 السيولة في الاتجاه الهابط • 76,500 – 77,000 دولار: منطقة سيولة قريبة ومهمة
• 75,000 – 76,000 دولار: منطقة سيولة أعمق
📌 المستوى المحوري: يحتاج BTC إلى استعادة مستوى 78,000 دولار لدعم تحرك محتمل باتجاه السيولة العلوية. أما إذا تم كسر 76,500 دولار، فقد تزداد احتمالات توجه السعر لاختبار مناطق السيولة السفلية التالية.
⚠️ خريطة التصفية تعكس مناطق محتملة لتجمع السيولة وليست ضمانًا لاتجاه السعر. راقب حجم التداول، الزخم، وحركة السوق العامة قبل اتخاذ أي قرار.
$BTC
#BTC #Bitcoin #LiquidationMap #Crypto #CryptoTrading #تحليل_فني #بيتكوين #العملات_الرقمية #تداول #سوق_الكريبتو
95

·
--
උසබ තත්ත්වය
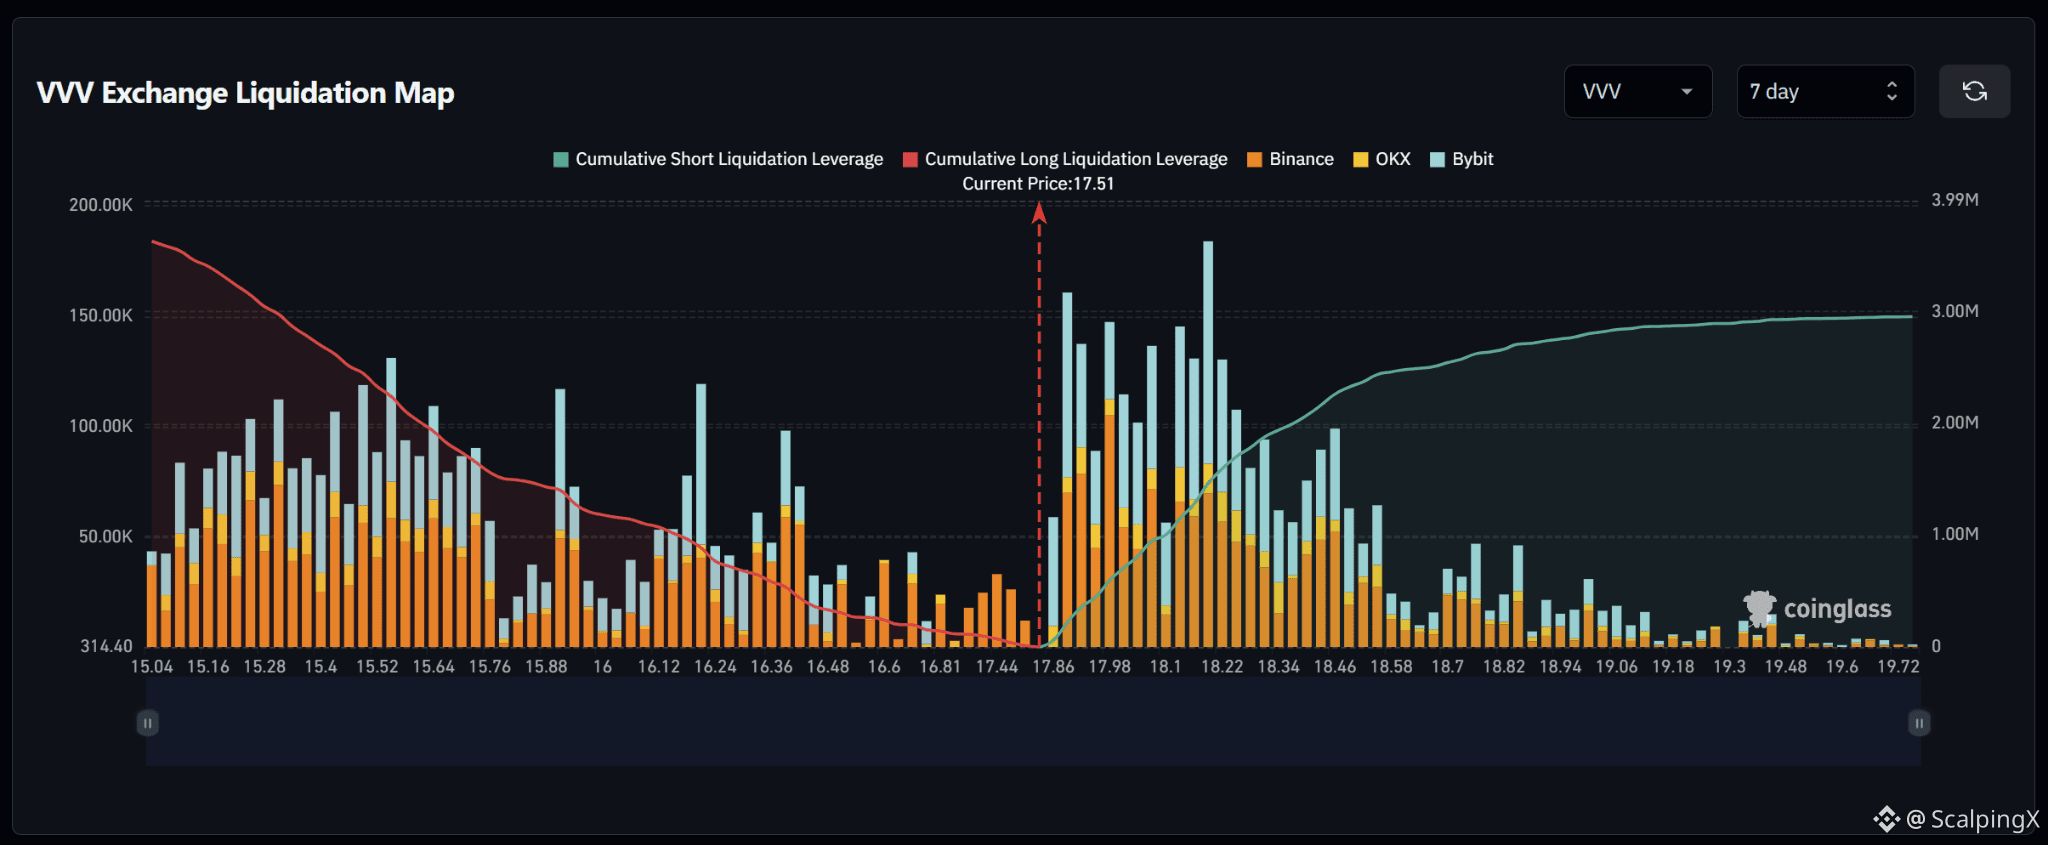
$VVV – Liquidation Map (7 Days) – Current Price 17.51
🔎 The 7-day liquidation map shows roughly $3.6 million in long liquidations below the current price, exceeding approximately $3.0 million in short liquidations above. The liquidity structure is therefore fairly balanced but modestly tilted to the downside, with around 1.2 times more cumulative liquidity below the market.
📉 Below the market, nearby long-liquidation liquidity remains relatively thin around 17.44–16.81 before increasing across 16.60–16.24. Notable clusters appear around 16.36 and 16.24, while liquidity becomes much denser further down across 15.88–15.28. Losing 17.44 would shift attention toward 16.81–16.60.
📈 Above the market, short-liquidation liquidity begins rising sharply from 17.86 and becomes dense across 17.98–18.34. The strongest cluster sits around 18.18–18.22, where the liquidation bar approaches $185,000, while 17.86–18.10 and 18.34–18.46 also contain notable liquidity.
🧭 The broader setup modestly favors the downside because long-liquidation exposure below is larger. Losing 17.44 would increase the probability of a sweep toward 16.81–16.60, while breaking above 17.86 would shift attention toward 17.98–18.22.
#LiquidationMap
$VVV – Liquidation Map (7 Days) – Current Price 17.51
🔎 The 7-day liquidation map shows roughly $3.6 million in long liquidations below the current price, exceeding approximately $3.0 million in short liquidations above. The liquidity structure is therefore fairly balanced but modestly tilted to the downside, with around 1.2 times more cumulative liquidity below the market.
📉 Below the market, nearby long-liquidation liquidity remains relatively thin around 17.44–16.81 before increasing across 16.60–16.24. Notable clusters appear around 16.36 and 16.24, while liquidity becomes much denser further down across 15.88–15.28. Losing 17.44 would shift attention toward 16.81–16.60.
📈 Above the market, short-liquidation liquidity begins rising sharply from 17.86 and becomes dense across 17.98–18.34. The strongest cluster sits around 18.18–18.22, where the liquidation bar approaches $185,000, while 17.86–18.10 and 18.34–18.46 also contain notable liquidity.
🧭 The broader setup modestly favors the downside because long-liquidation exposure below is larger. Losing 17.44 would increase the probability of a sweep toward 16.81–16.60, while breaking above 17.86 would shift attention toward 17.98–18.22.
#LiquidationMap
🔎 The 7-day liquidation map shows roughly $3.6 million in long liquidations below the current price, exceeding approximately $3.0 million in short liquidations above. The liquidity structure is therefore fairly balanced but modestly tilted to the downside, with around 1.2 times more cumulative liquidity below the market.
📉 Below the market, nearby long-liquidation liquidity remains relatively thin around 17.44–16.81 before increasing across 16.60–16.24. Notable clusters appear around 16.36 and 16.24, while liquidity becomes much denser further down across 15.88–15.28. Losing 17.44 would shift attention toward 16.81–16.60.
📈 Above the market, short-liquidation liquidity begins rising sharply from 17.86 and becomes dense across 17.98–18.34. The strongest cluster sits around 18.18–18.22, where the liquidation bar approaches $185,000, while 17.86–18.10 and 18.34–18.46 also contain notable liquidity.
🧭 The broader setup modestly favors the downside because long-liquidation exposure below is larger. Losing 17.44 would increase the probability of a sweep toward 16.81–16.60, while breaking above 17.86 would shift attention toward 17.98–18.22.
#LiquidationMap
90
·
--
උසබ තත්ත්වය
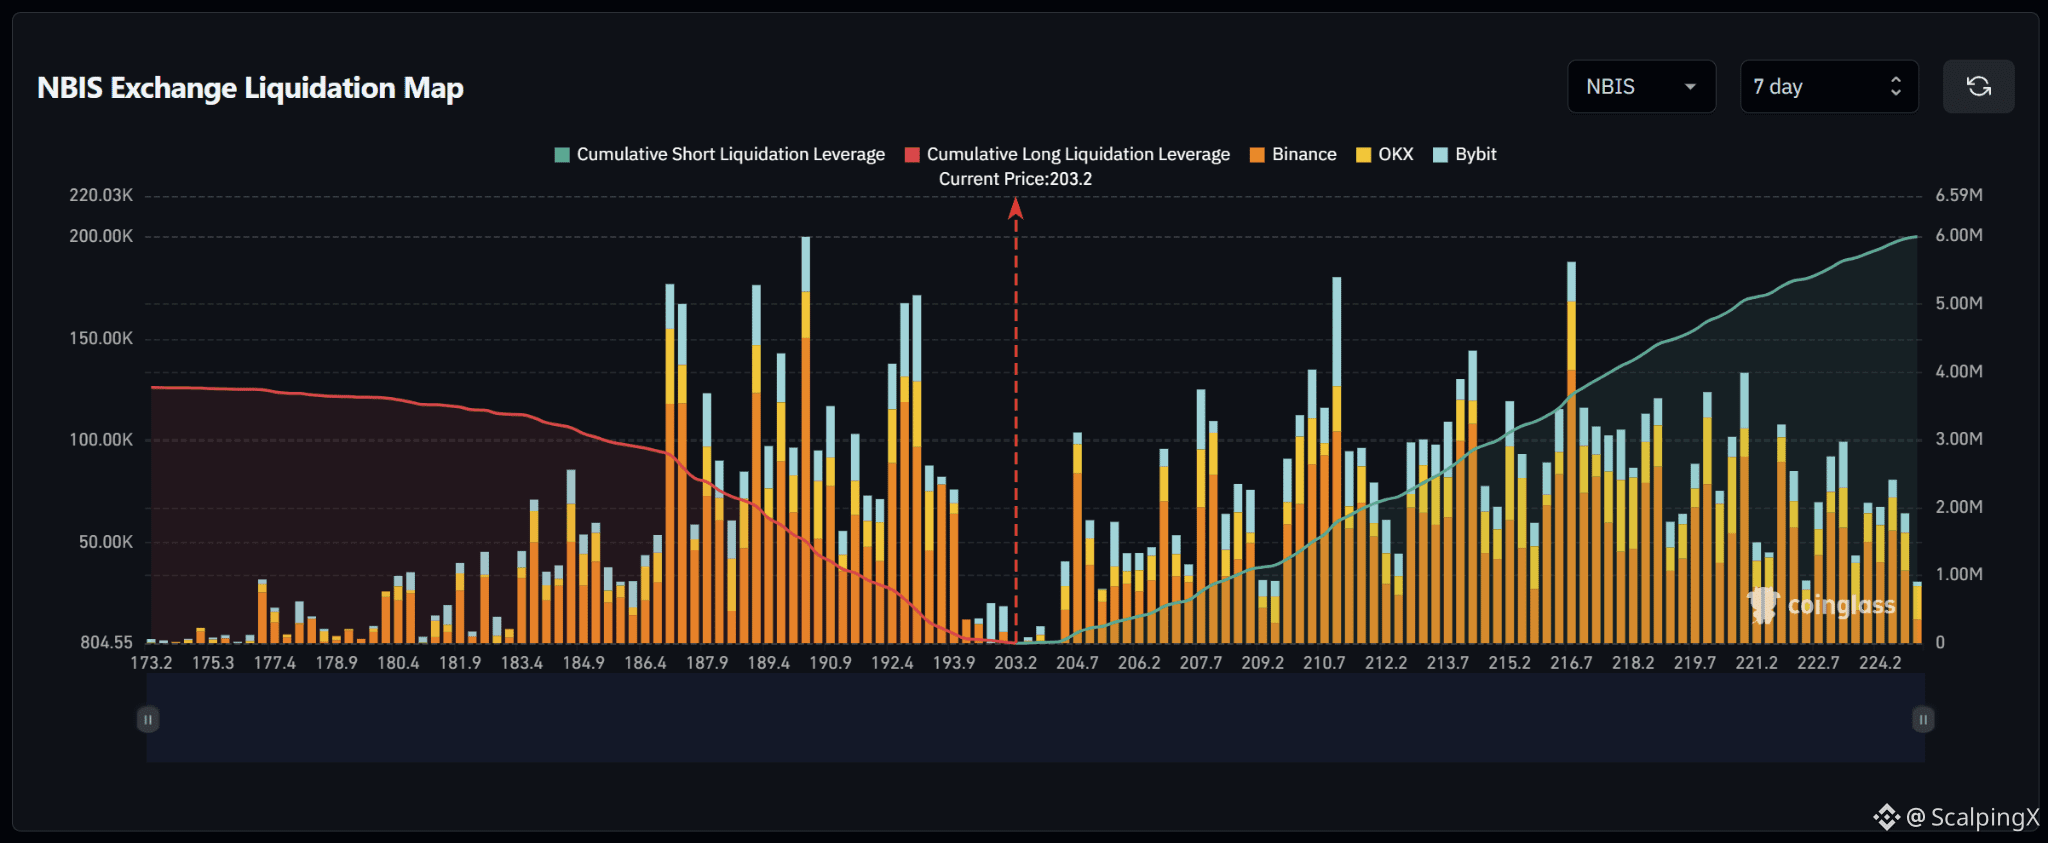
$NBIS – Liquidation Map (7 Days) – Current Price 203.2
🔎 The 7-day liquidation map shows roughly $6 million in short liquidations above the current price, exceeding approximately 4 million in long liquidations below. The liquidity structure therefore favors the upside, with roughly 1.5 times more cumulative liquidity above the market.
📉 Below the market, nearby long-liquidation liquidity remains relatively thin around 193.9–192.4 before increasing sharply across 190.9–186.4. The strongest clusters sit around 190 and 187, with several bars reaching roughly $150,000–200,000. Losing 193.9 would shift attention toward 192.4–190.9.
📈 Above the market, short-liquidation liquidity begins building from 204.7 and increases across 207.7–212.2. A notable cluster near 210.7 reaches almost $180,000. Further out, liquidity remains dense across 213.7–218.2, with the 216.7 area standing out near $190,000.
🧭 The broader setup favors the upside because short-liquidation exposure above is roughly 1.5 times larger. Breaking 204.7 would increase the probability of a sweep toward 207.7–212.2, while losing 193.9 would shift attention toward 192.4–190.9.
#LiquidationMap
$NBIS – Liquidation Map (7 Days) – Current Price 203.2
🔎 The 7-day liquidation map shows roughly $6 million in short liquidations above the current price, exceeding approximately 4 million in long liquidations below. The liquidity structure therefore favors the upside, with roughly 1.5 times more cumulative liquidity above the market.
📉 Below the market, nearby long-liquidation liquidity remains relatively thin around 193.9–192.4 before increasing sharply across 190.9–186.4. The strongest clusters sit around 190 and 187, with several bars reaching roughly $150,000–200,000. Losing 193.9 would shift attention toward 192.4–190.9.
📈 Above the market, short-liquidation liquidity begins building from 204.7 and increases across 207.7–212.2. A notable cluster near 210.7 reaches almost $180,000. Further out, liquidity remains dense across 213.7–218.2, with the 216.7 area standing out near $190,000.
🧭 The broader setup favors the upside because short-liquidation exposure above is roughly 1.5 times larger. Breaking 204.7 would increase the probability of a sweep toward 207.7–212.2, while losing 193.9 would shift attention toward 192.4–190.9.
#LiquidationMap
🔎 The 7-day liquidation map shows roughly $6 million in short liquidations above the current price, exceeding approximately 4 million in long liquidations below. The liquidity structure therefore favors the upside, with roughly 1.5 times more cumulative liquidity above the market.
📉 Below the market, nearby long-liquidation liquidity remains relatively thin around 193.9–192.4 before increasing sharply across 190.9–186.4. The strongest clusters sit around 190 and 187, with several bars reaching roughly $150,000–200,000. Losing 193.9 would shift attention toward 192.4–190.9.
📈 Above the market, short-liquidation liquidity begins building from 204.7 and increases across 207.7–212.2. A notable cluster near 210.7 reaches almost $180,000. Further out, liquidity remains dense across 213.7–218.2, with the 216.7 area standing out near $190,000.
🧭 The broader setup favors the upside because short-liquidation exposure above is roughly 1.5 times larger. Breaking 204.7 would increase the probability of a sweep toward 207.7–212.2, while losing 193.9 would shift attention toward 192.4–190.9.
#LiquidationMap
19
·
--
උසබ තත්ත්වය
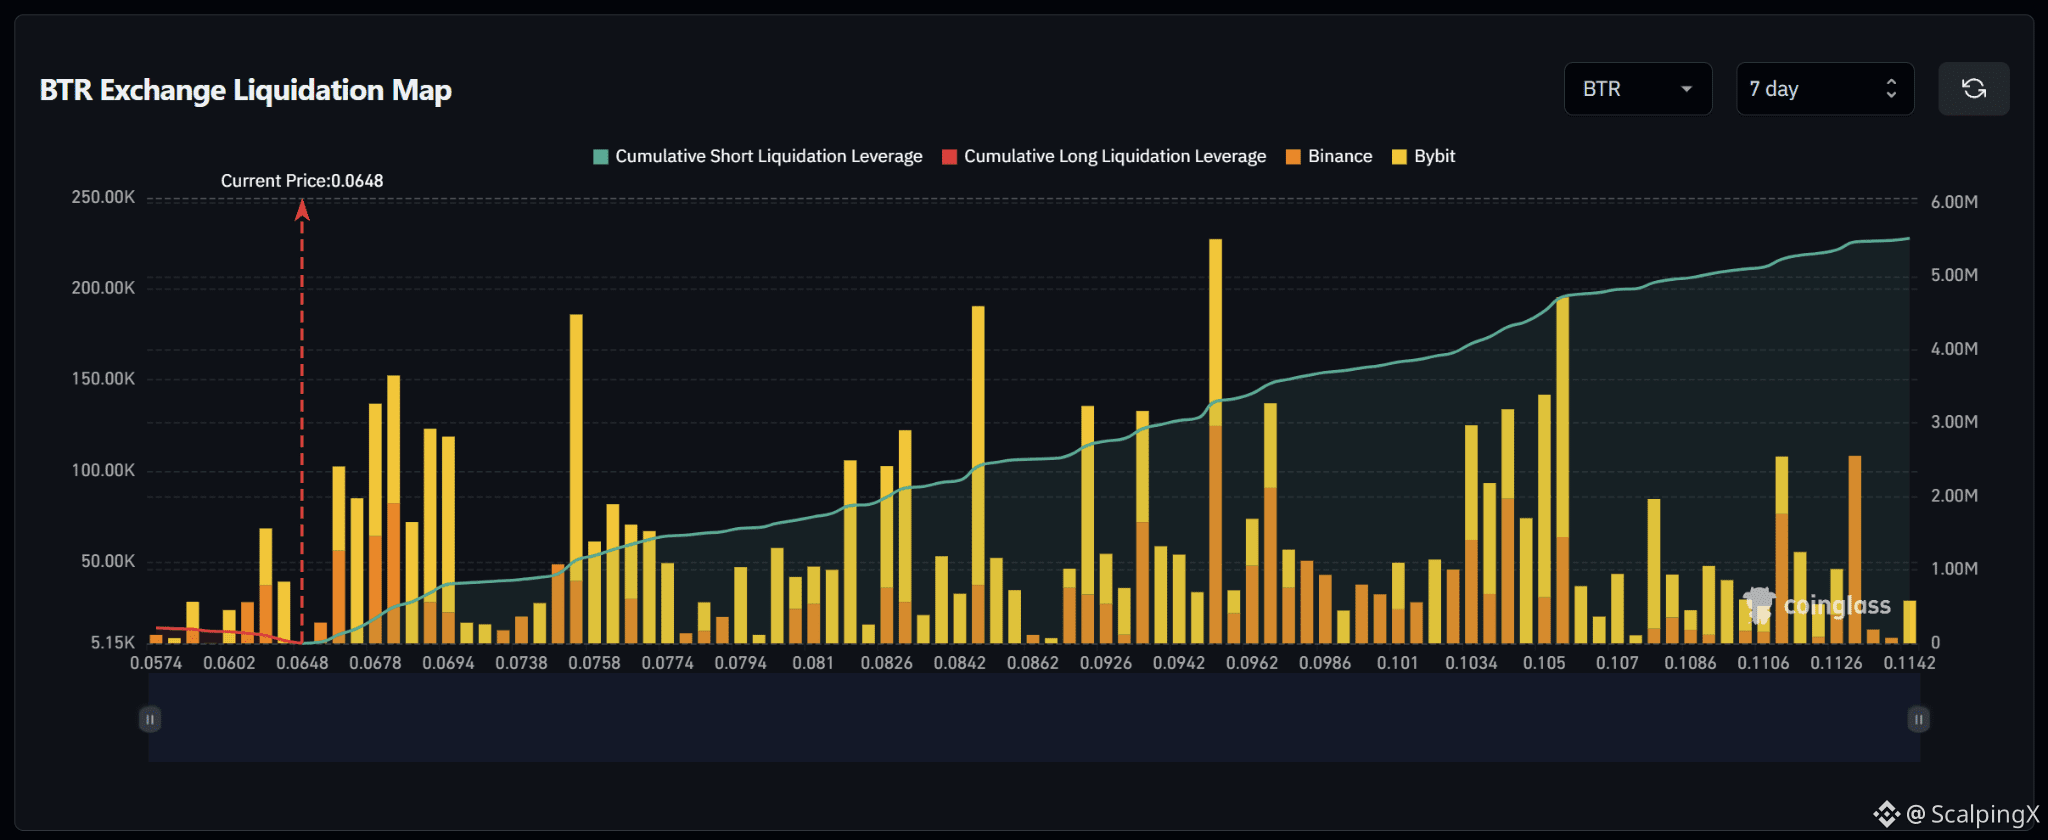
$BTR – Liquidation Map (7 Days) – Current Price 0.0648
🔎 The 7-day liquidation map shows roughly $5.4–5.5 million in short liquidations above the current price, while long-liquidation exposure below is almost negligible as price sits near the lower edge of the displayed range. The liquidity structure therefore strongly favors the upside.
📉 Below the market, remaining long-liquidation liquidity is relatively thin, mainly around 0.0602–0.0574. There are no major liquidation clusters immediately below the current price, suggesting limited downside liquidity attraction within the displayed range.
📈 Above the market, short-liquidation liquidity begins building immediately around 0.0678–0.0694, followed by several large clusters near 0.0758, 0.0842 and especially 0.094–0.096. Further out, 0.1034–0.105 stands out with bars around $140,000–195,000, while 0.1126 also contains a notable cluster.
🧭 The broader setup strongly favors the upside because nearly all significant liquidation liquidity is positioned above the market. Breaking 0.0678 would increase the probability of a sweep toward 0.0694–0.0758; if momentum continues, 0.0842 and 0.094–0.096 would become the next notable liquidity zones.
#LiquidationMap
$BTR – Liquidation Map (7 Days) – Current Price 0.0648
🔎 The 7-day liquidation map shows roughly $5.4–5.5 million in short liquidations above the current price, while long-liquidation exposure below is almost negligible as price sits near the lower edge of the displayed range. The liquidity structure therefore strongly favors the upside.
📉 Below the market, remaining long-liquidation liquidity is relatively thin, mainly around 0.0602–0.0574. There are no major liquidation clusters immediately below the current price, suggesting limited downside liquidity attraction within the displayed range.
📈 Above the market, short-liquidation liquidity begins building immediately around 0.0678–0.0694, followed by several large clusters near 0.0758, 0.0842 and especially 0.094–0.096. Further out, 0.1034–0.105 stands out with bars around $140,000–195,000, while 0.1126 also contains a notable cluster.
🧭 The broader setup strongly favors the upside because nearly all significant liquidation liquidity is positioned above the market. Breaking 0.0678 would increase the probability of a sweep toward 0.0694–0.0758; if momentum continues, 0.0842 and 0.094–0.096 would become the next notable liquidity zones.
#LiquidationMap
🔎 The 7-day liquidation map shows roughly $5.4–5.5 million in short liquidations above the current price, while long-liquidation exposure below is almost negligible as price sits near the lower edge of the displayed range. The liquidity structure therefore strongly favors the upside.
📉 Below the market, remaining long-liquidation liquidity is relatively thin, mainly around 0.0602–0.0574. There are no major liquidation clusters immediately below the current price, suggesting limited downside liquidity attraction within the displayed range.
📈 Above the market, short-liquidation liquidity begins building immediately around 0.0678–0.0694, followed by several large clusters near 0.0758, 0.0842 and especially 0.094–0.096. Further out, 0.1034–0.105 stands out with bars around $140,000–195,000, while 0.1126 also contains a notable cluster.
🧭 The broader setup strongly favors the upside because nearly all significant liquidation liquidity is positioned above the market. Breaking 0.0678 would increase the probability of a sweep toward 0.0694–0.0758; if momentum continues, 0.0842 and 0.094–0.096 would become the next notable liquidity zones.
#LiquidationMap
43
·
--
උසබ තත්ත්වය
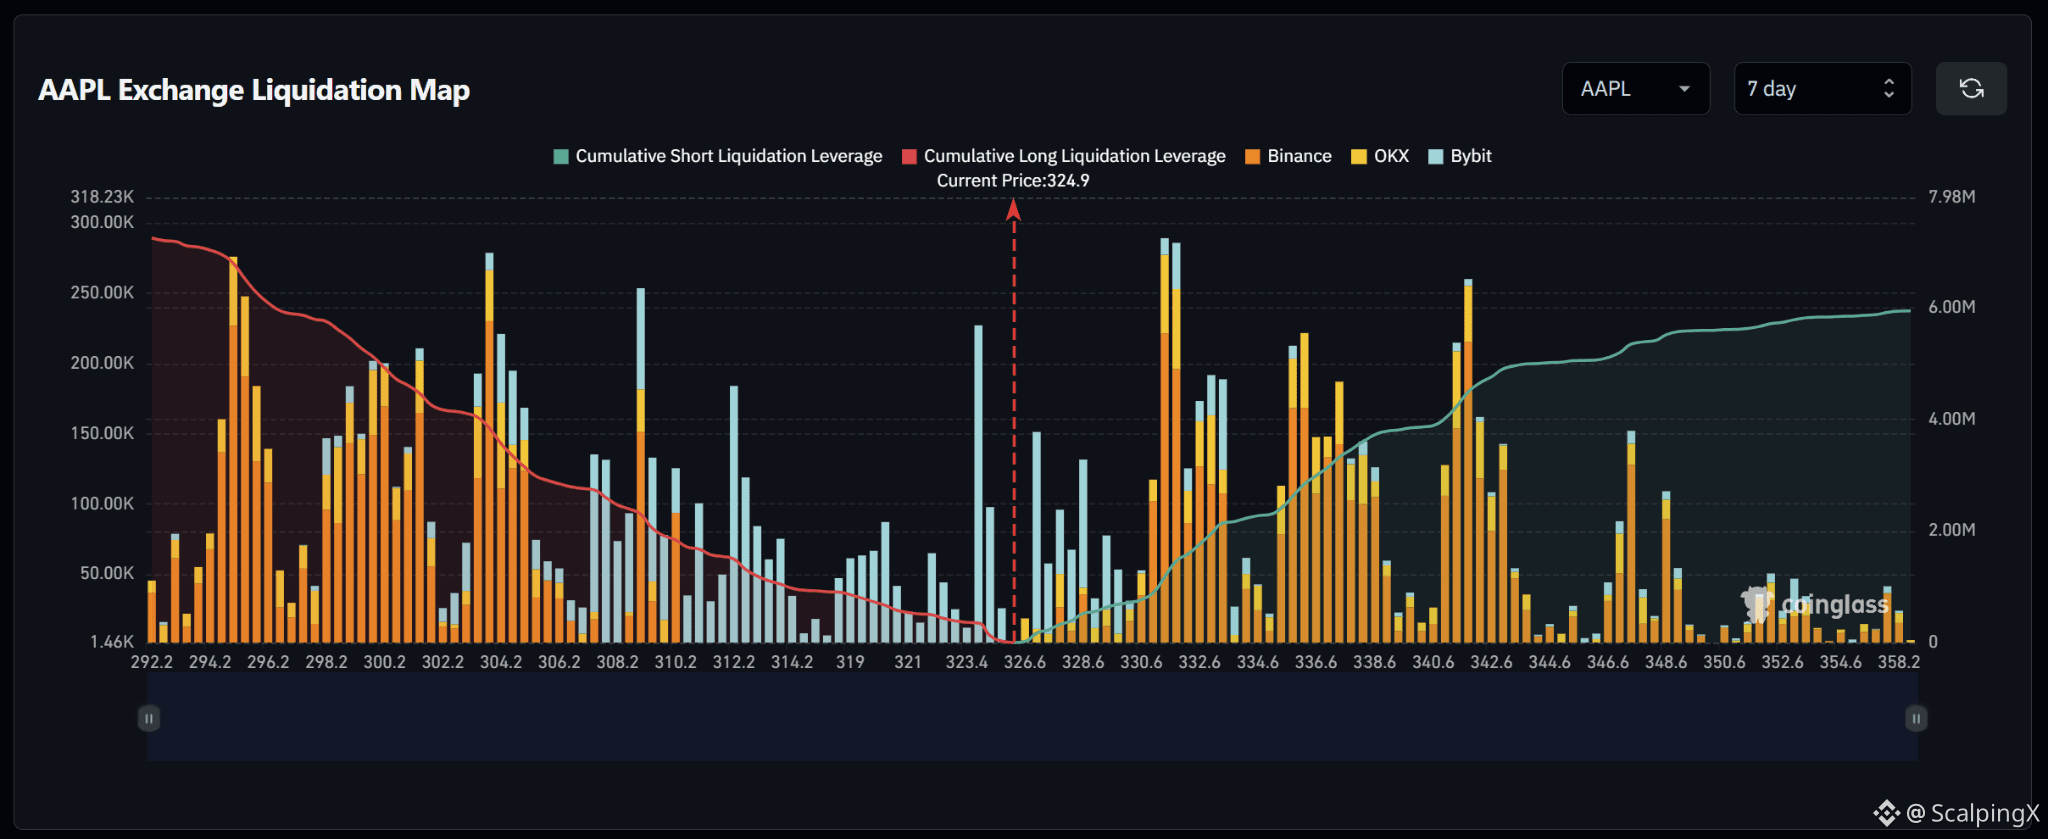
$AAPL – Liquidation Map (7 Days) – Current Price 324.9
🔎 The 7-day liquidation map shows roughly $7 million in long liquidations below the current price, exceeding approximately $6 million in short liquidations above. The overall structure is therefore fairly balanced but modestly tilted to the downside.
📉 Below the market, nearby long-liquidation liquidity is concentrated around 323.4–321.0, with a notable bar near 323.4 exceeding $200,000. Further down, larger clusters appear around 308.2–304.2 and 296.2–294.2, where several bars reach roughly $200,000–280,000. Losing 323.4 would shift attention toward 321.0–319.0.
📈 Above the market, short-liquidation liquidity begins building from around 326.6 and becomes much denser across 330.6–332.6. The strongest cluster near 331–332 approaches $290,000. Further out, 336.6 and 340.6–342.6 also contain notable liquidity.
🧭 The broader setup modestly favors the downside because long-liquidation exposure below is larger. Losing 323.4 would increase the probability of a sweep toward 321.0–319.0, while breaking above 326.6 would shift attention toward 330.6–332.6.
#LiquidationMap
$AAPL – Liquidation Map (7 Days) – Current Price 324.9
🔎 The 7-day liquidation map shows roughly $7 million in long liquidations below the current price, exceeding approximately $6 million in short liquidations above. The overall structure is therefore fairly balanced but modestly tilted to the downside.
📉 Below the market, nearby long-liquidation liquidity is concentrated around 323.4–321.0, with a notable bar near 323.4 exceeding $200,000. Further down, larger clusters appear around 308.2–304.2 and 296.2–294.2, where several bars reach roughly $200,000–280,000. Losing 323.4 would shift attention toward 321.0–319.0.
📈 Above the market, short-liquidation liquidity begins building from around 326.6 and becomes much denser across 330.6–332.6. The strongest cluster near 331–332 approaches $290,000. Further out, 336.6 and 340.6–342.6 also contain notable liquidity.
🧭 The broader setup modestly favors the downside because long-liquidation exposure below is larger. Losing 323.4 would increase the probability of a sweep toward 321.0–319.0, while breaking above 326.6 would shift attention toward 330.6–332.6.
#LiquidationMap
🔎 The 7-day liquidation map shows roughly $7 million in long liquidations below the current price, exceeding approximately $6 million in short liquidations above. The overall structure is therefore fairly balanced but modestly tilted to the downside.
📉 Below the market, nearby long-liquidation liquidity is concentrated around 323.4–321.0, with a notable bar near 323.4 exceeding $200,000. Further down, larger clusters appear around 308.2–304.2 and 296.2–294.2, where several bars reach roughly $200,000–280,000. Losing 323.4 would shift attention toward 321.0–319.0.
📈 Above the market, short-liquidation liquidity begins building from around 326.6 and becomes much denser across 330.6–332.6. The strongest cluster near 331–332 approaches $290,000. Further out, 336.6 and 340.6–342.6 also contain notable liquidity.
🧭 The broader setup modestly favors the downside because long-liquidation exposure below is larger. Losing 323.4 would increase the probability of a sweep toward 321.0–319.0, while breaking above 326.6 would shift attention toward 330.6–332.6.
#LiquidationMap
1
18
·
--
උසබ තත්ත්වය
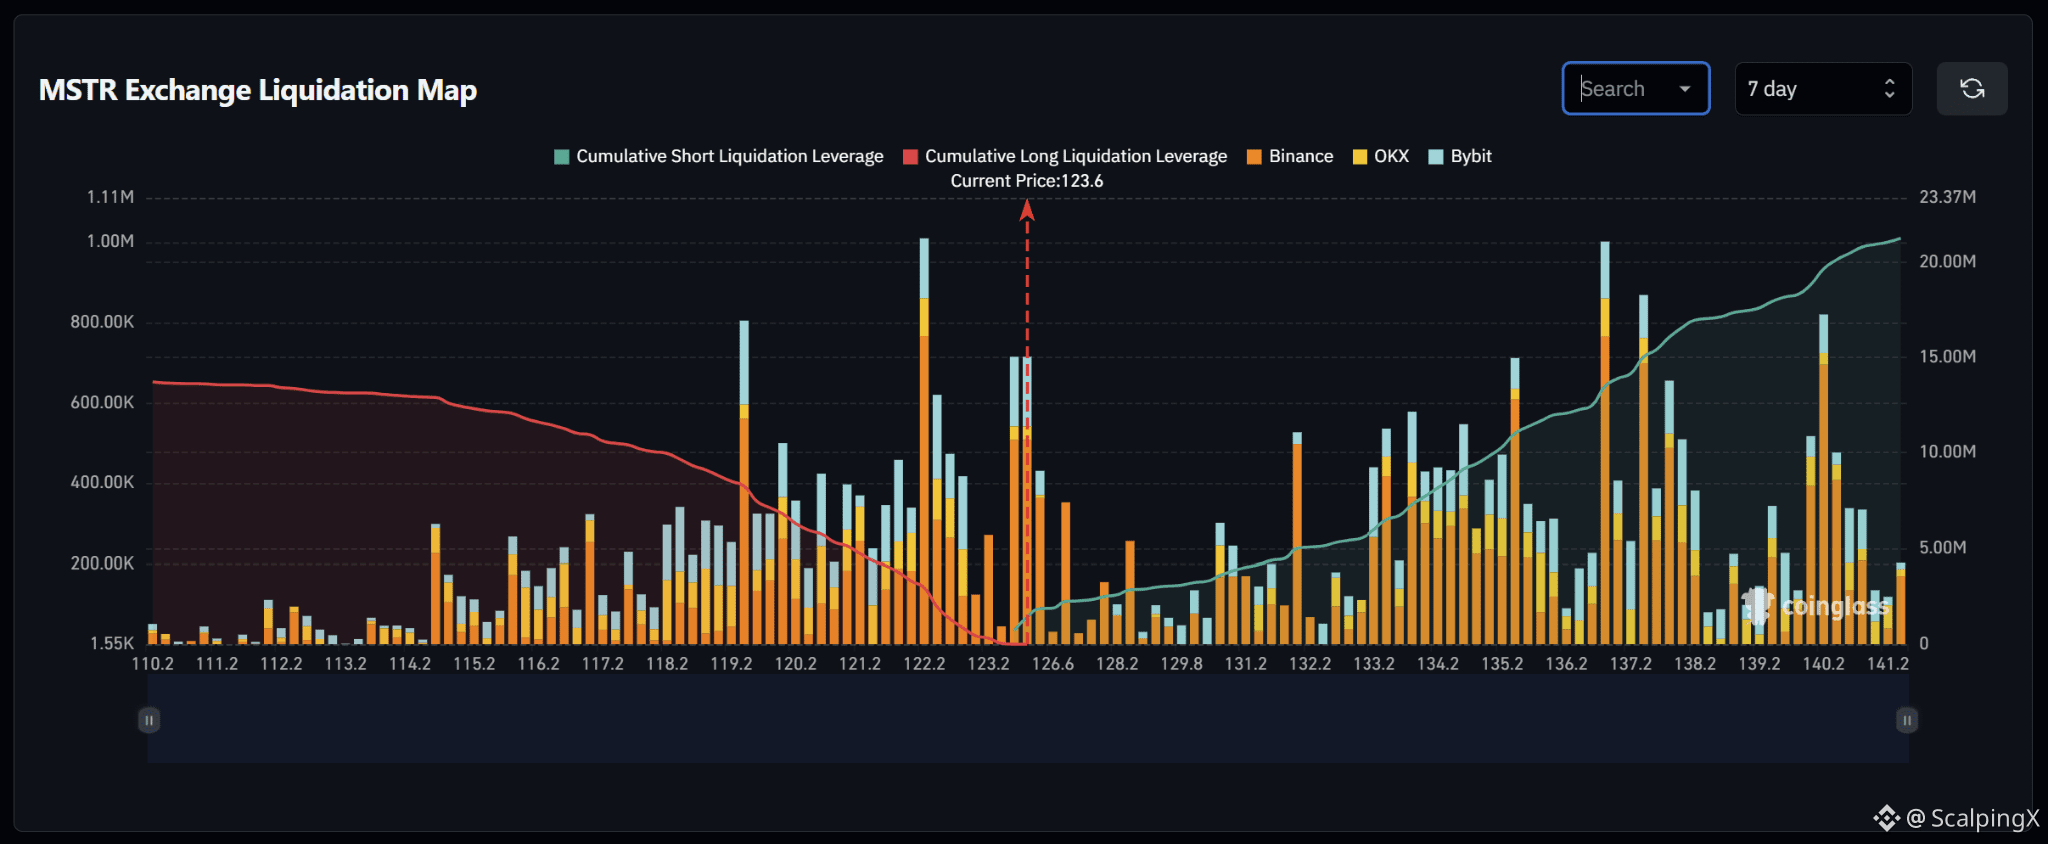
$MSTR – Liquidation Map (7 Days) – Current Price 123.6
🔎 The 7-day liquidation map shows roughly $20–21 million in short liquidations above the current price, exceeding approximately 13–14 million in long liquidations below. The liquidity structure therefore favors the upside, with roughly 1.5 times more cumulative liquidity above the market.
📉 Below the market, nearby long-liquidation liquidity is concentrated around 123.2–122.2. The strongest cluster sits near 122.2, where the liquidation bar reaches roughly 1 million, while 119.2 also contains a large cluster near $800,000. Losing 123.2 would increase the probability of a sweep toward 122.2.
📈 Above the market, short-liquidation liquidity begins building around 124–126.6 before increasing sharply across 133.2–137.2. The 136.2–137.2 area stands out with liquidation bars around $850,000–1 million. Further out, the 140.2 area also contains a large cluster above $800,000.
🧭 The broader setup favors the upside because short-liquidation exposure above is roughly 1.5 times larger. Breaking through 124–126.6 would increase the probability of a move toward 133.2–137.2, while losing 123.2 would shift attention toward 122.2.
#LiquidationMap
$MSTR – Liquidation Map (7 Days) – Current Price 123.6
🔎 The 7-day liquidation map shows roughly $20–21 million in short liquidations above the current price, exceeding approximately 13–14 million in long liquidations below. The liquidity structure therefore favors the upside, with roughly 1.5 times more cumulative liquidity above the market.
📉 Below the market, nearby long-liquidation liquidity is concentrated around 123.2–122.2. The strongest cluster sits near 122.2, where the liquidation bar reaches roughly 1 million, while 119.2 also contains a large cluster near $800,000. Losing 123.2 would increase the probability of a sweep toward 122.2.
📈 Above the market, short-liquidation liquidity begins building around 124–126.6 before increasing sharply across 133.2–137.2. The 136.2–137.2 area stands out with liquidation bars around $850,000–1 million. Further out, the 140.2 area also contains a large cluster above $800,000.
🧭 The broader setup favors the upside because short-liquidation exposure above is roughly 1.5 times larger. Breaking through 124–126.6 would increase the probability of a move toward 133.2–137.2, while losing 123.2 would shift attention toward 122.2.
#LiquidationMap
🔎 The 7-day liquidation map shows roughly $20–21 million in short liquidations above the current price, exceeding approximately 13–14 million in long liquidations below. The liquidity structure therefore favors the upside, with roughly 1.5 times more cumulative liquidity above the market.
📉 Below the market, nearby long-liquidation liquidity is concentrated around 123.2–122.2. The strongest cluster sits near 122.2, where the liquidation bar reaches roughly 1 million, while 119.2 also contains a large cluster near $800,000. Losing 123.2 would increase the probability of a sweep toward 122.2.
📈 Above the market, short-liquidation liquidity begins building around 124–126.6 before increasing sharply across 133.2–137.2. The 136.2–137.2 area stands out with liquidation bars around $850,000–1 million. Further out, the 140.2 area also contains a large cluster above $800,000.
🧭 The broader setup favors the upside because short-liquidation exposure above is roughly 1.5 times larger. Breaking through 124–126.6 would increase the probability of a move toward 133.2–137.2, while losing 123.2 would shift attention toward 122.2.
#LiquidationMap
15
·
--
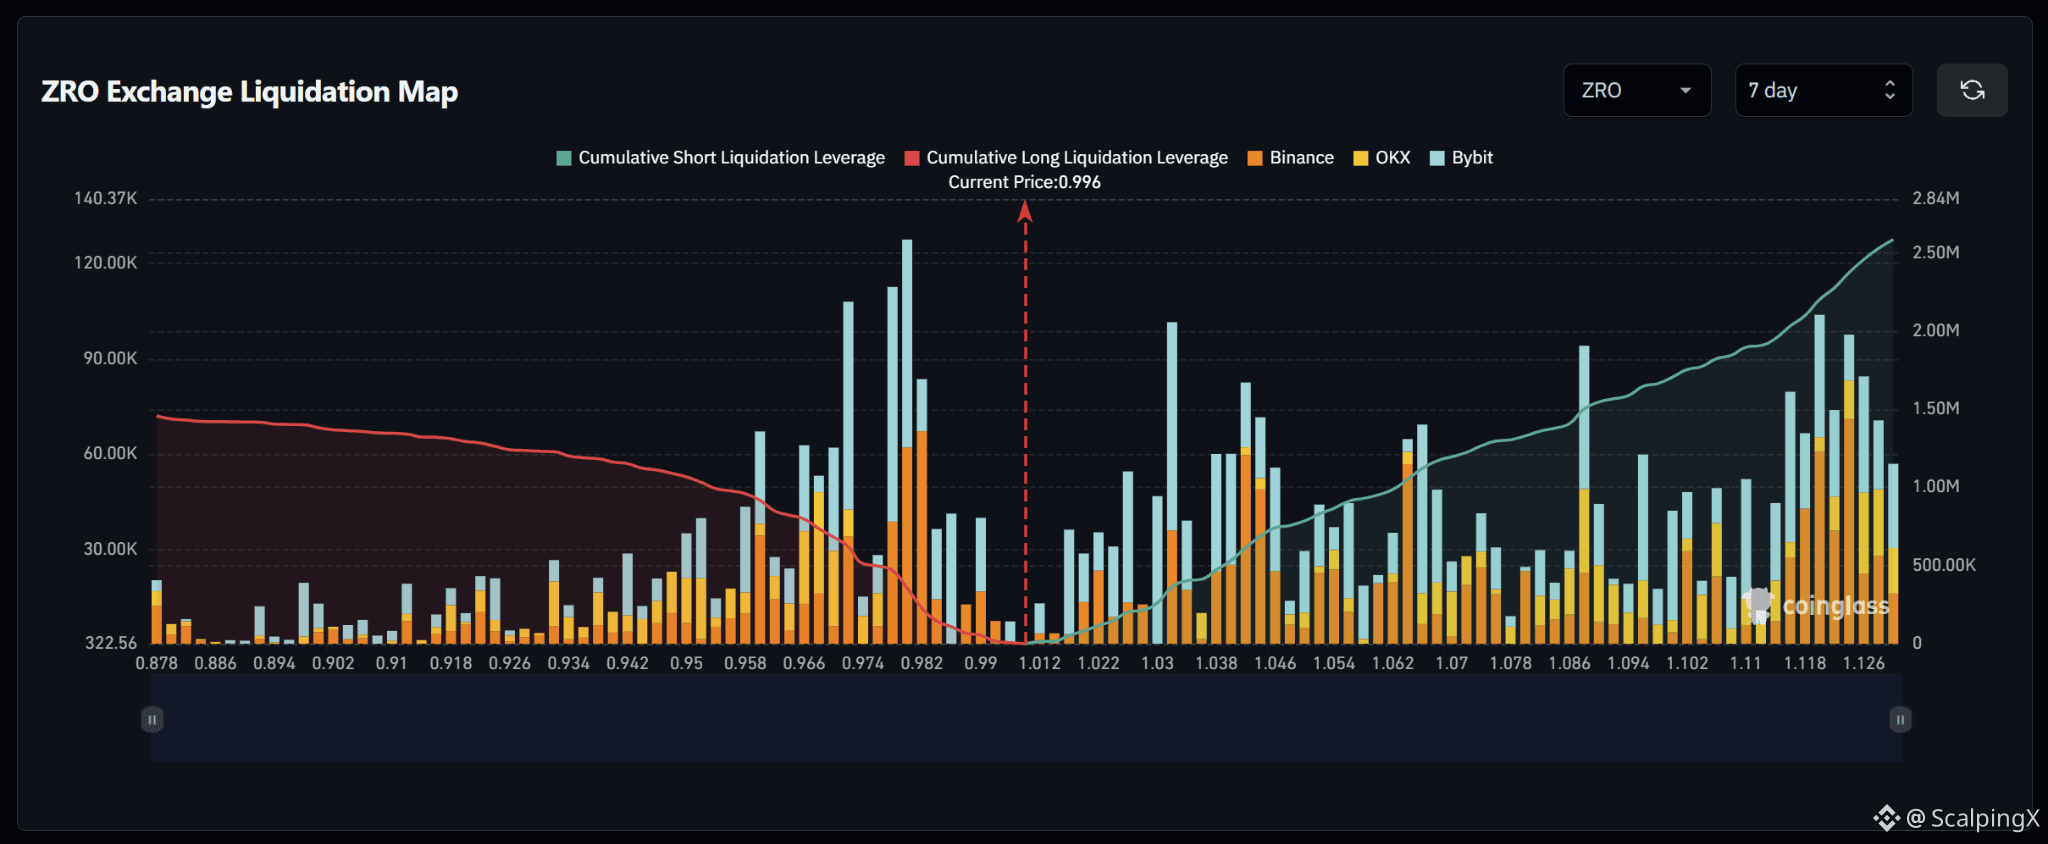
$ZRO – Liquidation Map (7 Days) – Current Price 0.996
🔎 The 7-day liquidation map shows roughly $2.5 million in short liquidations above the current price, exceeding approximately $1.5 million in long liquidations below. The liquidity structure therefore favors the upside, with roughly 1.6–1.7 times more cumulative liquidity above the market.
📉 Below the market, nearby long-liquidation liquidity is concentrated around 0.982–0.966. The strongest cluster sits near 0.978–0.982, where liquidation bars reach roughly $110,000–130,000, while 0.966–0.974 also contains notable liquidity. Losing 0.982 would shift attention toward 0.974–0.966.
📈 Above the market, short-liquidation liquidity begins building from around 1.012 and increases across 1.030–1.046. Further out, the 1.086 and especially 1.118–1.126 areas stand out, with several bars around $90,000–105,000. These form some of the more notable upside liquidity zones.
🧭 The broader setup favors the upside because short-liquidation exposure above is roughly 1.6–1.7 times larger. Breaking 1.012 would increase the probability of a sweep toward 1.030–1.046, while losing 0.982 would shift attention toward 0.974–0.966.
#LiquidationMap
$ZRO – Liquidation Map (7 Days) – Current Price 0.996
🔎 The 7-day liquidation map shows roughly $2.5 million in short liquidations above the current price, exceeding approximately $1.5 million in long liquidations below. The liquidity structure therefore favors the upside, with roughly 1.6–1.7 times more cumulative liquidity above the market.
📉 Below the market, nearby long-liquidation liquidity is concentrated around 0.982–0.966. The strongest cluster sits near 0.978–0.982, where liquidation bars reach roughly $110,000–130,000, while 0.966–0.974 also contains notable liquidity. Losing 0.982 would shift attention toward 0.974–0.966.
📈 Above the market, short-liquidation liquidity begins building from around 1.012 and increases across 1.030–1.046. Further out, the 1.086 and especially 1.118–1.126 areas stand out, with several bars around $90,000–105,000. These form some of the more notable upside liquidity zones.
🧭 The broader setup favors the upside because short-liquidation exposure above is roughly 1.6–1.7 times larger. Breaking 1.012 would increase the probability of a sweep toward 1.030–1.046, while losing 0.982 would shift attention toward 0.974–0.966.
#LiquidationMap
🔎 The 7-day liquidation map shows roughly $2.5 million in short liquidations above the current price, exceeding approximately $1.5 million in long liquidations below. The liquidity structure therefore favors the upside, with roughly 1.6–1.7 times more cumulative liquidity above the market.
📉 Below the market, nearby long-liquidation liquidity is concentrated around 0.982–0.966. The strongest cluster sits near 0.978–0.982, where liquidation bars reach roughly $110,000–130,000, while 0.966–0.974 also contains notable liquidity. Losing 0.982 would shift attention toward 0.974–0.966.
📈 Above the market, short-liquidation liquidity begins building from around 1.012 and increases across 1.030–1.046. Further out, the 1.086 and especially 1.118–1.126 areas stand out, with several bars around $90,000–105,000. These form some of the more notable upside liquidity zones.
🧭 The broader setup favors the upside because short-liquidation exposure above is roughly 1.6–1.7 times larger. Breaking 1.012 would increase the probability of a sweep toward 1.030–1.046, while losing 0.982 would shift attention toward 0.974–0.966.
#LiquidationMap
77
·
--
උසබ තත්ත්වය
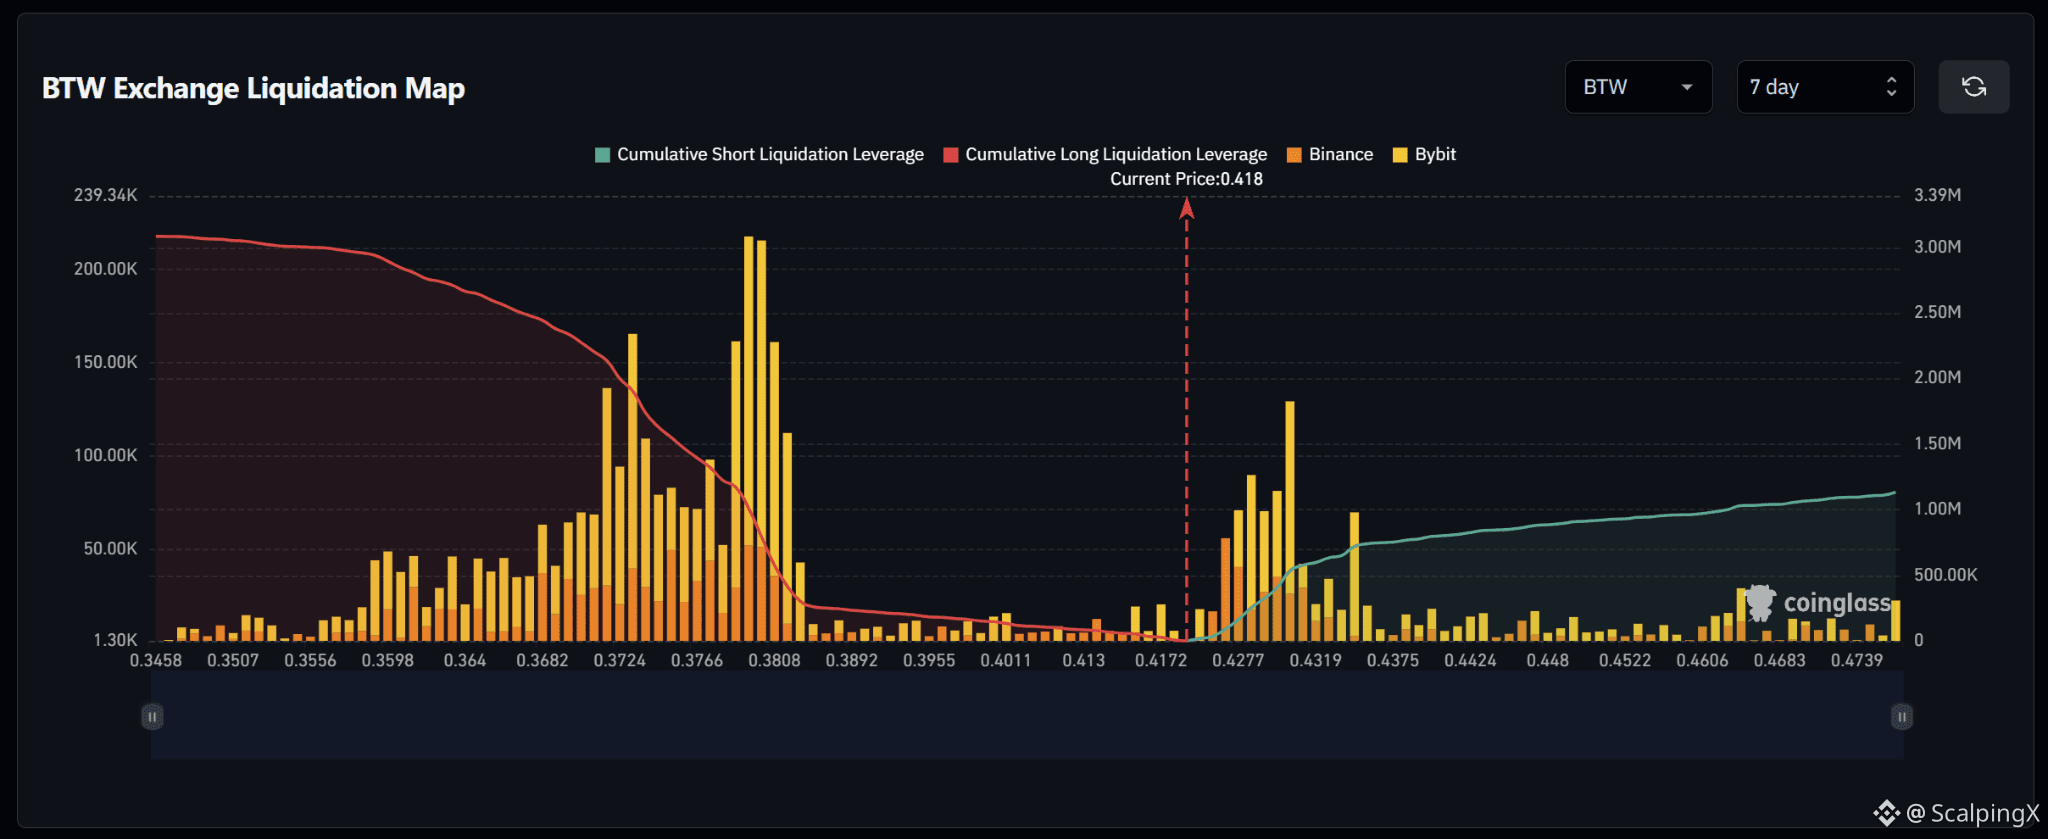
$BTW – Liquidation Map (7 Days) – Current Price 0.418
🔎 The 7-day liquidation map shows roughly $3.1 million in long liquidations below the current price, nearly three times the approximately $1.1 million in short liquidations above. The liquidity structure therefore clearly favors the downside.
📉 Below the market, nearby long-liquidation liquidity remains relatively thin around 0.413–0.401 before increasing sharply across 0.389–0.372. The strongest cluster sits around 0.378–0.381, where liquidation bars exceed $200,000, while 0.372–0.377 also contains substantial liquidity. Losing 0.413 would gradually shift attention toward 0.401–0.389.
📈 Above the market, short-liquidation liquidity begins building clearly from 0.4277 and increases across 0.4319–0.4375. The strongest cluster sits near 0.4319, where the liquidation bar reaches roughly $130,000, while 0.4277–0.4319 forms the nearest notable upside liquidity zone.
🧭 The broader setup favors the downside because long-liquidation exposure below is nearly three times larger. Losing 0.413 would increase the probability of a sweep toward 0.401–0.389, while breaking above 0.4277 would shift attention toward 0.4319–0.4375.
#LiquidationMap
$BTW – Liquidation Map (7 Days) – Current Price 0.418
🔎 The 7-day liquidation map shows roughly $3.1 million in long liquidations below the current price, nearly three times the approximately $1.1 million in short liquidations above. The liquidity structure therefore clearly favors the downside.
📉 Below the market, nearby long-liquidation liquidity remains relatively thin around 0.413–0.401 before increasing sharply across 0.389–0.372. The strongest cluster sits around 0.378–0.381, where liquidation bars exceed $200,000, while 0.372–0.377 also contains substantial liquidity. Losing 0.413 would gradually shift attention toward 0.401–0.389.
📈 Above the market, short-liquidation liquidity begins building clearly from 0.4277 and increases across 0.4319–0.4375. The strongest cluster sits near 0.4319, where the liquidation bar reaches roughly $130,000, while 0.4277–0.4319 forms the nearest notable upside liquidity zone.
🧭 The broader setup favors the downside because long-liquidation exposure below is nearly three times larger. Losing 0.413 would increase the probability of a sweep toward 0.401–0.389, while breaking above 0.4277 would shift attention toward 0.4319–0.4375.
#LiquidationMap
🔎 The 7-day liquidation map shows roughly $3.1 million in long liquidations below the current price, nearly three times the approximately $1.1 million in short liquidations above. The liquidity structure therefore clearly favors the downside.
📉 Below the market, nearby long-liquidation liquidity remains relatively thin around 0.413–0.401 before increasing sharply across 0.389–0.372. The strongest cluster sits around 0.378–0.381, where liquidation bars exceed $200,000, while 0.372–0.377 also contains substantial liquidity. Losing 0.413 would gradually shift attention toward 0.401–0.389.
📈 Above the market, short-liquidation liquidity begins building clearly from 0.4277 and increases across 0.4319–0.4375. The strongest cluster sits near 0.4319, where the liquidation bar reaches roughly $130,000, while 0.4277–0.4319 forms the nearest notable upside liquidity zone.
🧭 The broader setup favors the downside because long-liquidation exposure below is nearly three times larger. Losing 0.413 would increase the probability of a sweep toward 0.401–0.389, while breaking above 0.4277 would shift attention toward 0.4319–0.4375.
#LiquidationMap
9
·
--
උසබ තත්ත්වය
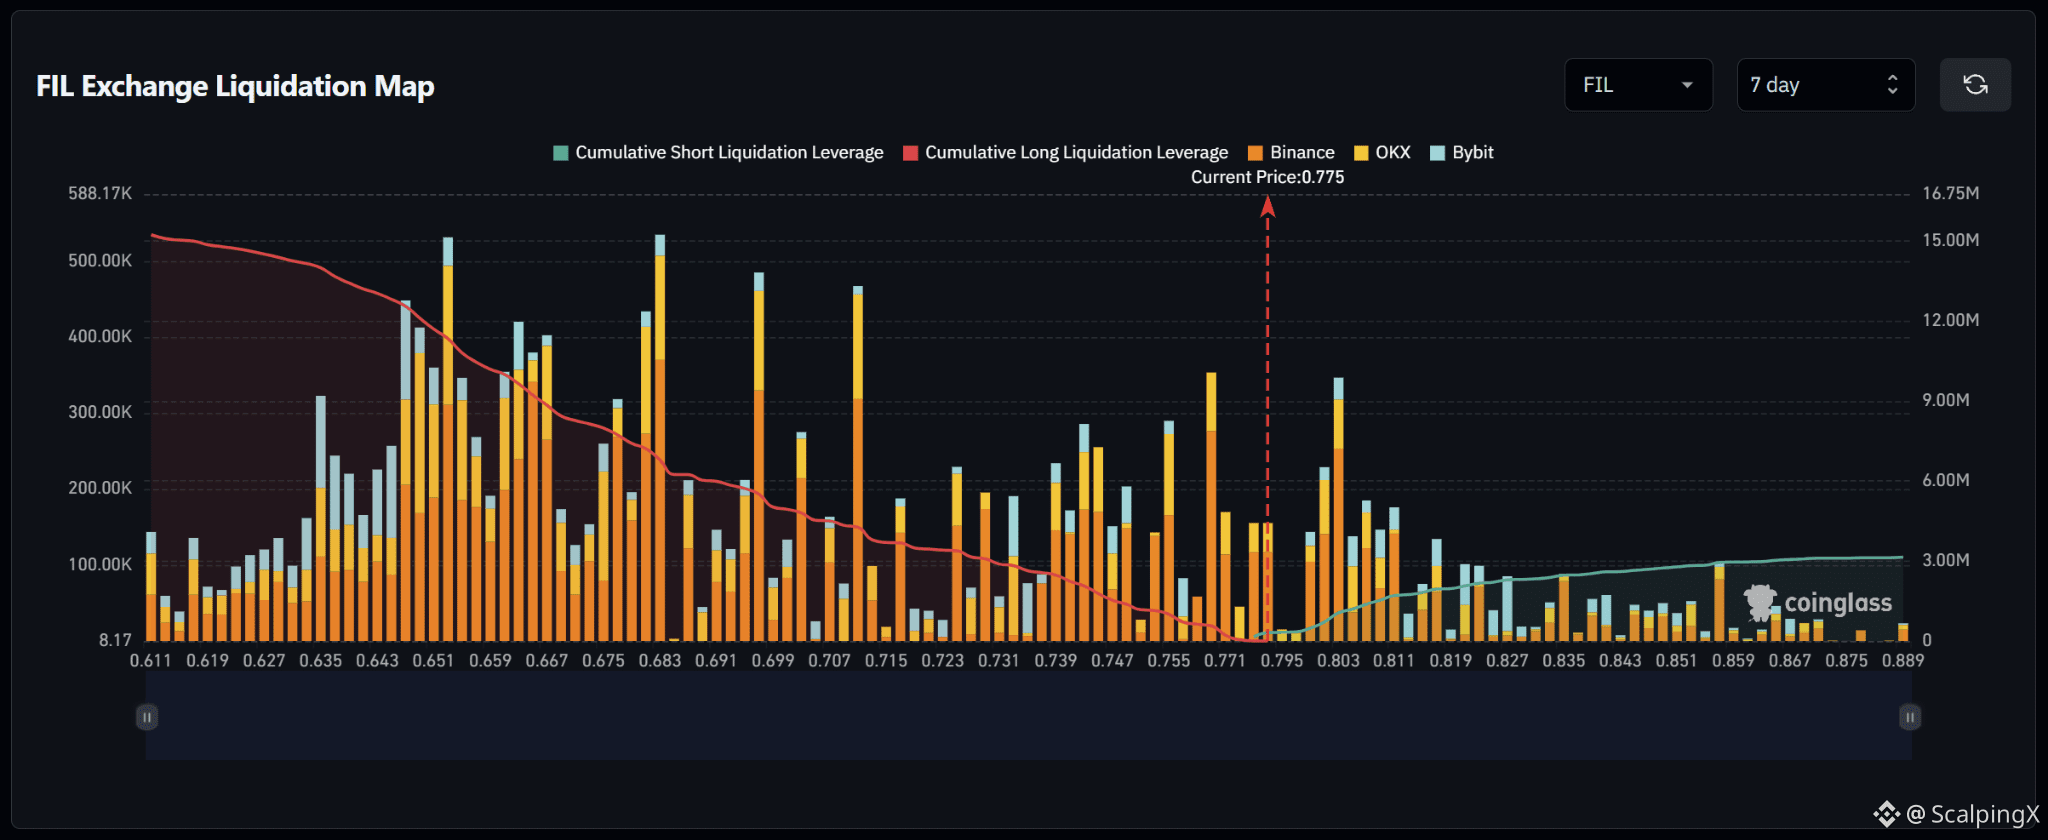
$FIL – Liquidation Map (7 Days) – Current Price 0.775
🔎 The 7-day liquidation map shows roughly $15 million in long liquidations below the current price, around five times the approximately $3 million in short liquidations above. The liquidity structure therefore strongly favors the downside.
📉 Below the market, nearby long-liquidation liquidity is concentrated around 0.771–0.747, with notable clusters near 0.755 and 0.747. Further down, liquidity increases sharply across 0.707–0.683, while 0.667–0.643 contains several large bars around $300,000–530,000. Losing 0.771 would increase the probability of a sweep toward 0.755–0.747.
📈 Above the market, short-liquidation liquidity remains relatively sparse near the current price and becomes more visible from around 0.795. The strongest nearby cluster sits near 0.803, where the liquidation bar reaches roughly $340,000, followed by 0.811–0.819. Further out, upside liquidity becomes significantly lighter.
🧭 The broader setup strongly favors the downside because long-liquidation exposure below is roughly five times larger. Losing 0.771 would increase the probability of a sweep toward 0.755–0.747, while breaking above 0.795 would shift attention toward 0.803–0.811.
#LiquidationMap
$FIL – Liquidation Map (7 Days) – Current Price 0.775
🔎 The 7-day liquidation map shows roughly $15 million in long liquidations below the current price, around five times the approximately $3 million in short liquidations above. The liquidity structure therefore strongly favors the downside.
📉 Below the market, nearby long-liquidation liquidity is concentrated around 0.771–0.747, with notable clusters near 0.755 and 0.747. Further down, liquidity increases sharply across 0.707–0.683, while 0.667–0.643 contains several large bars around $300,000–530,000. Losing 0.771 would increase the probability of a sweep toward 0.755–0.747.
📈 Above the market, short-liquidation liquidity remains relatively sparse near the current price and becomes more visible from around 0.795. The strongest nearby cluster sits near 0.803, where the liquidation bar reaches roughly $340,000, followed by 0.811–0.819. Further out, upside liquidity becomes significantly lighter.
🧭 The broader setup strongly favors the downside because long-liquidation exposure below is roughly five times larger. Losing 0.771 would increase the probability of a sweep toward 0.755–0.747, while breaking above 0.795 would shift attention toward 0.803–0.811.
#LiquidationMap
🔎 The 7-day liquidation map shows roughly $15 million in long liquidations below the current price, around five times the approximately $3 million in short liquidations above. The liquidity structure therefore strongly favors the downside.
📉 Below the market, nearby long-liquidation liquidity is concentrated around 0.771–0.747, with notable clusters near 0.755 and 0.747. Further down, liquidity increases sharply across 0.707–0.683, while 0.667–0.643 contains several large bars around $300,000–530,000. Losing 0.771 would increase the probability of a sweep toward 0.755–0.747.
📈 Above the market, short-liquidation liquidity remains relatively sparse near the current price and becomes more visible from around 0.795. The strongest nearby cluster sits near 0.803, where the liquidation bar reaches roughly $340,000, followed by 0.811–0.819. Further out, upside liquidity becomes significantly lighter.
🧭 The broader setup strongly favors the downside because long-liquidation exposure below is roughly five times larger. Losing 0.771 would increase the probability of a sweep toward 0.755–0.747, while breaking above 0.795 would shift attention toward 0.803–0.811.
#LiquidationMap
36
·
--
උසබ තත්ත්වය
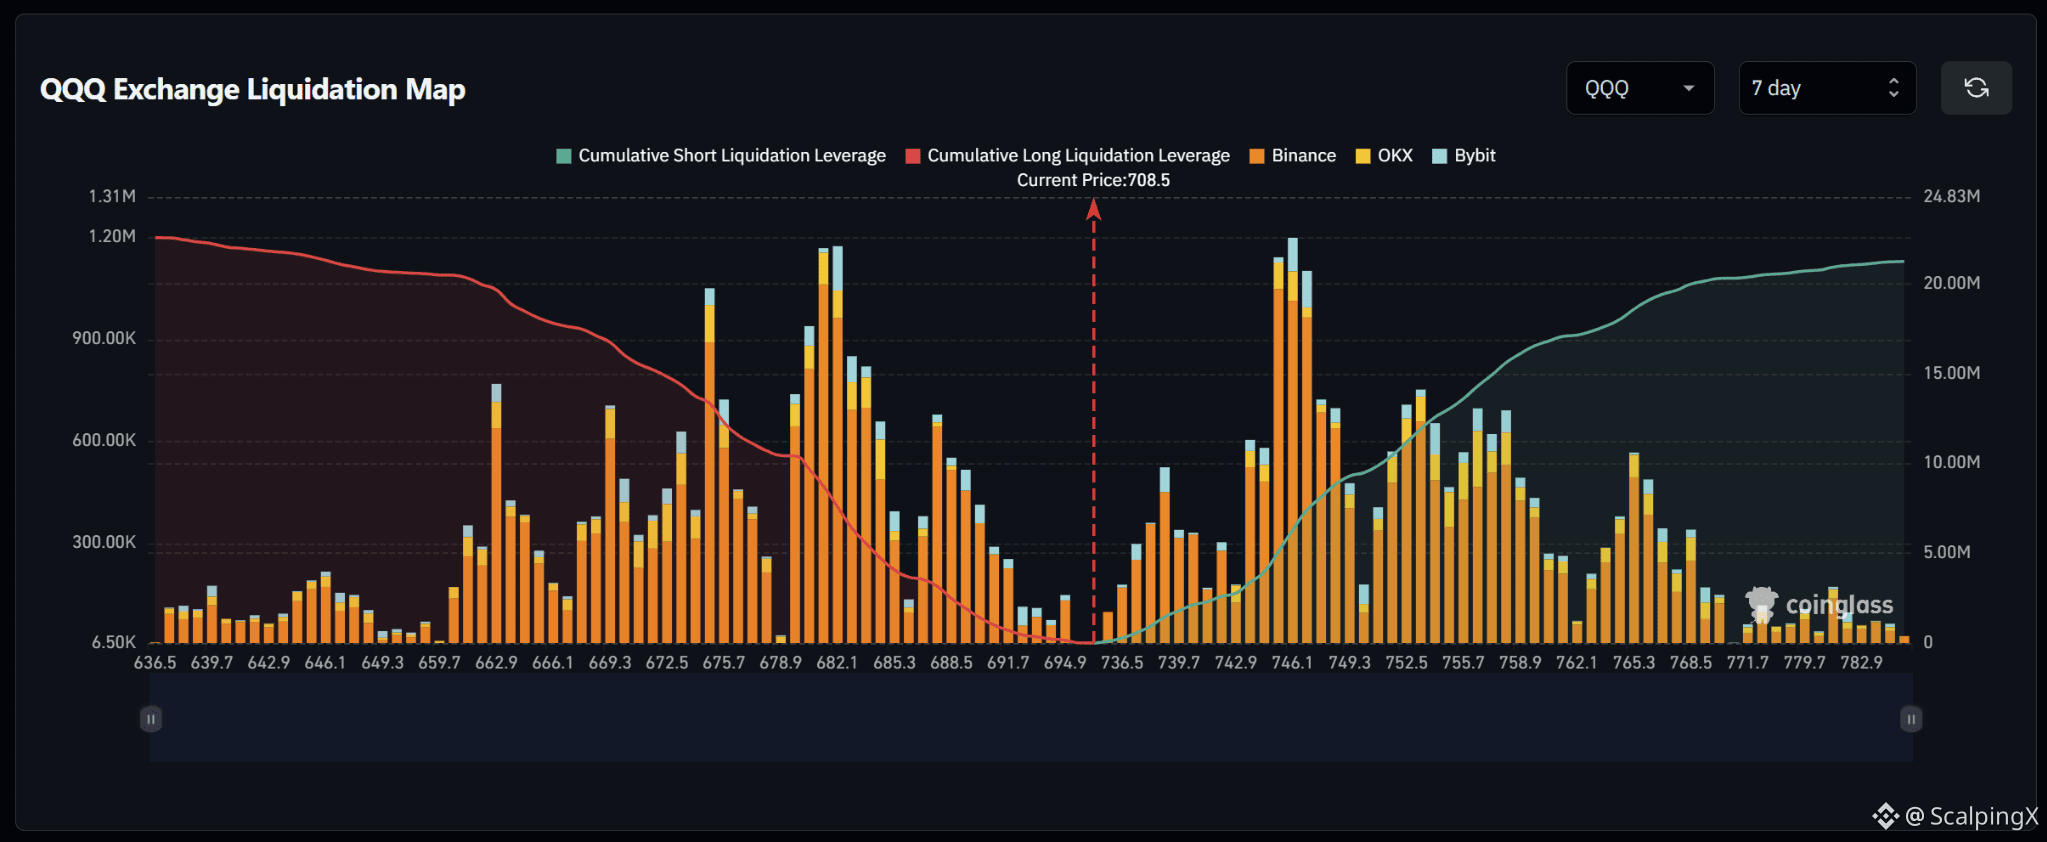
$QQQ – Liquidation Map (7 Days) – Current Price 708.5
🔎 The 7-day liquidation map shows roughly $22 million in long liquidations below the current price, slightly exceeding approximately $21 million in short liquidations above. The overall structure is therefore fairly balanced but modestly tilted to the downside.
📉 Below the market, long-liquidation liquidity is concentrated heavily around 688.5–675.7. The strongest cluster sits near 682.1, where the liquidation bar approaches $1.2 million, while 675.7 and 662.9 also contain large clusters around $700,000–1 million. Losing 694.9 would shift attention toward 688.5–682.1.
📈 Above the market, meaningful short-liquidation liquidity becomes more visible from around 736.5 and increases sharply across 742.9–749.3. The strongest cluster sits near 746.1, where the liquidation bar approaches $1.2 million. Further out, 752.5–758.9 also contains several $500,000–750,000 clusters.
🧭 The broader setup remains relatively balanced but modestly favors the downside. Losing 694.9 would increase the probability of a sweep toward 688.5–682.1, while a move above 736.5 would shift attention toward 742.9–749.3.
#LiquidationMap
$QQQ – Liquidation Map (7 Days) – Current Price 708.5
🔎 The 7-day liquidation map shows roughly $22 million in long liquidations below the current price, slightly exceeding approximately $21 million in short liquidations above. The overall structure is therefore fairly balanced but modestly tilted to the downside.
📉 Below the market, long-liquidation liquidity is concentrated heavily around 688.5–675.7. The strongest cluster sits near 682.1, where the liquidation bar approaches $1.2 million, while 675.7 and 662.9 also contain large clusters around $700,000–1 million. Losing 694.9 would shift attention toward 688.5–682.1.
📈 Above the market, meaningful short-liquidation liquidity becomes more visible from around 736.5 and increases sharply across 742.9–749.3. The strongest cluster sits near 746.1, where the liquidation bar approaches $1.2 million. Further out, 752.5–758.9 also contains several $500,000–750,000 clusters.
🧭 The broader setup remains relatively balanced but modestly favors the downside. Losing 694.9 would increase the probability of a sweep toward 688.5–682.1, while a move above 736.5 would shift attention toward 742.9–749.3.
#LiquidationMap
🔎 The 7-day liquidation map shows roughly $22 million in long liquidations below the current price, slightly exceeding approximately $21 million in short liquidations above. The overall structure is therefore fairly balanced but modestly tilted to the downside.
📉 Below the market, long-liquidation liquidity is concentrated heavily around 688.5–675.7. The strongest cluster sits near 682.1, where the liquidation bar approaches $1.2 million, while 675.7 and 662.9 also contain large clusters around $700,000–1 million. Losing 694.9 would shift attention toward 688.5–682.1.
📈 Above the market, meaningful short-liquidation liquidity becomes more visible from around 736.5 and increases sharply across 742.9–749.3. The strongest cluster sits near 746.1, where the liquidation bar approaches $1.2 million. Further out, 752.5–758.9 also contains several $500,000–750,000 clusters.
🧭 The broader setup remains relatively balanced but modestly favors the downside. Losing 694.9 would increase the probability of a sweep toward 688.5–682.1, while a move above 736.5 would shift attention toward 742.9–749.3.
#LiquidationMap
16
·
--
උසබ තත්ත්වය
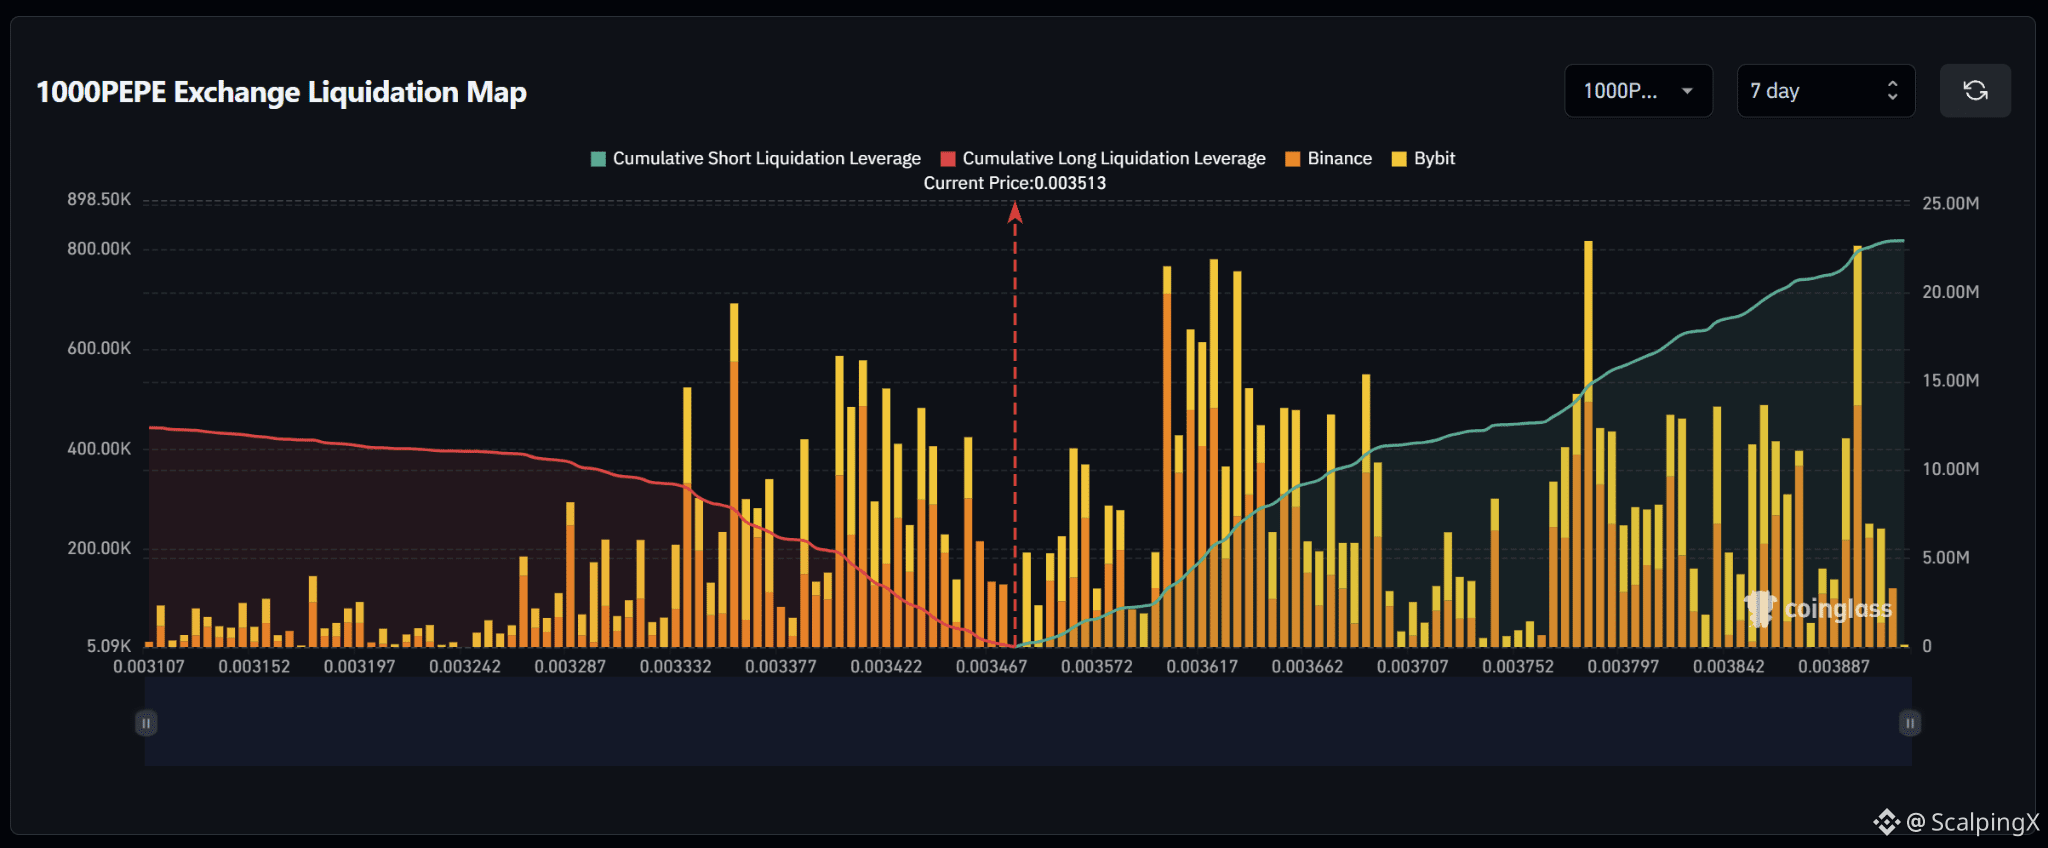
$PEPE – Liquidation Map (7 Days) – Current Price 0.003513
🔎 The 7-day liquidation map shows roughly $22–23 million in short liquidations above the current price, nearly double the approximately $12 million in long liquidations below. The liquidity structure therefore clearly favors the upside, with roughly 1.8–1.9 times more cumulative liquidity above the market.
📉 Below the market, nearby long-liquidation liquidity is concentrated around 0.003467–0.003377. Notable clusters appear around 0.003422–0.003377, with several liquidation bars reaching roughly $400,000–600,000. Further down, the 0.003332 area also contains a large cluster near $500,000. Losing 0.003467 would shift attention toward 0.003422–0.003377.
📈 Above the market, short-liquidation liquidity begins building from around 0.003572 and increases sharply across 0.00360–0.00366, where several bars reach roughly $600,000–780,000. Further out, 0.003797 and 0.003887 stand out with bars near $800,000, forming some of the largest upside clusters.
🧭 The broader setup favors the upside because short-liquidation exposure above is nearly twice as large. Breaking 0.003572 would increase the probability of a sweep toward 0.00360–0.00366, while losing 0.003467 would shift attention toward 0.003422–0.003377.
#LiquidationMap
$PEPE – Liquidation Map (7 Days) – Current Price 0.003513
🔎 The 7-day liquidation map shows roughly $22–23 million in short liquidations above the current price, nearly double the approximately $12 million in long liquidations below. The liquidity structure therefore clearly favors the upside, with roughly 1.8–1.9 times more cumulative liquidity above the market.
📉 Below the market, nearby long-liquidation liquidity is concentrated around 0.003467–0.003377. Notable clusters appear around 0.003422–0.003377, with several liquidation bars reaching roughly $400,000–600,000. Further down, the 0.003332 area also contains a large cluster near $500,000. Losing 0.003467 would shift attention toward 0.003422–0.003377.
📈 Above the market, short-liquidation liquidity begins building from around 0.003572 and increases sharply across 0.00360–0.00366, where several bars reach roughly $600,000–780,000. Further out, 0.003797 and 0.003887 stand out with bars near $800,000, forming some of the largest upside clusters.
🧭 The broader setup favors the upside because short-liquidation exposure above is nearly twice as large. Breaking 0.003572 would increase the probability of a sweep toward 0.00360–0.00366, while losing 0.003467 would shift attention toward 0.003422–0.003377.
#LiquidationMap
🔎 The 7-day liquidation map shows roughly $22–23 million in short liquidations above the current price, nearly double the approximately $12 million in long liquidations below. The liquidity structure therefore clearly favors the upside, with roughly 1.8–1.9 times more cumulative liquidity above the market.
📉 Below the market, nearby long-liquidation liquidity is concentrated around 0.003467–0.003377. Notable clusters appear around 0.003422–0.003377, with several liquidation bars reaching roughly $400,000–600,000. Further down, the 0.003332 area also contains a large cluster near $500,000. Losing 0.003467 would shift attention toward 0.003422–0.003377.
📈 Above the market, short-liquidation liquidity begins building from around 0.003572 and increases sharply across 0.00360–0.00366, where several bars reach roughly $600,000–780,000. Further out, 0.003797 and 0.003887 stand out with bars near $800,000, forming some of the largest upside clusters.
🧭 The broader setup favors the upside because short-liquidation exposure above is nearly twice as large. Breaking 0.003572 would increase the probability of a sweep toward 0.00360–0.00366, while losing 0.003467 would shift attention toward 0.003422–0.003377.
#LiquidationMap
1
23
·
--
උසබ තත්ත්වය
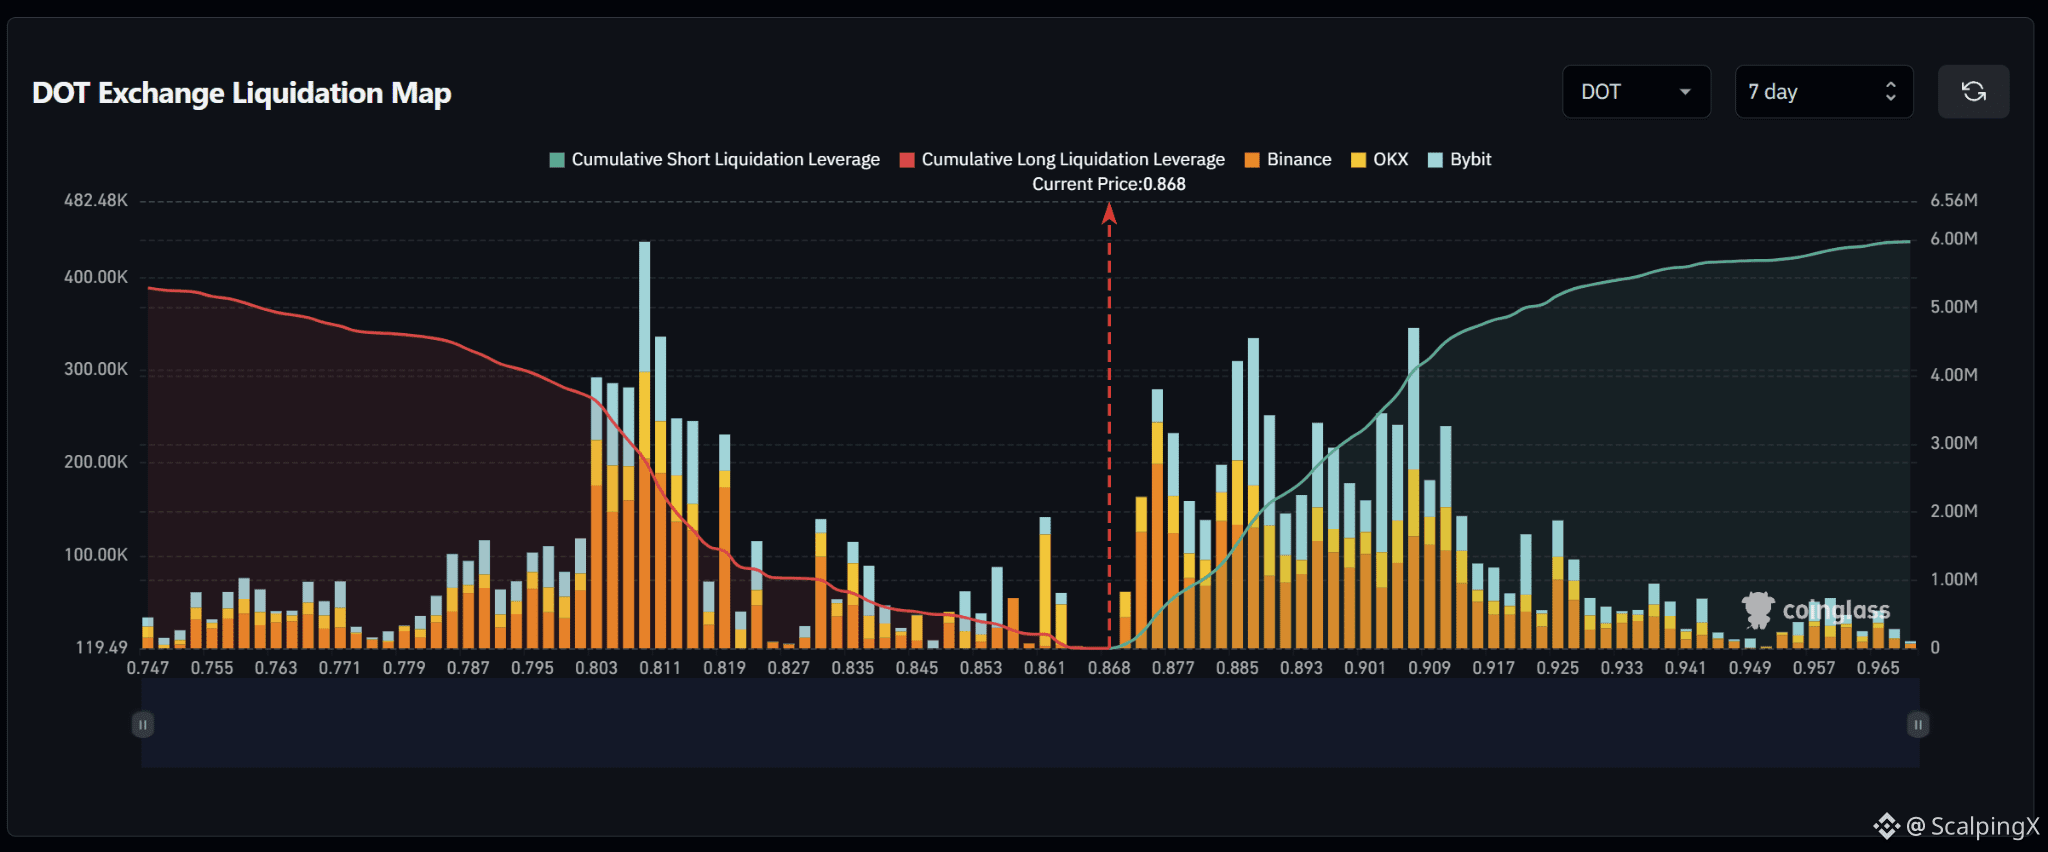
$DOT – Liquidation Map (7 Days) – Current Price 0.868
🔎 The 7-day liquidation map shows roughly $6 million in short liquidations above the current price, slightly exceeding approximately $5.3 million in long liquidations below. The overall structure is therefore fairly balanced but modestly tilted to the upside.
📉 Below the market, nearby long-liquidation liquidity remains relatively thin around 0.861–0.845 before increasing across 0.835–0.803. The strongest cluster sits near 0.811, where the liquidation bar exceeds $400,000, while 0.803–0.819 also contains several $200,000–300,000 clusters. Losing 0.861 would shift attention toward 0.853–0.835.
📈 Above the market, short-liquidation liquidity begins building around 0.877 and becomes much denser across 0.885–0.909. The strongest clusters near 0.885 and 0.909 reach roughly $300,000–350,000. Further out, 0.917–0.925 also contains notable liquidity.
🧭 The broader setup modestly favors the upside because short-liquidation exposure above is larger. Breaking 0.877 would increase the probability of a sweep toward 0.885–0.909, while losing 0.861 would shift attention toward 0.853–0.835.
#LiquidationMap
$DOT – Liquidation Map (7 Days) – Current Price 0.868
🔎 The 7-day liquidation map shows roughly $6 million in short liquidations above the current price, slightly exceeding approximately $5.3 million in long liquidations below. The overall structure is therefore fairly balanced but modestly tilted to the upside.
📉 Below the market, nearby long-liquidation liquidity remains relatively thin around 0.861–0.845 before increasing across 0.835–0.803. The strongest cluster sits near 0.811, where the liquidation bar exceeds $400,000, while 0.803–0.819 also contains several $200,000–300,000 clusters. Losing 0.861 would shift attention toward 0.853–0.835.
📈 Above the market, short-liquidation liquidity begins building around 0.877 and becomes much denser across 0.885–0.909. The strongest clusters near 0.885 and 0.909 reach roughly $300,000–350,000. Further out, 0.917–0.925 also contains notable liquidity.
🧭 The broader setup modestly favors the upside because short-liquidation exposure above is larger. Breaking 0.877 would increase the probability of a sweep toward 0.885–0.909, while losing 0.861 would shift attention toward 0.853–0.835.
#LiquidationMap
🔎 The 7-day liquidation map shows roughly $6 million in short liquidations above the current price, slightly exceeding approximately $5.3 million in long liquidations below. The overall structure is therefore fairly balanced but modestly tilted to the upside.
📉 Below the market, nearby long-liquidation liquidity remains relatively thin around 0.861–0.845 before increasing across 0.835–0.803. The strongest cluster sits near 0.811, where the liquidation bar exceeds $400,000, while 0.803–0.819 also contains several $200,000–300,000 clusters. Losing 0.861 would shift attention toward 0.853–0.835.
📈 Above the market, short-liquidation liquidity begins building around 0.877 and becomes much denser across 0.885–0.909. The strongest clusters near 0.885 and 0.909 reach roughly $300,000–350,000. Further out, 0.917–0.925 also contains notable liquidity.
🧭 The broader setup modestly favors the upside because short-liquidation exposure above is larger. Breaking 0.877 would increase the probability of a sweep toward 0.885–0.909, while losing 0.861 would shift attention toward 0.853–0.835.
#LiquidationMap
40
·
--
උසබ තත්ත්වය
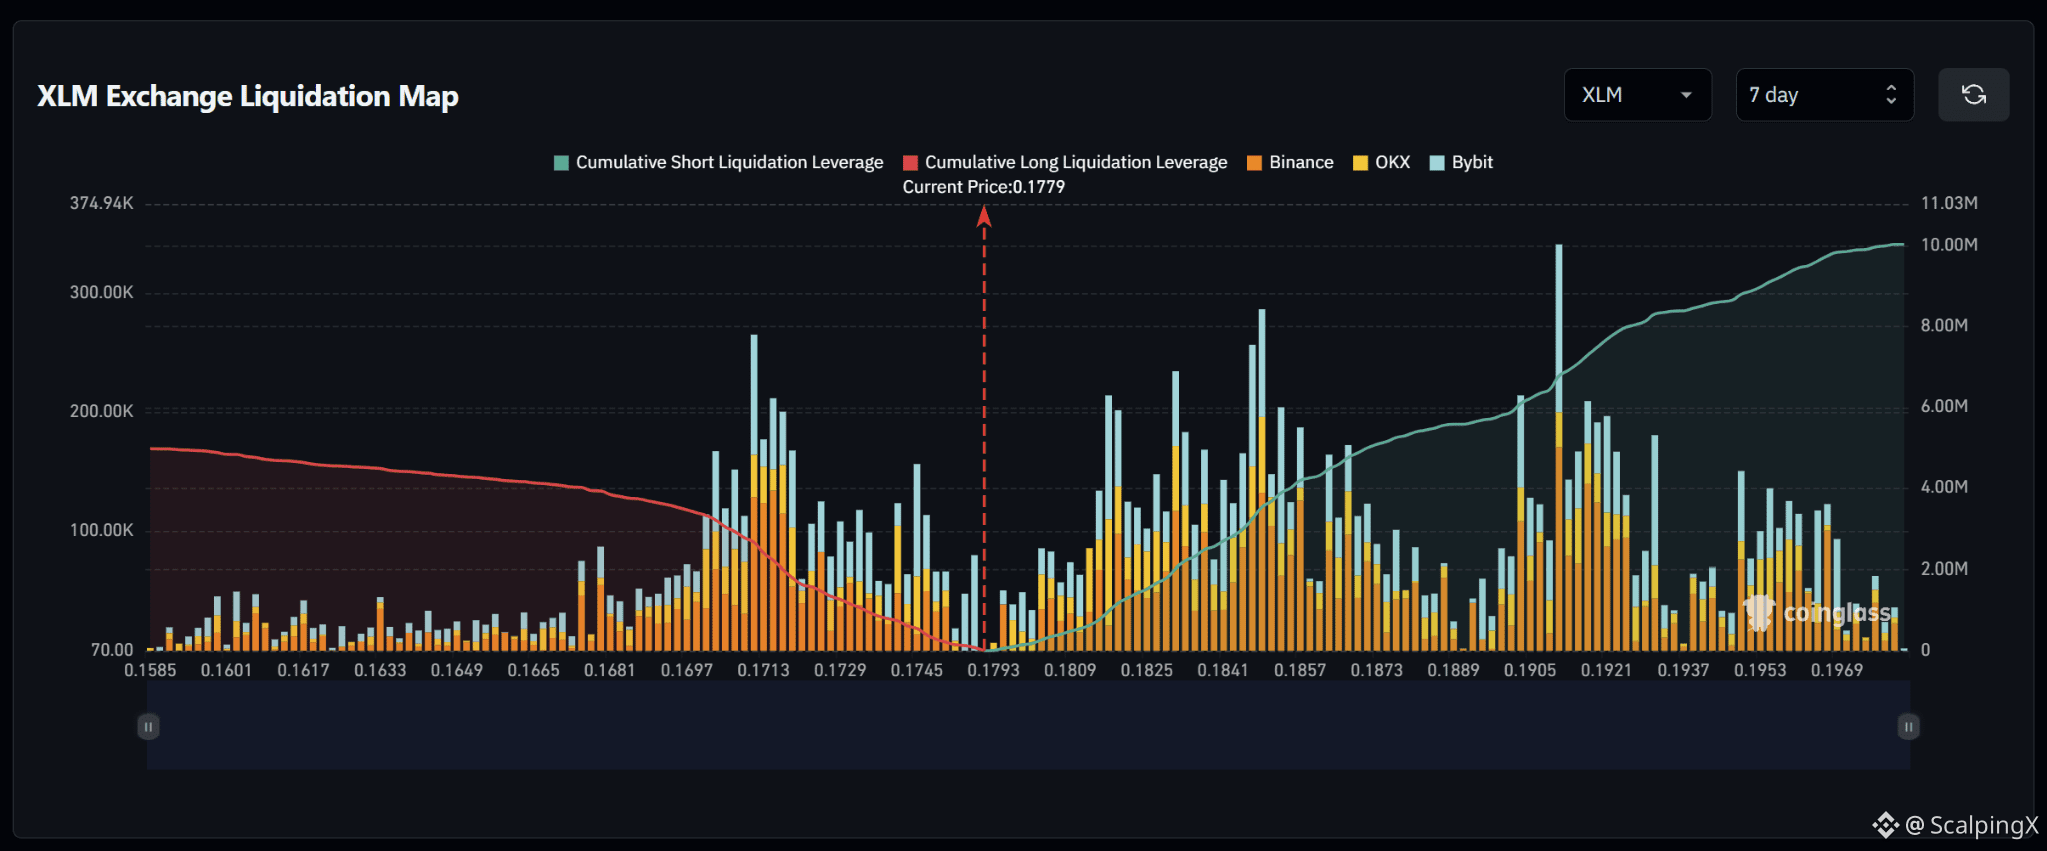
$XLM – Liquidation Map (7 Days) – Current Price 0.1779
🔎 The 7-day liquidation map shows roughly $10 million in short liquidations above the current price, nearly double the approximately $5 million in long liquidations below. The liquidity structure therefore clearly favors the upside.
📉 Below the market, nearby long-liquidation liquidity is concentrated around 0.1745–0.1713. The strongest cluster sits near 0.1713, where the liquidation bar reaches roughly $250,000–270,000, while 0.1697–0.1681 also contains notable liquidity. Losing 0.1745 would increase the probability of a sweep toward 0.1729–0.1713.
📈 Above the market, short-liquidation liquidity begins building around 0.1809 and becomes denser across 0.1825–0.1857. Further out, 0.1905–0.1921 stands out more clearly, with the largest bar near 0.1905 exceeding $300,000. A break above 0.1809 would bring 0.1825–0.1857 into focus first.
🧭 The broader setup favors the upside because short-liquidation exposure above is nearly twice as large. Breaking 0.1809 would increase the probability of a sweep toward 0.1825–0.1857, while losing 0.1745 would shift attention toward 0.1729–0.1713.
#LiquidationMap
$XLM – Liquidation Map (7 Days) – Current Price 0.1779
🔎 The 7-day liquidation map shows roughly $10 million in short liquidations above the current price, nearly double the approximately $5 million in long liquidations below. The liquidity structure therefore clearly favors the upside.
📉 Below the market, nearby long-liquidation liquidity is concentrated around 0.1745–0.1713. The strongest cluster sits near 0.1713, where the liquidation bar reaches roughly $250,000–270,000, while 0.1697–0.1681 also contains notable liquidity. Losing 0.1745 would increase the probability of a sweep toward 0.1729–0.1713.
📈 Above the market, short-liquidation liquidity begins building around 0.1809 and becomes denser across 0.1825–0.1857. Further out, 0.1905–0.1921 stands out more clearly, with the largest bar near 0.1905 exceeding $300,000. A break above 0.1809 would bring 0.1825–0.1857 into focus first.
🧭 The broader setup favors the upside because short-liquidation exposure above is nearly twice as large. Breaking 0.1809 would increase the probability of a sweep toward 0.1825–0.1857, while losing 0.1745 would shift attention toward 0.1729–0.1713.
#LiquidationMap
🔎 The 7-day liquidation map shows roughly $10 million in short liquidations above the current price, nearly double the approximately $5 million in long liquidations below. The liquidity structure therefore clearly favors the upside.
📉 Below the market, nearby long-liquidation liquidity is concentrated around 0.1745–0.1713. The strongest cluster sits near 0.1713, where the liquidation bar reaches roughly $250,000–270,000, while 0.1697–0.1681 also contains notable liquidity. Losing 0.1745 would increase the probability of a sweep toward 0.1729–0.1713.
📈 Above the market, short-liquidation liquidity begins building around 0.1809 and becomes denser across 0.1825–0.1857. Further out, 0.1905–0.1921 stands out more clearly, with the largest bar near 0.1905 exceeding $300,000. A break above 0.1809 would bring 0.1825–0.1857 into focus first.
🧭 The broader setup favors the upside because short-liquidation exposure above is nearly twice as large. Breaking 0.1809 would increase the probability of a sweep toward 0.1825–0.1857, while losing 0.1745 would shift attention toward 0.1729–0.1713.
#LiquidationMap
22
·
--
උසබ තත්ත්වය
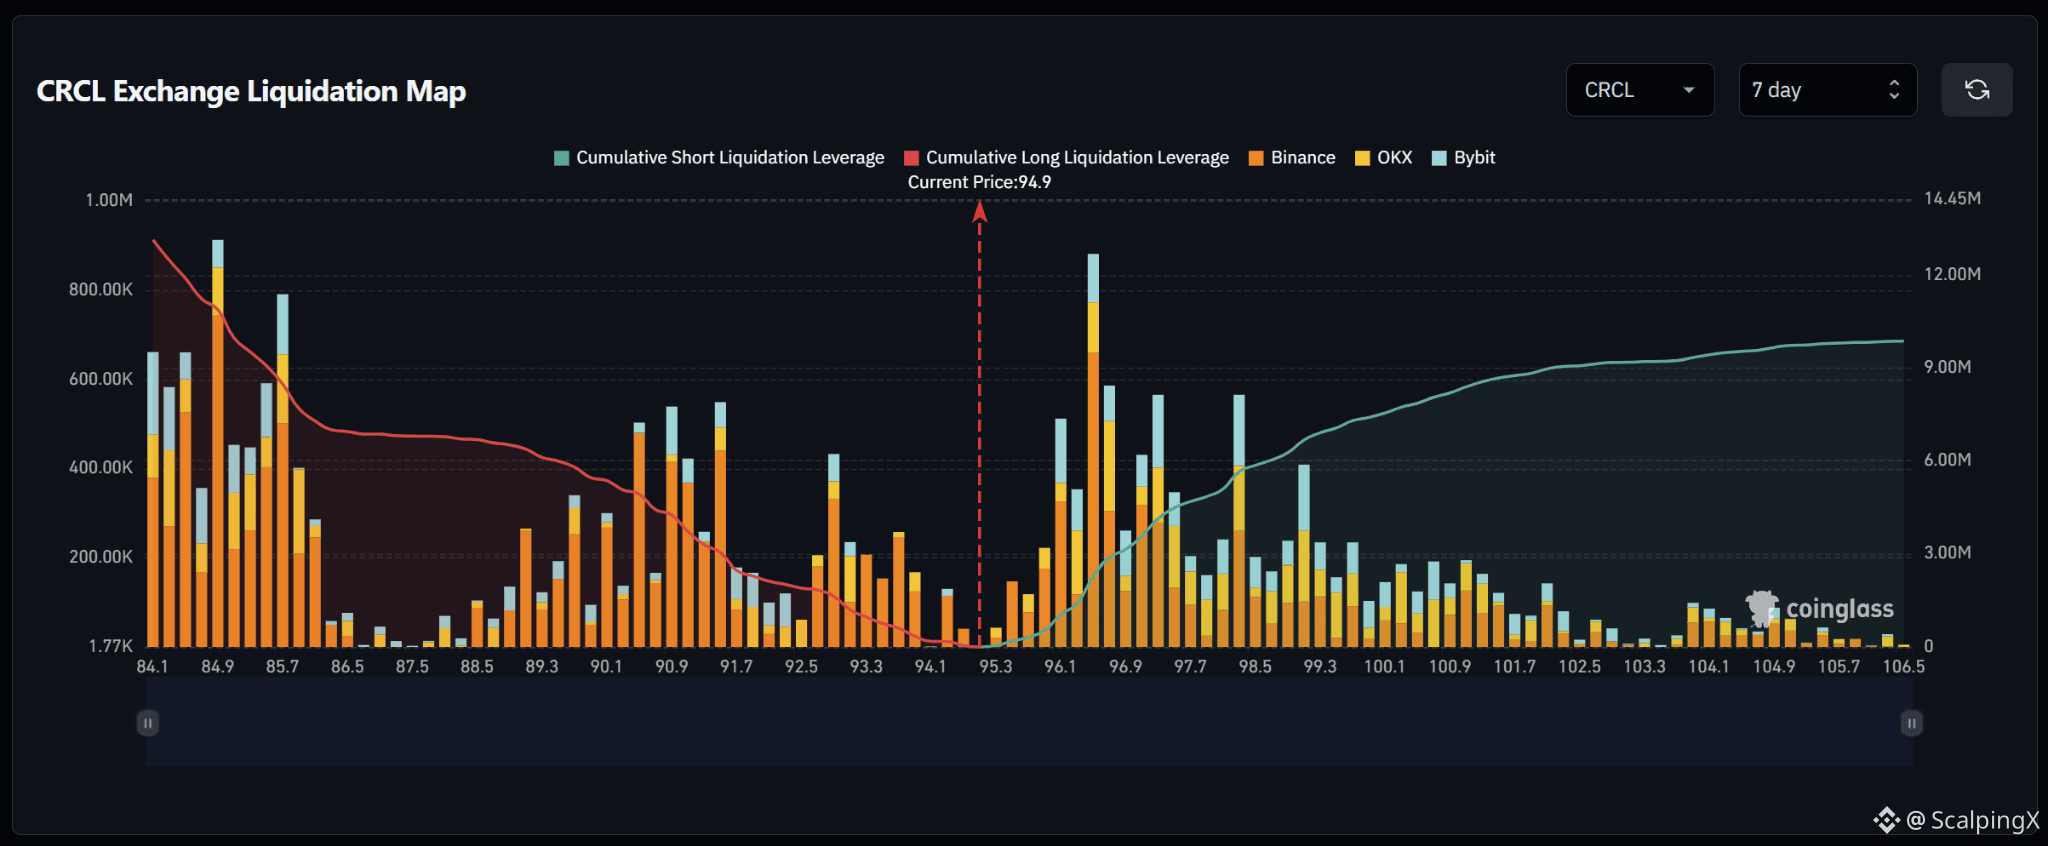
$CRCL – Liquidation Map (7 Days) – Current Price 94.9
🔎 The 7-day liquidation map shows roughly $13 million in long liquidations below the current price, exceeding approximately $9–10 million in short liquidations above. The liquidity structure therefore favors the downside, with roughly 1.3–1.4 times more cumulative liquidity sitting below the market.
📉 Below the market, nearby long-liquidation liquidity remains relatively thin around 94.1 before increasing across 93.3–92.5. Further down, 91.7–90.1 contains several clusters around $300,000–550,000. Losing 94.1 would increase the probability of a sweep toward 93.3–92.5.
📈 Above the market, short-liquidation liquidity begins building around 95.3–96.1 and increases sharply across 96.1–96.9. The strongest nearby cluster sits around 96.5, where the liquidation bar approaches $900,000. Further out, 97.7–99.3 also contains notable liquidity. A break above 95.3 would bring 96.1–96.9 into focus first.
🧭 The broader setup modestly favors the downside because long-liquidation exposure below is roughly 1.3–1.4 times larger. Losing 94.1 would increase the probability of a sweep toward 93.3–92.5, while breaking above 95.3 would shift attention toward 96.1–96.9.
#LiquidationMap
$CRCL – Liquidation Map (7 Days) – Current Price 94.9
🔎 The 7-day liquidation map shows roughly $13 million in long liquidations below the current price, exceeding approximately $9–10 million in short liquidations above. The liquidity structure therefore favors the downside, with roughly 1.3–1.4 times more cumulative liquidity sitting below the market.
📉 Below the market, nearby long-liquidation liquidity remains relatively thin around 94.1 before increasing across 93.3–92.5. Further down, 91.7–90.1 contains several clusters around $300,000–550,000. Losing 94.1 would increase the probability of a sweep toward 93.3–92.5.
📈 Above the market, short-liquidation liquidity begins building around 95.3–96.1 and increases sharply across 96.1–96.9. The strongest nearby cluster sits around 96.5, where the liquidation bar approaches $900,000. Further out, 97.7–99.3 also contains notable liquidity. A break above 95.3 would bring 96.1–96.9 into focus first.
🧭 The broader setup modestly favors the downside because long-liquidation exposure below is roughly 1.3–1.4 times larger. Losing 94.1 would increase the probability of a sweep toward 93.3–92.5, while breaking above 95.3 would shift attention toward 96.1–96.9.
#LiquidationMap
🔎 The 7-day liquidation map shows roughly $13 million in long liquidations below the current price, exceeding approximately $9–10 million in short liquidations above. The liquidity structure therefore favors the downside, with roughly 1.3–1.4 times more cumulative liquidity sitting below the market.
📉 Below the market, nearby long-liquidation liquidity remains relatively thin around 94.1 before increasing across 93.3–92.5. Further down, 91.7–90.1 contains several clusters around $300,000–550,000. Losing 94.1 would increase the probability of a sweep toward 93.3–92.5.
📈 Above the market, short-liquidation liquidity begins building around 95.3–96.1 and increases sharply across 96.1–96.9. The strongest nearby cluster sits around 96.5, where the liquidation bar approaches $900,000. Further out, 97.7–99.3 also contains notable liquidity. A break above 95.3 would bring 96.1–96.9 into focus first.
🧭 The broader setup modestly favors the downside because long-liquidation exposure below is roughly 1.3–1.4 times larger. Losing 94.1 would increase the probability of a sweep toward 93.3–92.5, while breaking above 95.3 would shift attention toward 96.1–96.9.
#LiquidationMap
24
·
--
උසබ තත්ත්වය
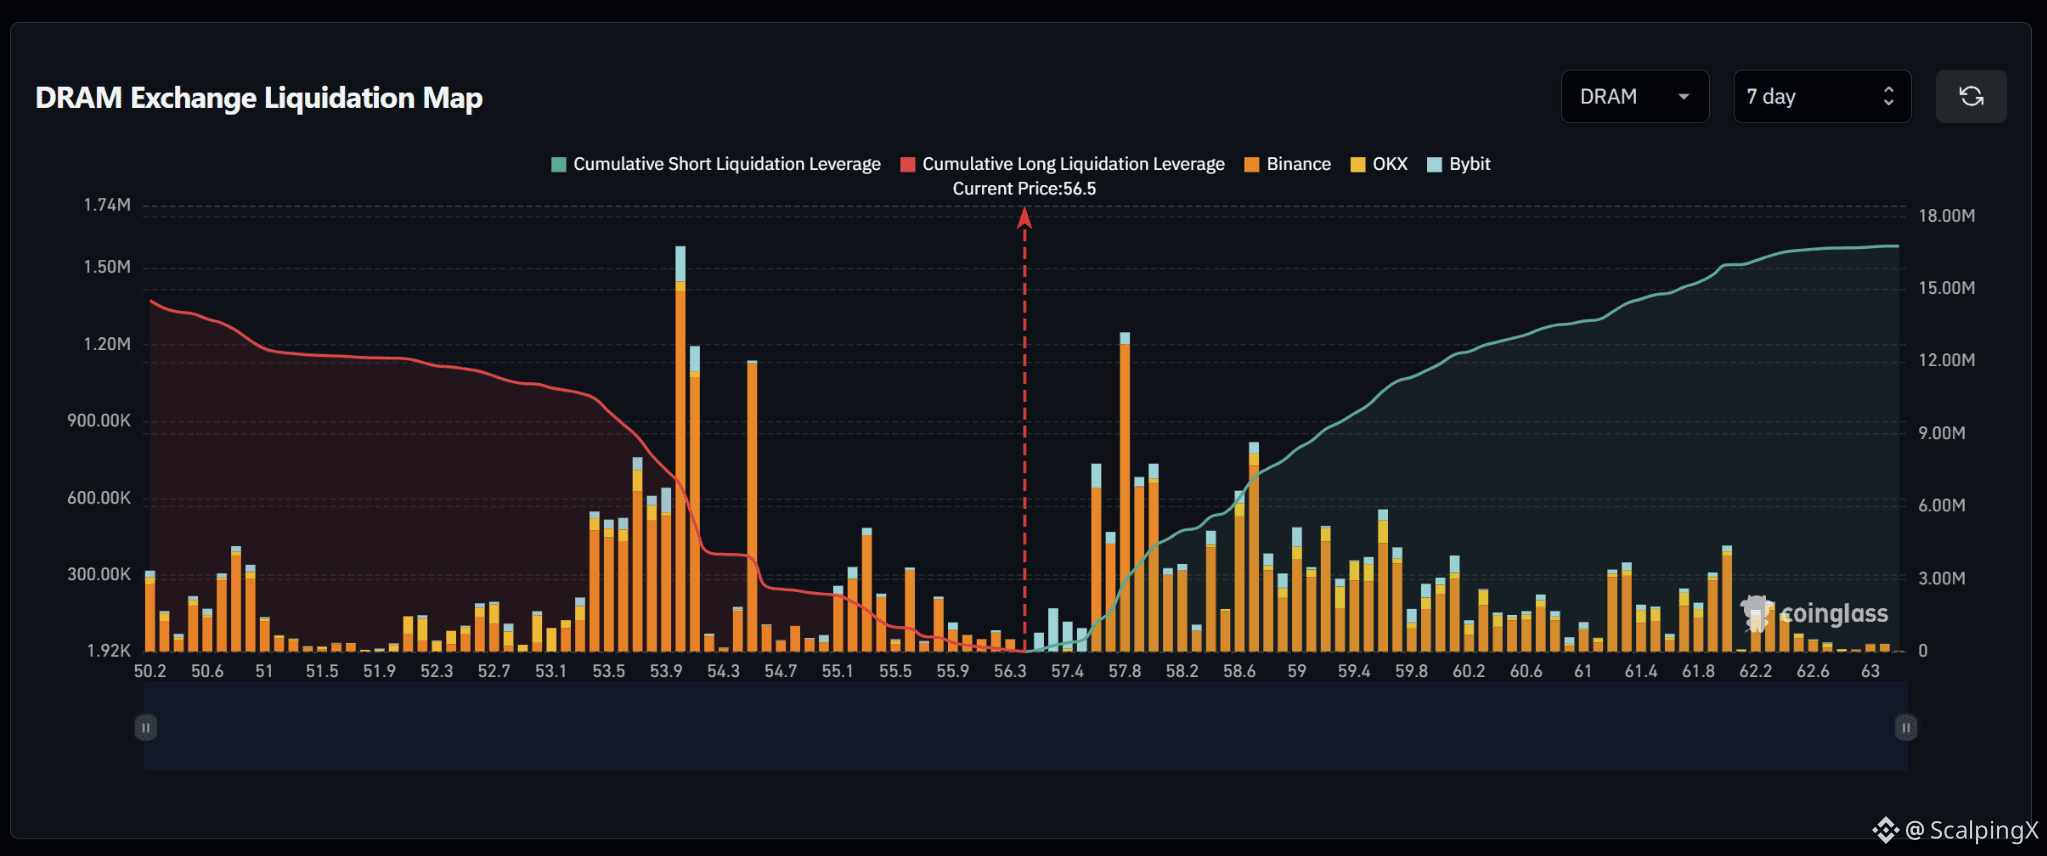
$DRAM – Liquidation Map (7 Days) – Current Price 56.5
🔎 The 7-day liquidation map shows roughly $16 million in short liquidations above the current price, slightly exceeding approximately $14–15 million in long liquidations below. The overall structure is therefore fairly balanced but modestly tilted to the upside.
📉 Below the market, nearby long-liquidation liquidity is concentrated around 55.9–55.1 before becoming much denser across 54.7–53.5. The strongest cluster sits around 53.9–54.3, where the largest liquidation bar reaches roughly $1.6 million. Losing 55.9 would increase the probability of a sweep toward 55.1–54.7 before the larger downside cluster comes into focus.
📈 Above the market, short-liquidation liquidity begins building around 57.4 and increases sharply across 57.8–58.6. The 57.8 cluster stands out with a liquidation bar above $1.2 million, while 58.6 also contains notable liquidity. Further out, 59.0–59.8 continues to hold relatively dense liquidity.
🧭 The broader setup modestly favors the upside because short-liquidation exposure above is larger. Breaking 57.4 would increase the probability of a sweep toward 57.8–58.6, while losing 55.9 would shift attention toward 55.1–54.7.
#LiquidationMap
$DRAM – Liquidation Map (7 Days) – Current Price 56.5
🔎 The 7-day liquidation map shows roughly $16 million in short liquidations above the current price, slightly exceeding approximately $14–15 million in long liquidations below. The overall structure is therefore fairly balanced but modestly tilted to the upside.
📉 Below the market, nearby long-liquidation liquidity is concentrated around 55.9–55.1 before becoming much denser across 54.7–53.5. The strongest cluster sits around 53.9–54.3, where the largest liquidation bar reaches roughly $1.6 million. Losing 55.9 would increase the probability of a sweep toward 55.1–54.7 before the larger downside cluster comes into focus.
📈 Above the market, short-liquidation liquidity begins building around 57.4 and increases sharply across 57.8–58.6. The 57.8 cluster stands out with a liquidation bar above $1.2 million, while 58.6 also contains notable liquidity. Further out, 59.0–59.8 continues to hold relatively dense liquidity.
🧭 The broader setup modestly favors the upside because short-liquidation exposure above is larger. Breaking 57.4 would increase the probability of a sweep toward 57.8–58.6, while losing 55.9 would shift attention toward 55.1–54.7.
#LiquidationMap
🔎 The 7-day liquidation map shows roughly $16 million in short liquidations above the current price, slightly exceeding approximately $14–15 million in long liquidations below. The overall structure is therefore fairly balanced but modestly tilted to the upside.
📉 Below the market, nearby long-liquidation liquidity is concentrated around 55.9–55.1 before becoming much denser across 54.7–53.5. The strongest cluster sits around 53.9–54.3, where the largest liquidation bar reaches roughly $1.6 million. Losing 55.9 would increase the probability of a sweep toward 55.1–54.7 before the larger downside cluster comes into focus.
📈 Above the market, short-liquidation liquidity begins building around 57.4 and increases sharply across 57.8–58.6. The 57.8 cluster stands out with a liquidation bar above $1.2 million, while 58.6 also contains notable liquidity. Further out, 59.0–59.8 continues to hold relatively dense liquidity.
🧭 The broader setup modestly favors the upside because short-liquidation exposure above is larger. Breaking 57.4 would increase the probability of a sweep toward 57.8–58.6, while losing 55.9 would shift attention toward 55.1–54.7.
#LiquidationMap
66
·
--
උසබ තත්ත්වය
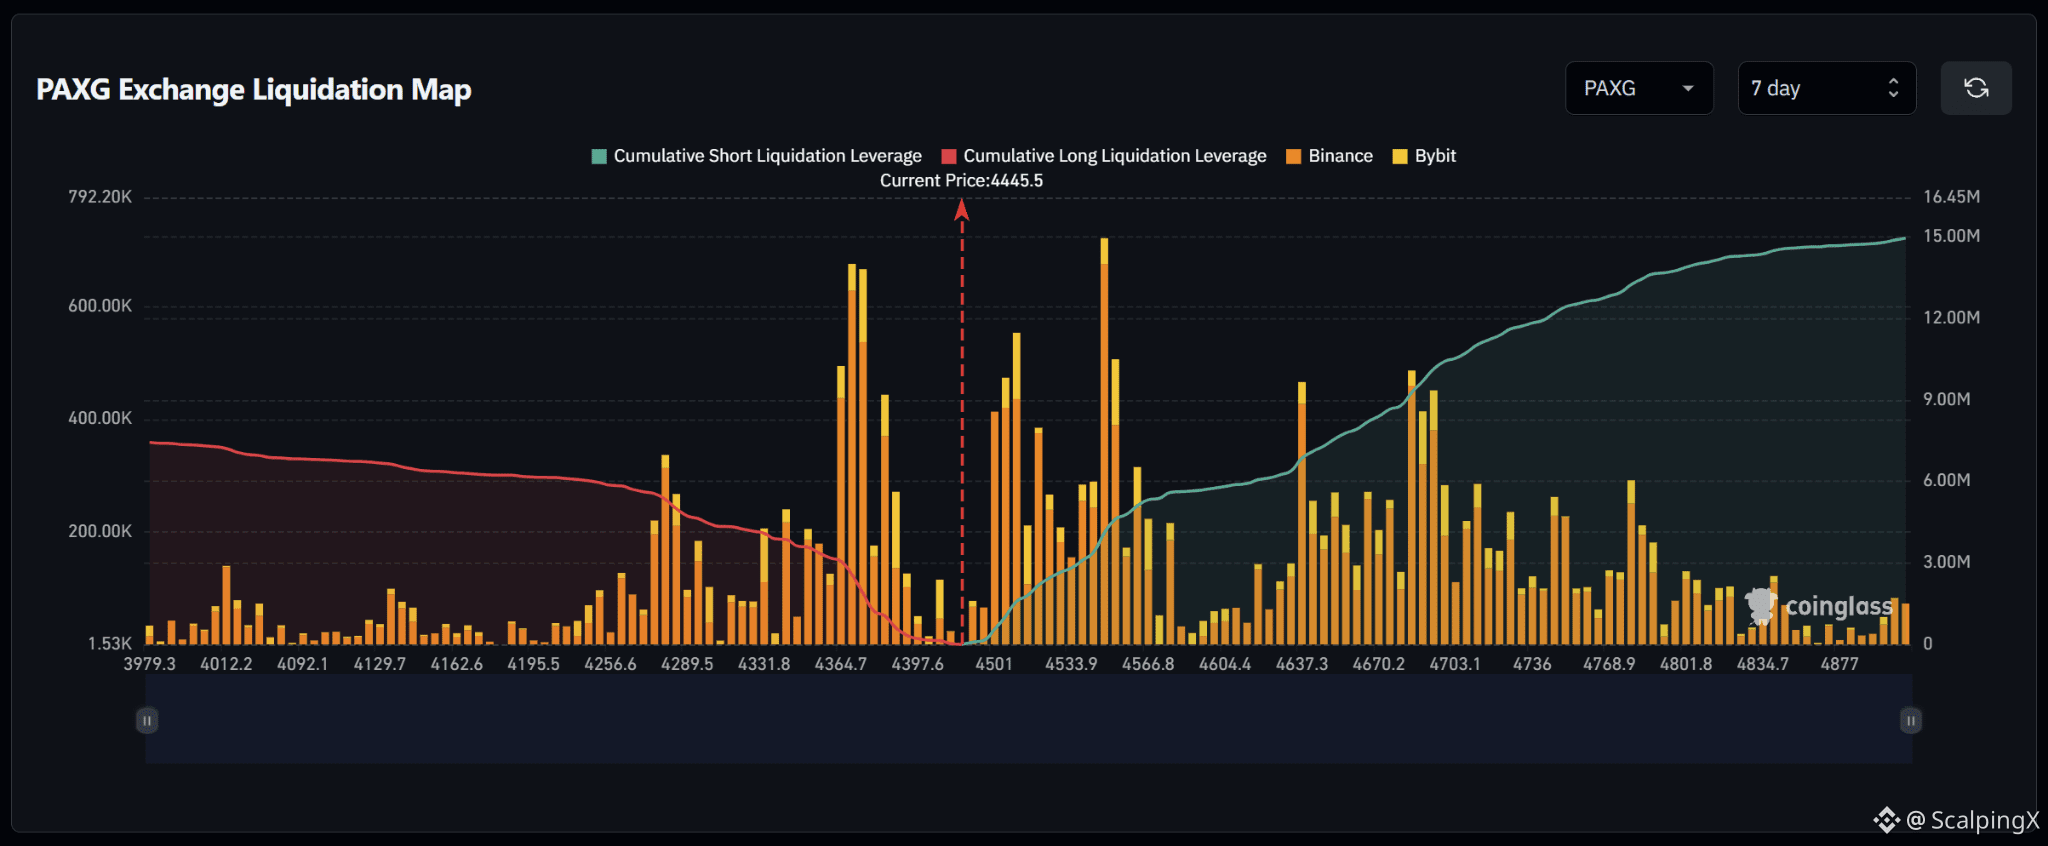
$PAXG – Liquidation Map (7 Days) – Current Price 4,445.5
🔎 The 7-day liquidation map shows roughly $15 million in short liquidations above the current price, significantly exceeding approximately $6.5–7 million in long liquidations below. The liquidity structure therefore clearly favors the upside, with roughly 2.2 times more cumulative liquidity sitting above the market.
📉 Below the market, long-liquidation liquidity is concentrated heavily around 4,397.6–4,364.7. The strongest cluster sits near 4,364.7, where liquidation bars reach roughly $650,000–700,000, while 4,331.8–4,289.5 also contains notable liquidity. Losing 4,397.6 would increase the probability of a sweep toward 4,364.7–4,331.8.
📈 Above the market, short-liquidation liquidity begins building from 4,501 and increases sharply across 4,533.9–4,566.8. The strongest cluster sits around 4,550, where the liquidation bar exceeds $700,000. Further out, 4,637.3–4,703.1 also contains substantial liquidity. A break above 4,501 would bring 4,533.9–4,566.8 into focus next.
🧭 The broader setup favors the upside because short-liquidation exposure above is roughly 2.2 times larger. Breaking 4,501 would increase the probability of a sweep toward 4,533.9–4,566.8, while losing 4,397.6 would shift attention toward 4,364.7–4,331.8.
#LiquidationMap
$PAXG – Liquidation Map (7 Days) – Current Price 4,445.5
🔎 The 7-day liquidation map shows roughly $15 million in short liquidations above the current price, significantly exceeding approximately $6.5–7 million in long liquidations below. The liquidity structure therefore clearly favors the upside, with roughly 2.2 times more cumulative liquidity sitting above the market.
📉 Below the market, long-liquidation liquidity is concentrated heavily around 4,397.6–4,364.7. The strongest cluster sits near 4,364.7, where liquidation bars reach roughly $650,000–700,000, while 4,331.8–4,289.5 also contains notable liquidity. Losing 4,397.6 would increase the probability of a sweep toward 4,364.7–4,331.8.
📈 Above the market, short-liquidation liquidity begins building from 4,501 and increases sharply across 4,533.9–4,566.8. The strongest cluster sits around 4,550, where the liquidation bar exceeds $700,000. Further out, 4,637.3–4,703.1 also contains substantial liquidity. A break above 4,501 would bring 4,533.9–4,566.8 into focus next.
🧭 The broader setup favors the upside because short-liquidation exposure above is roughly 2.2 times larger. Breaking 4,501 would increase the probability of a sweep toward 4,533.9–4,566.8, while losing 4,397.6 would shift attention toward 4,364.7–4,331.8.
#LiquidationMap
🔎 The 7-day liquidation map shows roughly $15 million in short liquidations above the current price, significantly exceeding approximately $6.5–7 million in long liquidations below. The liquidity structure therefore clearly favors the upside, with roughly 2.2 times more cumulative liquidity sitting above the market.
📉 Below the market, long-liquidation liquidity is concentrated heavily around 4,397.6–4,364.7. The strongest cluster sits near 4,364.7, where liquidation bars reach roughly $650,000–700,000, while 4,331.8–4,289.5 also contains notable liquidity. Losing 4,397.6 would increase the probability of a sweep toward 4,364.7–4,331.8.
📈 Above the market, short-liquidation liquidity begins building from 4,501 and increases sharply across 4,533.9–4,566.8. The strongest cluster sits around 4,550, where the liquidation bar exceeds $700,000. Further out, 4,637.3–4,703.1 also contains substantial liquidity. A break above 4,501 would bring 4,533.9–4,566.8 into focus next.
🧭 The broader setup favors the upside because short-liquidation exposure above is roughly 2.2 times larger. Breaking 4,501 would increase the probability of a sweep toward 4,533.9–4,566.8, while losing 4,397.6 would shift attention toward 4,364.7–4,331.8.
#LiquidationMap
26
තවත් අන්තර්ගතයන් ගවේෂණය කිරීමට ඇතුල් වන්න
Binance චතුරශ්රය හි ගෝලීය ක්රිප්ටෝ පරිශීලකයින් හා එක්වන්න
⚡️ ක්රිප්ටෝ පිළිබඳ නවතම සහ ප්රයෝජනවත් තොරතුරු ලබා ගන්න.
💬 ලොව විශාලතම ක්රිප්ටෝ හුවමාරුව මගින් විශ්වාස කෙරේ.
👍 සත්යායනය කරන ලද නිර්මාණකරුවන්ගෙන් සැබෑ විදසුන් සොයා ගන්න.
විද්යුත් තැපෑල / දුරකථන අංකය
නැගී එන මාතෘකා
1
#UKFCAWinsCourtOrderToRecover851400Pounds
33,332 views
776 සාකච්ඡා කරමින්
2
#ChainlinkLaunchesCCIP2WithEnterpriseVerification
46,834 views
950 සාකච්ඡා කරමින්
3
#GoldFallsTo$4144
16,182 views
164 සාකච්ඡා කරමින්
4
#QNTFallsOver40%FromMorningHigh
93,435 views
1,365 සාකච්ඡා කරමින්
5
#USDTAdds845900HoldersInPast7Days
18,766 views
421 සාකච්ඡා කරමින්
6
#KospiFalls2.7%SamsungSKHynixDropOver5%
31,900 views
603 සාකච්ඡා කරමින්
7
#BitgetCEOConfirms$388MStolenInHack
5,479 views
43 සාකච්ඡා කරමින්
8
#BTCFallsBelow$83000
33,527 views
167 සාකච්ඡා කරමින්
9
#BitgetDetailsSecurityIncidentTimeline
53,118 views
747 සාකච්ඡා කරමින්
10
#BitcoinSpotETFs$2.39BWeeklyNetInflow
15,679 views
49 සාකච්ඡා කරමින්