
#indicator
indicator
64,364 views
230 සාකච්ඡා කරමින්
උණුසුම්
නවතම

·
--
පරිවර්තනය බලන්න
--
**Selling the full source code to a Pine Script indicator suite. One buyer, exclusive.**
I built a trading indicator — a three-tier ICT/SMC system for TradingView. I'm selling the whole thing outright: full rights, complete codebase, no copies retained, no version left on the market.
**What's included:**
- Three tiers — V6 (ICT foundation), V8 (structure + context), V10 (full quant engine)
- 14-point confluence scoring, three signal tiers (Base / Quality / Elite)
- Regime detection: TREND / RANGE / BREAKOUT / CRISIS
- CRISIS mode — kills all signals when realised volatility exceeds ~2.5x its 100-bar average. No override, no setting to disable it
- Capital circuit breaker — scales sizing toward zero when live expectancy drops below breakeven
- Fee-adjusted expectancy tracking and fractional Kelly sizing
- Hydra Coach — plain-English on-chart explanation layer with Learn Mode
- Node.js/Express webhook server: TradingView alerts → formatted analysis → Telegram delivery
- 23-page product manual, 20-page trading fundamentals guide, brand assets and site
**Who this is for:** affiliates, copy-trading lead traders, and educators who already have an audience. You rebrand it as yours. It becomes your retention asset — your people get a tool, you get the code and the roadmap.
**What I'm not claiming:** no verified track record, no published win rate, no backtest I'm asking you to take on faith. Audit the code yourself before any money moves. I'll grant chart access and walk you through every line.
Open to structured terms for the right buyer.
DM for a code walkthrough.
#indicator
--
**Selling the full source code to a Pine Script indicator suite. One buyer, exclusive.**
I built a trading indicator — a three-tier ICT/SMC system for TradingView. I'm selling the whole thing outright: full rights, complete codebase, no copies retained, no version left on the market.
**What's included:**
- Three tiers — V6 (ICT foundation), V8 (structure + context), V10 (full quant engine)
- 14-point confluence scoring, three signal tiers (Base / Quality / Elite)
- Regime detection: TREND / RANGE / BREAKOUT / CRISIS
- CRISIS mode — kills all signals when realised volatility exceeds ~2.5x its 100-bar average. No override, no setting to disable it
- Capital circuit breaker — scales sizing toward zero when live expectancy drops below breakeven
- Fee-adjusted expectancy tracking and fractional Kelly sizing
- Hydra Coach — plain-English on-chart explanation layer with Learn Mode
- Node.js/Express webhook server: TradingView alerts → formatted analysis → Telegram delivery
- 23-page product manual, 20-page trading fundamentals guide, brand assets and site
**Who this is for:** affiliates, copy-trading lead traders, and educators who already have an audience. You rebrand it as yours. It becomes your retention asset — your people get a tool, you get the code and the roadmap.
**What I'm not claiming:** no verified track record, no published win rate, no backtest I'm asking you to take on faith. Audit the code yourself before any money moves. I'll grant chart access and walk you through every line.
Open to structured terms for the right buyer.
DM for a code walkthrough.
#indicator
**Selling the full source code to a Pine Script indicator suite. One buyer, exclusive.**
I built a trading indicator — a three-tier ICT/SMC system for TradingView. I'm selling the whole thing outright: full rights, complete codebase, no copies retained, no version left on the market.
**What's included:**
- Three tiers — V6 (ICT foundation), V8 (structure + context), V10 (full quant engine)
- 14-point confluence scoring, three signal tiers (Base / Quality / Elite)
- Regime detection: TREND / RANGE / BREAKOUT / CRISIS
- CRISIS mode — kills all signals when realised volatility exceeds ~2.5x its 100-bar average. No override, no setting to disable it
- Capital circuit breaker — scales sizing toward zero when live expectancy drops below breakeven
- Fee-adjusted expectancy tracking and fractional Kelly sizing
- Hydra Coach — plain-English on-chart explanation layer with Learn Mode
- Node.js/Express webhook server: TradingView alerts → formatted analysis → Telegram delivery
- 23-page product manual, 20-page trading fundamentals guide, brand assets and site
**Who this is for:** affiliates, copy-trading lead traders, and educators who already have an audience. You rebrand it as yours. It becomes your retention asset — your people get a tool, you get the code and the roadmap.
**What I'm not claiming:** no verified track record, no published win rate, no backtest I'm asking you to take on faith. Audit the code yourself before any money moves. I'll grant chart access and walk you through every line.
Open to structured terms for the right buyer.
DM for a code walkthrough.
#indicator
78

·
--
පරිවර්තනය බලන්න
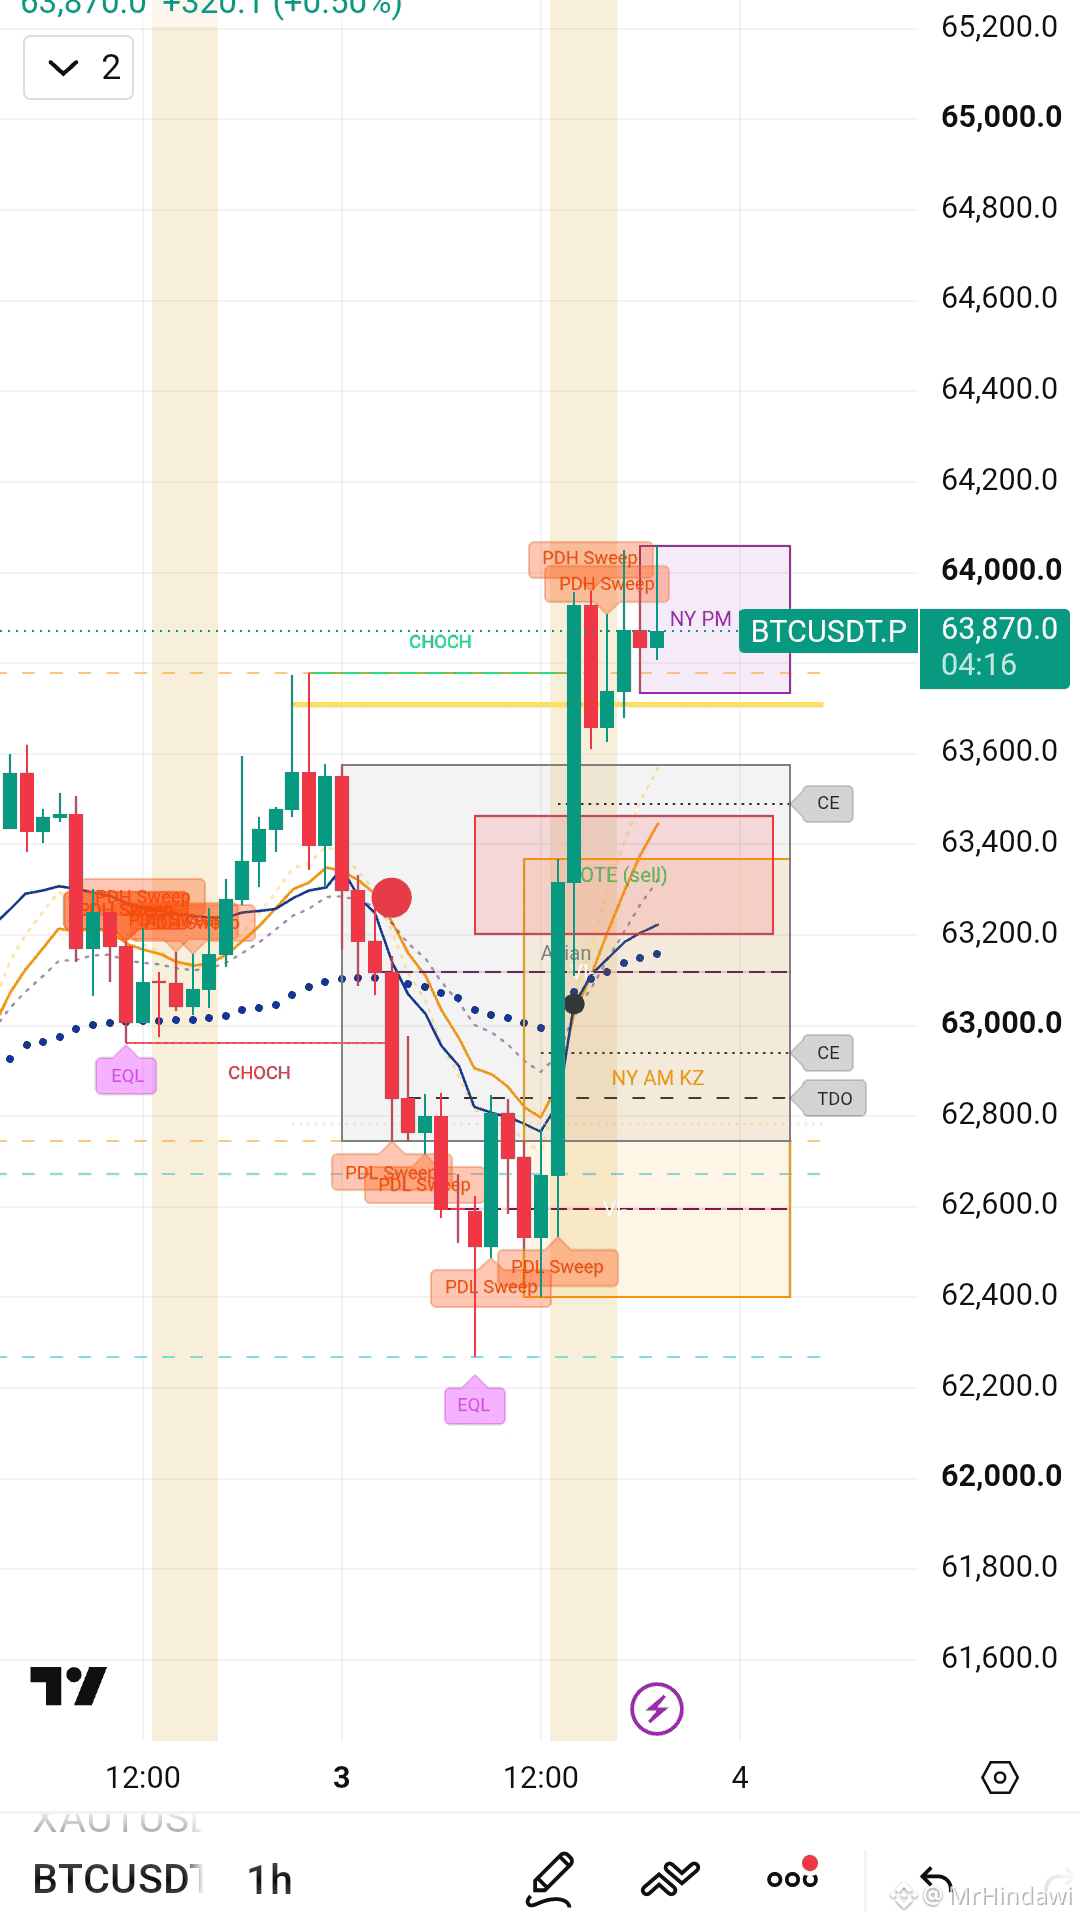
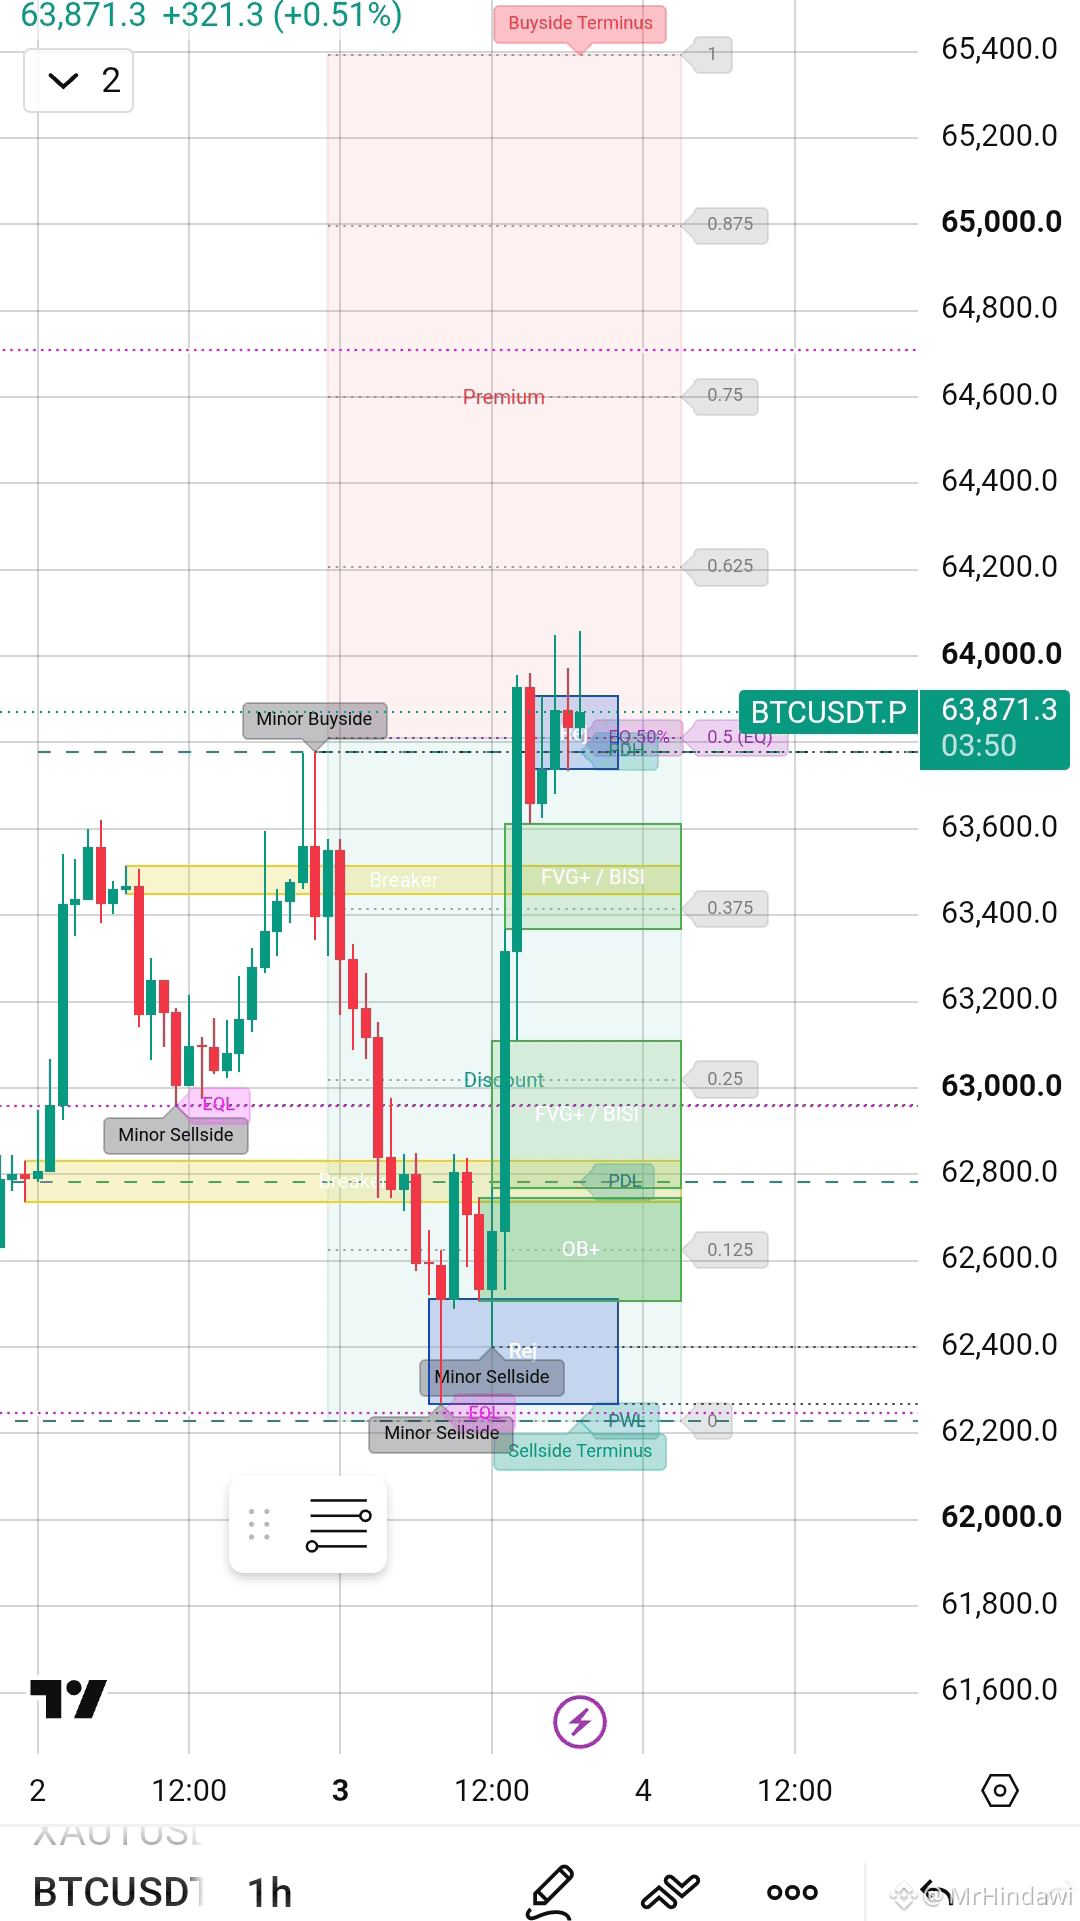
Finnaly my indicators get into lights
Mastry ict concepts indicators
Hard working gets you to wounderfull area 🧸🎯
If you ask me how to trade i will mention this pure work.
$BTC
#indicator
Finnaly my indicators get into lights
Mastry ict concepts indicators
Hard working gets you to wounderfull area 🧸🎯
If you ask me how to trade i will mention this pure work.
$BTC
#indicator
Mastry ict concepts indicators
Hard working gets you to wounderfull area 🧸🎯
If you ask me how to trade i will mention this pure work.
$BTC
#indicator
87

·
--
උසබ තත්ත්වය
පරිවර්තනය බලන්න
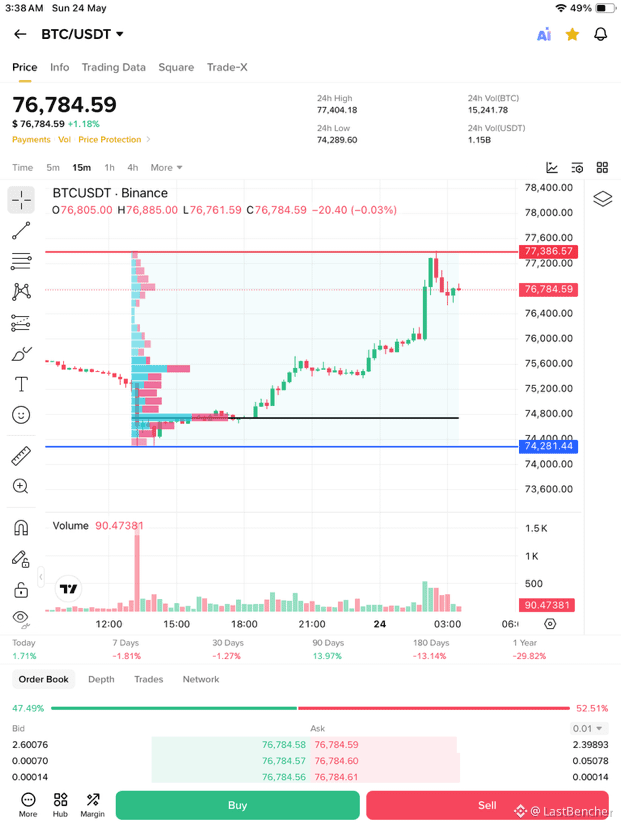
Fixed Range Volume Profile Indicator
The Fixed Range Volume Profile shows how much buying and selling happened at different price levels inside a selected range.
🔵 Blue = Buying volume
🔴 Pink = Selling volume
📏 Bigger bar = More volume traded at that price
How to Draw It
📈 Uptrend:
Draw from the swing low to the swing high.
📉 Downtrend:
Draw from the swing high to the swing low.
How to Use It
✅ High-volume zones = Strong support/resistance
✅ Low-volume zones = Price moves fast through them
✅ POC (biggest bar) = Most traded price level
Trading Idea
* Price above POC = Bullish
* Price below POC = Bearish
* Retest of high-volume zone + rejection = possible entry
Volume Profile basically shows:
“Where the market traded the most and is likely to come back.”
#LONG #SHORT #TRADE #SIGNAL #INDICATOR
📈 Trade Now $BTC
{future}(BTCUSDT)
Fixed Range Volume Profile Indicator
The Fixed Range Volume Profile shows how much buying and selling happened at different price levels inside a selected range.
🔵 Blue = Buying volume
🔴 Pink = Selling volume
📏 Bigger bar = More volume traded at that price
How to Draw It
📈 Uptrend:
Draw from the swing low to the swing high.
📉 Downtrend:
Draw from the swing high to the swing low.
How to Use It
✅ High-volume zones = Strong support/resistance
✅ Low-volume zones = Price moves fast through them
✅ POC (biggest bar) = Most traded price level
Trading Idea
* Price above POC = Bullish
* Price below POC = Bearish
* Retest of high-volume zone + rejection = possible entry
Volume Profile basically shows:
“Where the market traded the most and is likely to come back.”
#LONG #SHORT #TRADE #SIGNAL #INDICATOR
📈 Trade Now $BTC
The Fixed Range Volume Profile shows how much buying and selling happened at different price levels inside a selected range.
🔵 Blue = Buying volume
🔴 Pink = Selling volume
📏 Bigger bar = More volume traded at that price
How to Draw It
📈 Uptrend:
Draw from the swing low to the swing high.
📉 Downtrend:
Draw from the swing high to the swing low.
How to Use It
✅ High-volume zones = Strong support/resistance
✅ Low-volume zones = Price moves fast through them
✅ POC (biggest bar) = Most traded price level
Trading Idea
* Price above POC = Bullish
* Price below POC = Bearish
* Retest of high-volume zone + rejection = possible entry
Volume Profile basically shows:
“Where the market traded the most and is likely to come back.”
#LONG #SHORT #TRADE #SIGNAL #INDICATOR
📈 Trade Now $BTC
129
·
--
බෙයාරිෂ්
පරිවර්තනය බලන්න
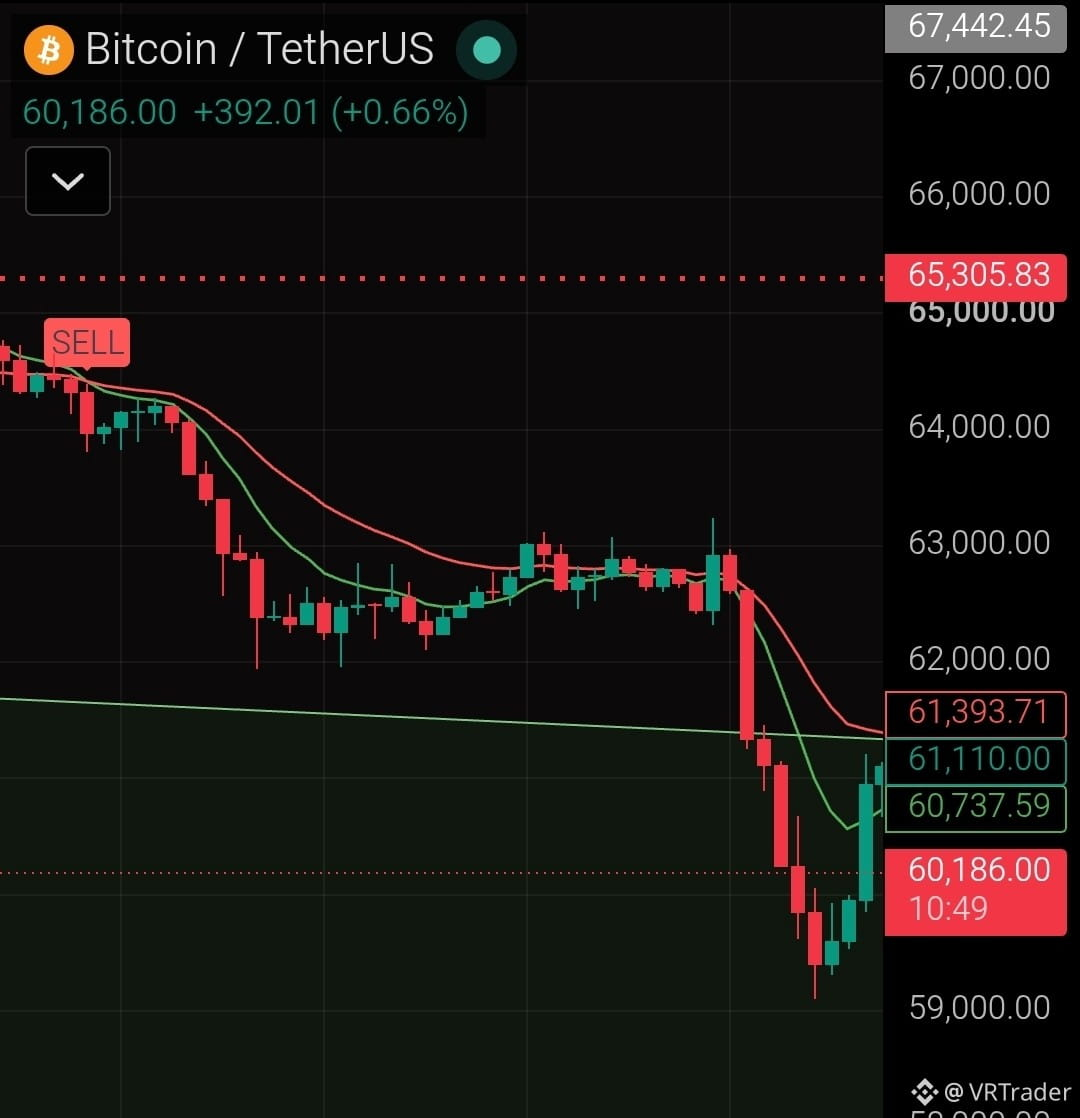
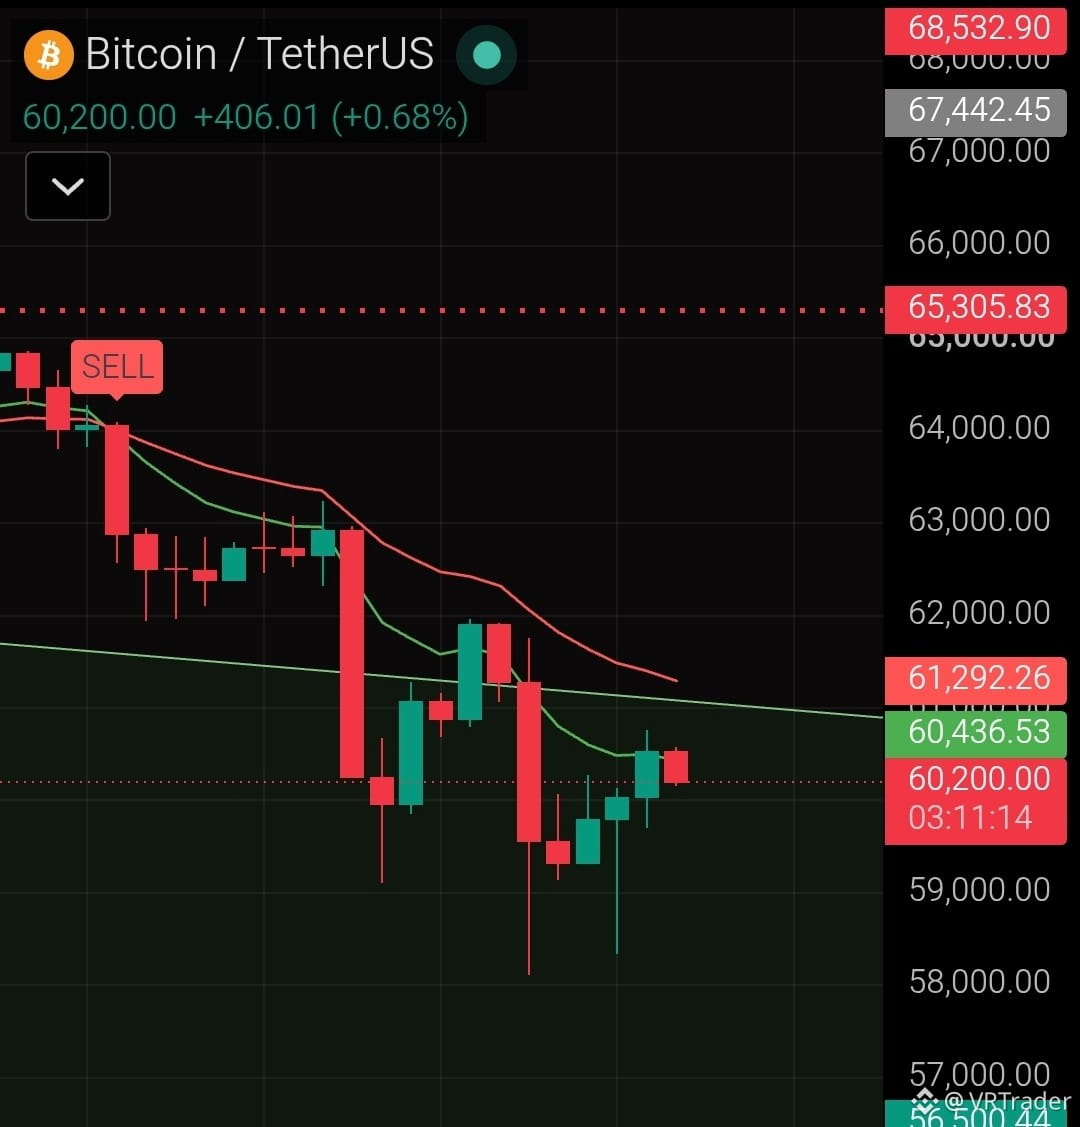
I developed this brilliant indicator that managed to predict $BTC fall long before the actual dump.
{future}(BTCUSDT)
It didn't predict not just once or twice, it's working very nicely on any chart.
No buy signal so far so we're still in the bear run. 📉
DYOR #Binance #BTC #indicator $NVDAB $SIREN
I developed this brilliant indicator that managed to predict $BTC fall long before the actual dump.
It didn't predict not just once or twice, it's working very nicely on any chart.
No buy signal so far so we're still in the bear run. 📉
DYOR #Binance #BTC #indicator $NVDAB $SIREN
It didn't predict not just once or twice, it's working very nicely on any chart.
No buy signal so far so we're still in the bear run. 📉
DYOR #Binance #BTC #indicator $NVDAB $SIREN
1
316

·
--
උසබ තත්ත්වය
පරිවර්තනය බලන්න
$BTC
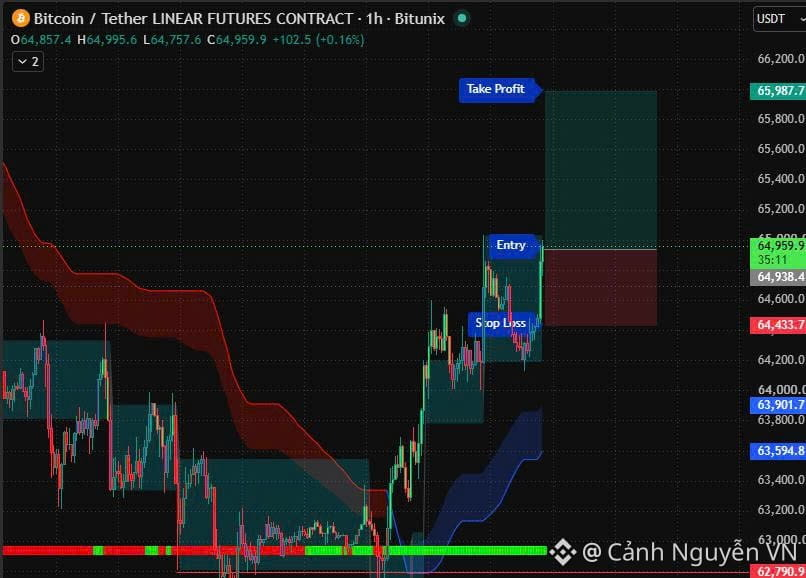
Vùng vào lệnh (Entry): Khoảng 64,938.4 USDT
Điểm dừng lỗ (Stop Loss - SL): 64,433.7 USDT
Điểm chốt lời (Take Profit - TP): 65,987.7 USDT
Tỷ lệ R:R (Risk/Reward): Khoảng 1:2 (Mức rủi ro 1 phần để đổi lấy lợi nhuận 2 phần, đây là tỷ lệ quản lý vốn tốt).
2. Phân tích cấu trúc kỹ thuật trên biểu đồ
Xu hướng ngắn hạn: Giá vừa trải qua một đợt sóng tăng mạnh từ vùng đáy cũ (khoảng 63,000 USDT) và bứt phá lên trên dải mây màu đỏ (chuyển sang xanh/xám tùy chỉ báo). Điều này cho thấy lực mua đang chiếm ưu thế trong ngắn hạn.
Hỗ trợ và Kháng cự:
Hỗ trợ: Đường màu xanh lá cây đậm nằm ngang ở vùng 63,000 USDT là một ngưỡng hỗ trợ cứng (đáy cũ kiểm chứng nhiều lần). Điểm SL được đặt ngay dưới một cụm nến rút chân gần nhất (khoảng 64,400 USDT) để bảo vệ vị thế nếu giá đảo chiều sâu hơn.
Kháng cự: Vùng chốt lời (TP) được đặt ngay dưới đỉnh cũ trước đó (vùng nến đỏ phía bên trái). Đây là mục tiêu hợp lý vì giá thường có xu hướng kiểm tra lại các vùng đỉnh cũ trước khi quyết định xu hướng tiếp theo
#45NgayTuDoTaiChinh #indicator
Tham gia vào nhóm trên trang cá nhân để nhận tin hiệu và tin tức nhanh nhất
$BTC
Vùng vào lệnh (Entry): Khoảng 64,938.4 USDT
Điểm dừng lỗ (Stop Loss - SL): 64,433.7 USDT
Điểm chốt lời (Take Profit - TP): 65,987.7 USDT
Tỷ lệ R:R (Risk/Reward): Khoảng 1:2 (Mức rủi ro 1 phần để đổi lấy lợi nhuận 2 phần, đây là tỷ lệ quản lý vốn tốt).
2. Phân tích cấu trúc kỹ thuật trên biểu đồ
Xu hướng ngắn hạn: Giá vừa trải qua một đợt sóng tăng mạnh từ vùng đáy cũ (khoảng 63,000 USDT) và bứt phá lên trên dải mây màu đỏ (chuyển sang xanh/xám tùy chỉ báo). Điều này cho thấy lực mua đang chiếm ưu thế trong ngắn hạn.
Hỗ trợ và Kháng cự:
Hỗ trợ: Đường màu xanh lá cây đậm nằm ngang ở vùng 63,000 USDT là một ngưỡng hỗ trợ cứng (đáy cũ kiểm chứng nhiều lần). Điểm SL được đặt ngay dưới một cụm nến rút chân gần nhất (khoảng 64,400 USDT) để bảo vệ vị thế nếu giá đảo chiều sâu hơn.
Kháng cự: Vùng chốt lời (TP) được đặt ngay dưới đỉnh cũ trước đó (vùng nến đỏ phía bên trái). Đây là mục tiêu hợp lý vì giá thường có xu hướng kiểm tra lại các vùng đỉnh cũ trước khi quyết định xu hướng tiếp theo
#45NgayTuDoTaiChinh #indicator
Tham gia vào nhóm trên trang cá nhân để nhận tin hiệu và tin tức nhanh nhất
Vùng vào lệnh (Entry): Khoảng 64,938.4 USDT
Điểm dừng lỗ (Stop Loss - SL): 64,433.7 USDT
Điểm chốt lời (Take Profit - TP): 65,987.7 USDT
Tỷ lệ R:R (Risk/Reward): Khoảng 1:2 (Mức rủi ro 1 phần để đổi lấy lợi nhuận 2 phần, đây là tỷ lệ quản lý vốn tốt).
2. Phân tích cấu trúc kỹ thuật trên biểu đồ
Xu hướng ngắn hạn: Giá vừa trải qua một đợt sóng tăng mạnh từ vùng đáy cũ (khoảng 63,000 USDT) và bứt phá lên trên dải mây màu đỏ (chuyển sang xanh/xám tùy chỉ báo). Điều này cho thấy lực mua đang chiếm ưu thế trong ngắn hạn.
Hỗ trợ và Kháng cự:
Hỗ trợ: Đường màu xanh lá cây đậm nằm ngang ở vùng 63,000 USDT là một ngưỡng hỗ trợ cứng (đáy cũ kiểm chứng nhiều lần). Điểm SL được đặt ngay dưới một cụm nến rút chân gần nhất (khoảng 64,400 USDT) để bảo vệ vị thế nếu giá đảo chiều sâu hơn.
Kháng cự: Vùng chốt lời (TP) được đặt ngay dưới đỉnh cũ trước đó (vùng nến đỏ phía bên trái). Đây là mục tiêu hợp lý vì giá thường có xu hướng kiểm tra lại các vùng đỉnh cũ trước khi quyết định xu hướng tiếp theo
#45NgayTuDoTaiChinh #indicator
Tham gia vào nhóm trên trang cá nhân để nhận tin hiệu và tin tức nhanh nhất
4
270
ලිපිය
පරිවර්තනය බලන්න
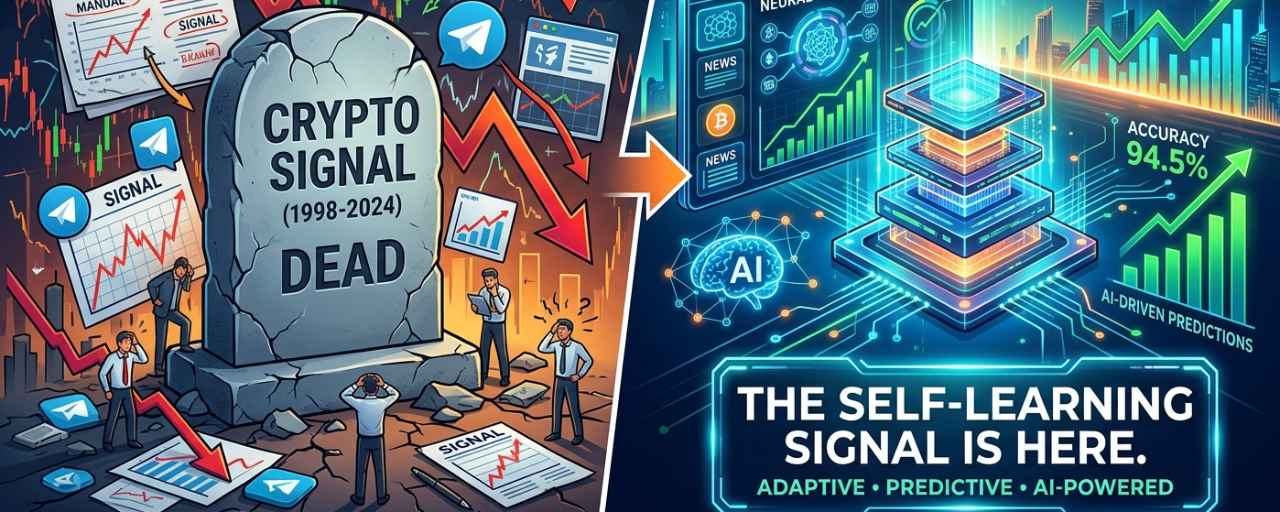
The Crypto Signal Is Dead. The Self-Learning Signal Is Here.For years, crypto trading has followed the same model.
A trader finds an #indicator .
A developer turns it into a #strategy .
The strategy generates a #SİGNAL .
And when the market changes?
The strategy stays the same.
That may be the biggest problem with traditional crypto signals.
Markets evolve.
But most signal systems don't.
So we decided to build something fundamentally different.
What if a trading system could learn from its own decisions?
Imagine a system that doesn't simply generate a signal and move on.
Instead, every signal becomes a lesson.
Every market condition becomes data.
Every outcome becomes feedback.
And every completed trade adds another piece to the system's understanding of the market.
That is the idea behind Crypto AI Pro.
This isn't just another crypto scanner.
A traditional scanner might look at:
RSI → MACD → EMA → Signal
Our approach is different.
The system looks at the market as a constantly changing environment.
It can analyze:
• $BTC market direction
• Multiple timeframes
• Trend structure
• Momentum
• Volatility
• EMA relationships
• RSI / MACD
• Market regime
• Coin-specific conditions
• Entry conditions
• Risk parameters
• Signal score
• And, most importantly, the eventual outcome
The system doesn't just ask:
“Can I open a trade?”
It asks:
“What is happening in the market, and does this setup make sense in this environment?”
🔄 The part that changes everything
Here's where the architecture becomes fundamentally different.
A signal is generated.
Then the market decides what happens next.
Maybe TP1 is reached.
Maybe the trade hits SL.
Maybe the market moves sideways.
Maybe the setup becomes invalid.
Whatever happens, the system can record the conditions that existed before the decision and the result that followed.
That creates a feedback loop:
Market Data → Signal → Outcome → Dataset → Learning → Better Selection
And then the cycle starts again.
This means the system isn't designed to remain frozen in time.
Its historical experience grows.
🧠 From rules to experience
Think about the difference between these two systems.
System A
“If RSI is below X, consider Long.”
Simple.
Predictable.
Static.
System B
“Under similar market conditions, with this BTC structure, this volatility regime, this trend alignment and these coin-specific characteristics, how have comparable setups historically performed?”
That's a completely different question.
And potentially a much more powerful one.
Because the system isn't looking at a single indicator.
It's looking for relationships between conditions and outcomes.
The Market Becomes the Teacher
This is the part we believe could change the way crypto signal systems are built.
Instead of developers constantly trying to guess which rules will work next month, the system can continuously collect new market examples.
The market produces the data.
The trades produce the outcomes.
The dataset grows.
And the model has more information to work with.
The market becomes the teacher.
📊 150+ Coins. One Decision Engine.
Crypto doesn't give traders a shortage of opportunities.
It gives them too many.
Hundreds of coins.
Thousands of possible setups.
Multiple timeframes.
Different market conditions.
Trying to manually process all of this is simply unrealistic.
Our system is designed to scan a large universe of cryptocurrencies and continuously search for opportunities.
But scanning more coins isn't the objective.
Finding better candidates is.
The system can rank opportunities instead of treating every setup equally.
Strong conditions move up.
Weak conditions move down.
Bad conditions can be rejected entirely.
And sometimes the best signal is:
No signal.
The Next Generation of Crypto Trading
We believe the next generation of trading systems won't simply be:
faster.
They will be:
more adaptive.
The difference is important.
A faster system can process more information.
An adaptive system can use historical information to improve how it evaluates new situations.
That's the direction we're building toward.
Not an AI that magically predicts the future.
That doesn't exist.
Not a machine that guarantees profits.
It doesn't exist either.
Instead:
A system that continuously collects evidence, evaluates outcomes and improves its decision-making process.
🚀 Why We Think This Matters
The crypto market has changed dramatically over the last few years.
More traders.
More algorithms.
More liquidity.
More assets.
More information.
And increasingly sophisticated market participants.
Using yesterday's rules to trade tomorrow's market isn't necessarily a competitive advantage.
The real advantage may come from building systems capable of learning from yesterday while adapting to tomorrow.
That's the bigger idea behind Crypto AI Pro.
We're not trying to build another signal generator.
We're building an evolving trading intelligence layer.
One that can observe.
Analyze.
Decide.
Measure.
Learn.
And repeat.
The Signal Was Never the Product.
The learning system is.
Every signal creates data.
Every result creates feedback.
Every new market condition creates another test.
And every cycle gives the system another opportunity to improve how it searches for the next setup.
This is still being developed.
Still being tested.
Still evolving.
But we believe this architecture represents a fundamentally different direction for crypto signal technology.
The future of crypto trading may not belong to systems that know the most rules.
It may belong to systems that learn the fastest. 🤖📈
The Crypto Signal Is Dead. The Self-Learning Signal Is Here.
For years, crypto trading has followed the same model.
A trader finds an #indicator .
A developer turns it into a #strategy .
The strategy generates a #SİGNAL .
And when the market changes?
The strategy stays the same.
That may be the biggest problem with traditional crypto signals.
Markets evolve.
But most signal systems don't.
So we decided to build something fundamentally different.
What if a trading system could learn from its own decisions?
Imagine a system that doesn't simply generate a signal and move on.
Instead, every signal becomes a lesson.
Every market condition becomes data.
Every outcome becomes feedback.
And every completed trade adds another piece to the system's understanding of the market.
That is the idea behind Crypto AI Pro.
This isn't just another crypto scanner.
A traditional scanner might look at:
RSI → MACD → EMA → Signal
Our approach is different.
The system looks at the market as a constantly changing environment.
It can analyze:
• $BTC market direction
• Multiple timeframes
• Trend structure
• Momentum
• Volatility
• EMA relationships
• RSI / MACD
• Market regime
• Coin-specific conditions
• Entry conditions
• Risk parameters
• Signal score
• And, most importantly, the eventual outcome
The system doesn't just ask:
“Can I open a trade?”
It asks:
“What is happening in the market, and does this setup make sense in this environment?”
🔄 The part that changes everything
Here's where the architecture becomes fundamentally different.
A signal is generated.
Then the market decides what happens next.
Maybe TP1 is reached.
Maybe the trade hits SL.
Maybe the market moves sideways.
Maybe the setup becomes invalid.
Whatever happens, the system can record the conditions that existed before the decision and the result that followed.
That creates a feedback loop:
Market Data → Signal → Outcome → Dataset → Learning → Better Selection
And then the cycle starts again.
This means the system isn't designed to remain frozen in time.
Its historical experience grows.
🧠 From rules to experience
Think about the difference between these two systems.
System A
“If RSI is below X, consider Long.”
Simple.
Predictable.
Static.
System B
“Under similar market conditions, with this BTC structure, this volatility regime, this trend alignment and these coin-specific characteristics, how have comparable setups historically performed?”
That's a completely different question.
And potentially a much more powerful one.
Because the system isn't looking at a single indicator.
It's looking for relationships between conditions and outcomes.
The Market Becomes the Teacher
This is the part we believe could change the way crypto signal systems are built.
Instead of developers constantly trying to guess which rules will work next month, the system can continuously collect new market examples.
The market produces the data.
The trades produce the outcomes.
The dataset grows.
And the model has more information to work with.
The market becomes the teacher.
📊 150+ Coins. One Decision Engine.
Crypto doesn't give traders a shortage of opportunities.
It gives them too many.
Hundreds of coins.
Thousands of possible setups.
Multiple timeframes.
Different market conditions.
Trying to manually process all of this is simply unrealistic.
Our system is designed to scan a large universe of cryptocurrencies and continuously search for opportunities.
But scanning more coins isn't the objective.
Finding better candidates is.
The system can rank opportunities instead of treating every setup equally.
Strong conditions move up.
Weak conditions move down.
Bad conditions can be rejected entirely.
And sometimes the best signal is:
No signal.
The Next Generation of Crypto Trading
We believe the next generation of trading systems won't simply be:
faster.
They will be:
more adaptive.
The difference is important.
A faster system can process more information.
An adaptive system can use historical information to improve how it evaluates new situations.
That's the direction we're building toward.
Not an AI that magically predicts the future.
That doesn't exist.
Not a machine that guarantees profits.
It doesn't exist either.
Instead:
A system that continuously collects evidence, evaluates outcomes and improves its decision-making process.
🚀 Why We Think This Matters
The crypto market has changed dramatically over the last few years.
More traders.
More algorithms.
More liquidity.
More assets.
More information.
And increasingly sophisticated market participants.
Using yesterday's rules to trade tomorrow's market isn't necessarily a competitive advantage.
The real advantage may come from building systems capable of learning from yesterday while adapting to tomorrow.
That's the bigger idea behind Crypto AI Pro.
We're not trying to build another signal generator.
We're building an evolving trading intelligence layer.
One that can observe.
Analyze.
Decide.
Measure.
Learn.
And repeat.
The Signal Was Never the Product.
The learning system is.
Every signal creates data.
Every result creates feedback.
Every new market condition creates another test.
And every cycle gives the system another opportunity to improve how it searches for the next setup.
This is still being developed.
Still being tested.
Still evolving.
But we believe this architecture represents a fundamentally different direction for crypto signal technology.
The future of crypto trading may not belong to systems that know the most rules.
It may belong to systems that learn the fastest. 🤖📈
A trader finds an #indicator .
A developer turns it into a #strategy .
The strategy generates a #SİGNAL .
And when the market changes?
The strategy stays the same.
That may be the biggest problem with traditional crypto signals.
Markets evolve.
But most signal systems don't.
So we decided to build something fundamentally different.
What if a trading system could learn from its own decisions?
Imagine a system that doesn't simply generate a signal and move on.
Instead, every signal becomes a lesson.
Every market condition becomes data.
Every outcome becomes feedback.
And every completed trade adds another piece to the system's understanding of the market.
That is the idea behind Crypto AI Pro.
This isn't just another crypto scanner.
A traditional scanner might look at:
RSI → MACD → EMA → Signal
Our approach is different.
The system looks at the market as a constantly changing environment.
It can analyze:
• $BTC market direction
• Multiple timeframes
• Trend structure
• Momentum
• Volatility
• EMA relationships
• RSI / MACD
• Market regime
• Coin-specific conditions
• Entry conditions
• Risk parameters
• Signal score
• And, most importantly, the eventual outcome
The system doesn't just ask:
“Can I open a trade?”
It asks:
“What is happening in the market, and does this setup make sense in this environment?”
🔄 The part that changes everything
Here's where the architecture becomes fundamentally different.
A signal is generated.
Then the market decides what happens next.
Maybe TP1 is reached.
Maybe the trade hits SL.
Maybe the market moves sideways.
Maybe the setup becomes invalid.
Whatever happens, the system can record the conditions that existed before the decision and the result that followed.
That creates a feedback loop:
Market Data → Signal → Outcome → Dataset → Learning → Better Selection
And then the cycle starts again.
This means the system isn't designed to remain frozen in time.
Its historical experience grows.
🧠 From rules to experience
Think about the difference between these two systems.
System A
“If RSI is below X, consider Long.”
Simple.
Predictable.
Static.
System B
“Under similar market conditions, with this BTC structure, this volatility regime, this trend alignment and these coin-specific characteristics, how have comparable setups historically performed?”
That's a completely different question.
And potentially a much more powerful one.
Because the system isn't looking at a single indicator.
It's looking for relationships between conditions and outcomes.
The Market Becomes the Teacher
This is the part we believe could change the way crypto signal systems are built.
Instead of developers constantly trying to guess which rules will work next month, the system can continuously collect new market examples.
The market produces the data.
The trades produce the outcomes.
The dataset grows.
And the model has more information to work with.
The market becomes the teacher.
📊 150+ Coins. One Decision Engine.
Crypto doesn't give traders a shortage of opportunities.
It gives them too many.
Hundreds of coins.
Thousands of possible setups.
Multiple timeframes.
Different market conditions.
Trying to manually process all of this is simply unrealistic.
Our system is designed to scan a large universe of cryptocurrencies and continuously search for opportunities.
But scanning more coins isn't the objective.
Finding better candidates is.
The system can rank opportunities instead of treating every setup equally.
Strong conditions move up.
Weak conditions move down.
Bad conditions can be rejected entirely.
And sometimes the best signal is:
No signal.
The Next Generation of Crypto Trading
We believe the next generation of trading systems won't simply be:
faster.
They will be:
more adaptive.
The difference is important.
A faster system can process more information.
An adaptive system can use historical information to improve how it evaluates new situations.
That's the direction we're building toward.
Not an AI that magically predicts the future.
That doesn't exist.
Not a machine that guarantees profits.
It doesn't exist either.
Instead:
A system that continuously collects evidence, evaluates outcomes and improves its decision-making process.
🚀 Why We Think This Matters
The crypto market has changed dramatically over the last few years.
More traders.
More algorithms.
More liquidity.
More assets.
More information.
And increasingly sophisticated market participants.
Using yesterday's rules to trade tomorrow's market isn't necessarily a competitive advantage.
The real advantage may come from building systems capable of learning from yesterday while adapting to tomorrow.
That's the bigger idea behind Crypto AI Pro.
We're not trying to build another signal generator.
We're building an evolving trading intelligence layer.
One that can observe.
Analyze.
Decide.
Measure.
Learn.
And repeat.
The Signal Was Never the Product.
The learning system is.
Every signal creates data.
Every result creates feedback.
Every new market condition creates another test.
And every cycle gives the system another opportunity to improve how it searches for the next setup.
This is still being developed.
Still being tested.
Still evolving.
But we believe this architecture represents a fundamentally different direction for crypto signal technology.
The future of crypto trading may not belong to systems that know the most rules.
It may belong to systems that learn the fastest. 🤖📈
1
56
·
--
පරිවර්තනය බලන්න
Lots of tests, lots of thinking, never stop trying and i think i managed to have my #indicator for the best possible signal.
#crypto $ACE
Lots of tests, lots of thinking, never stop trying and i think i managed to have my #indicator for the best possible signal.
#crypto $ACE
#crypto $ACE
146

·
--
උසබ තත්ත්වය
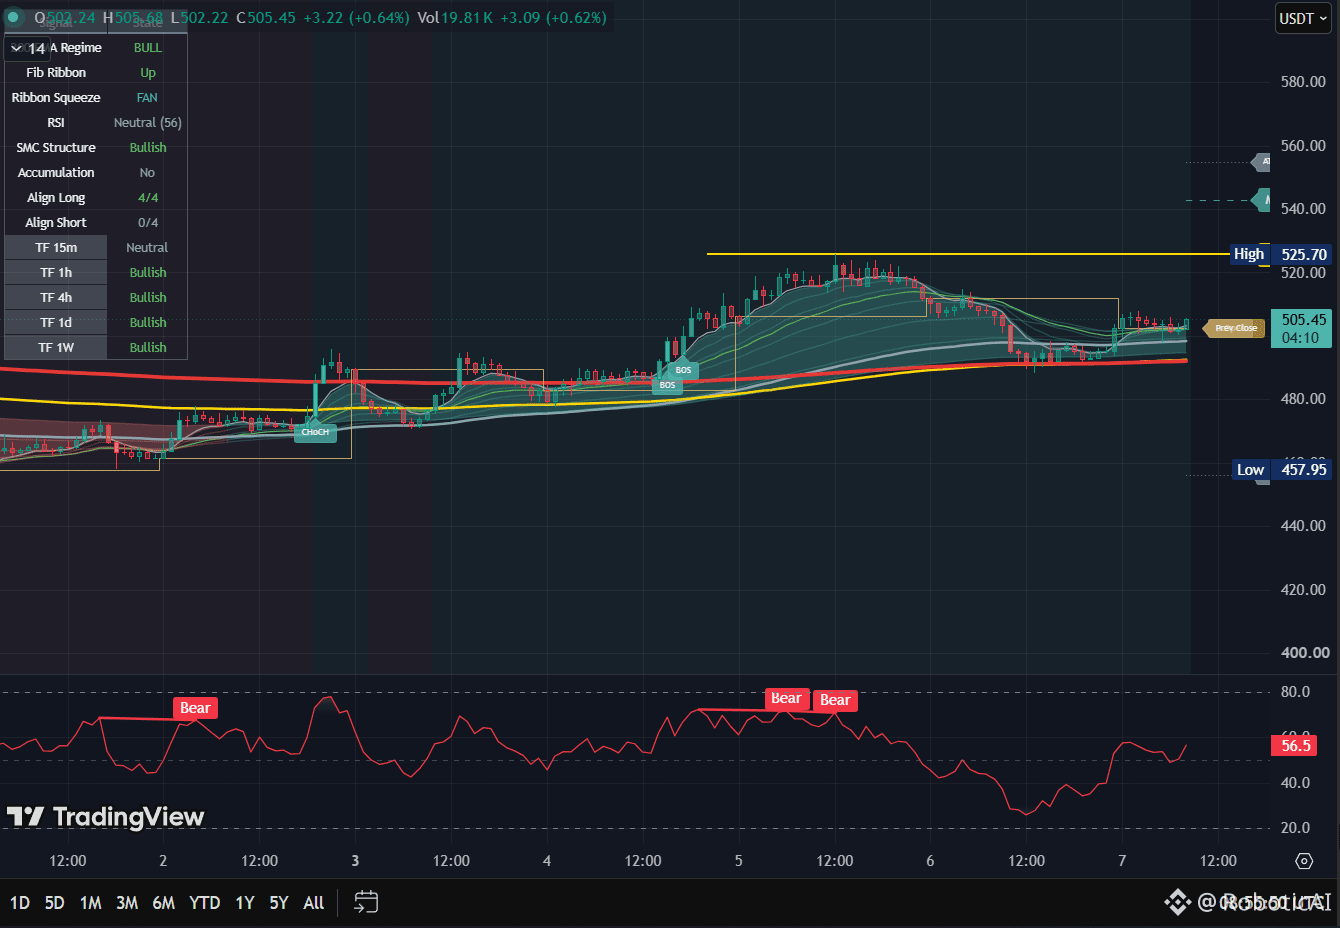
#BTC trader குறியீட்டை ஒவ்வொரு வர்த்தகத்திற்கும் பின்பற்றுங்கள் $BTC அடுத்த வர்த்தக அமைப்பிற்காக என்னைப் பின்தொடருங்கள் #BTCtrade #indicator
#BTC trader குறியீட்டை ஒவ்வொரு வர்த்தகத்திற்கும் பின்பற்றுங்கள் $BTC அடுத்த வர்த்தக அமைப்பிற்காக என்னைப் பின்தொடருங்கள் #BTCtrade #indicator
37

·
--
උසබ තත්ත්වය
පරිවර්තනය බලන්න
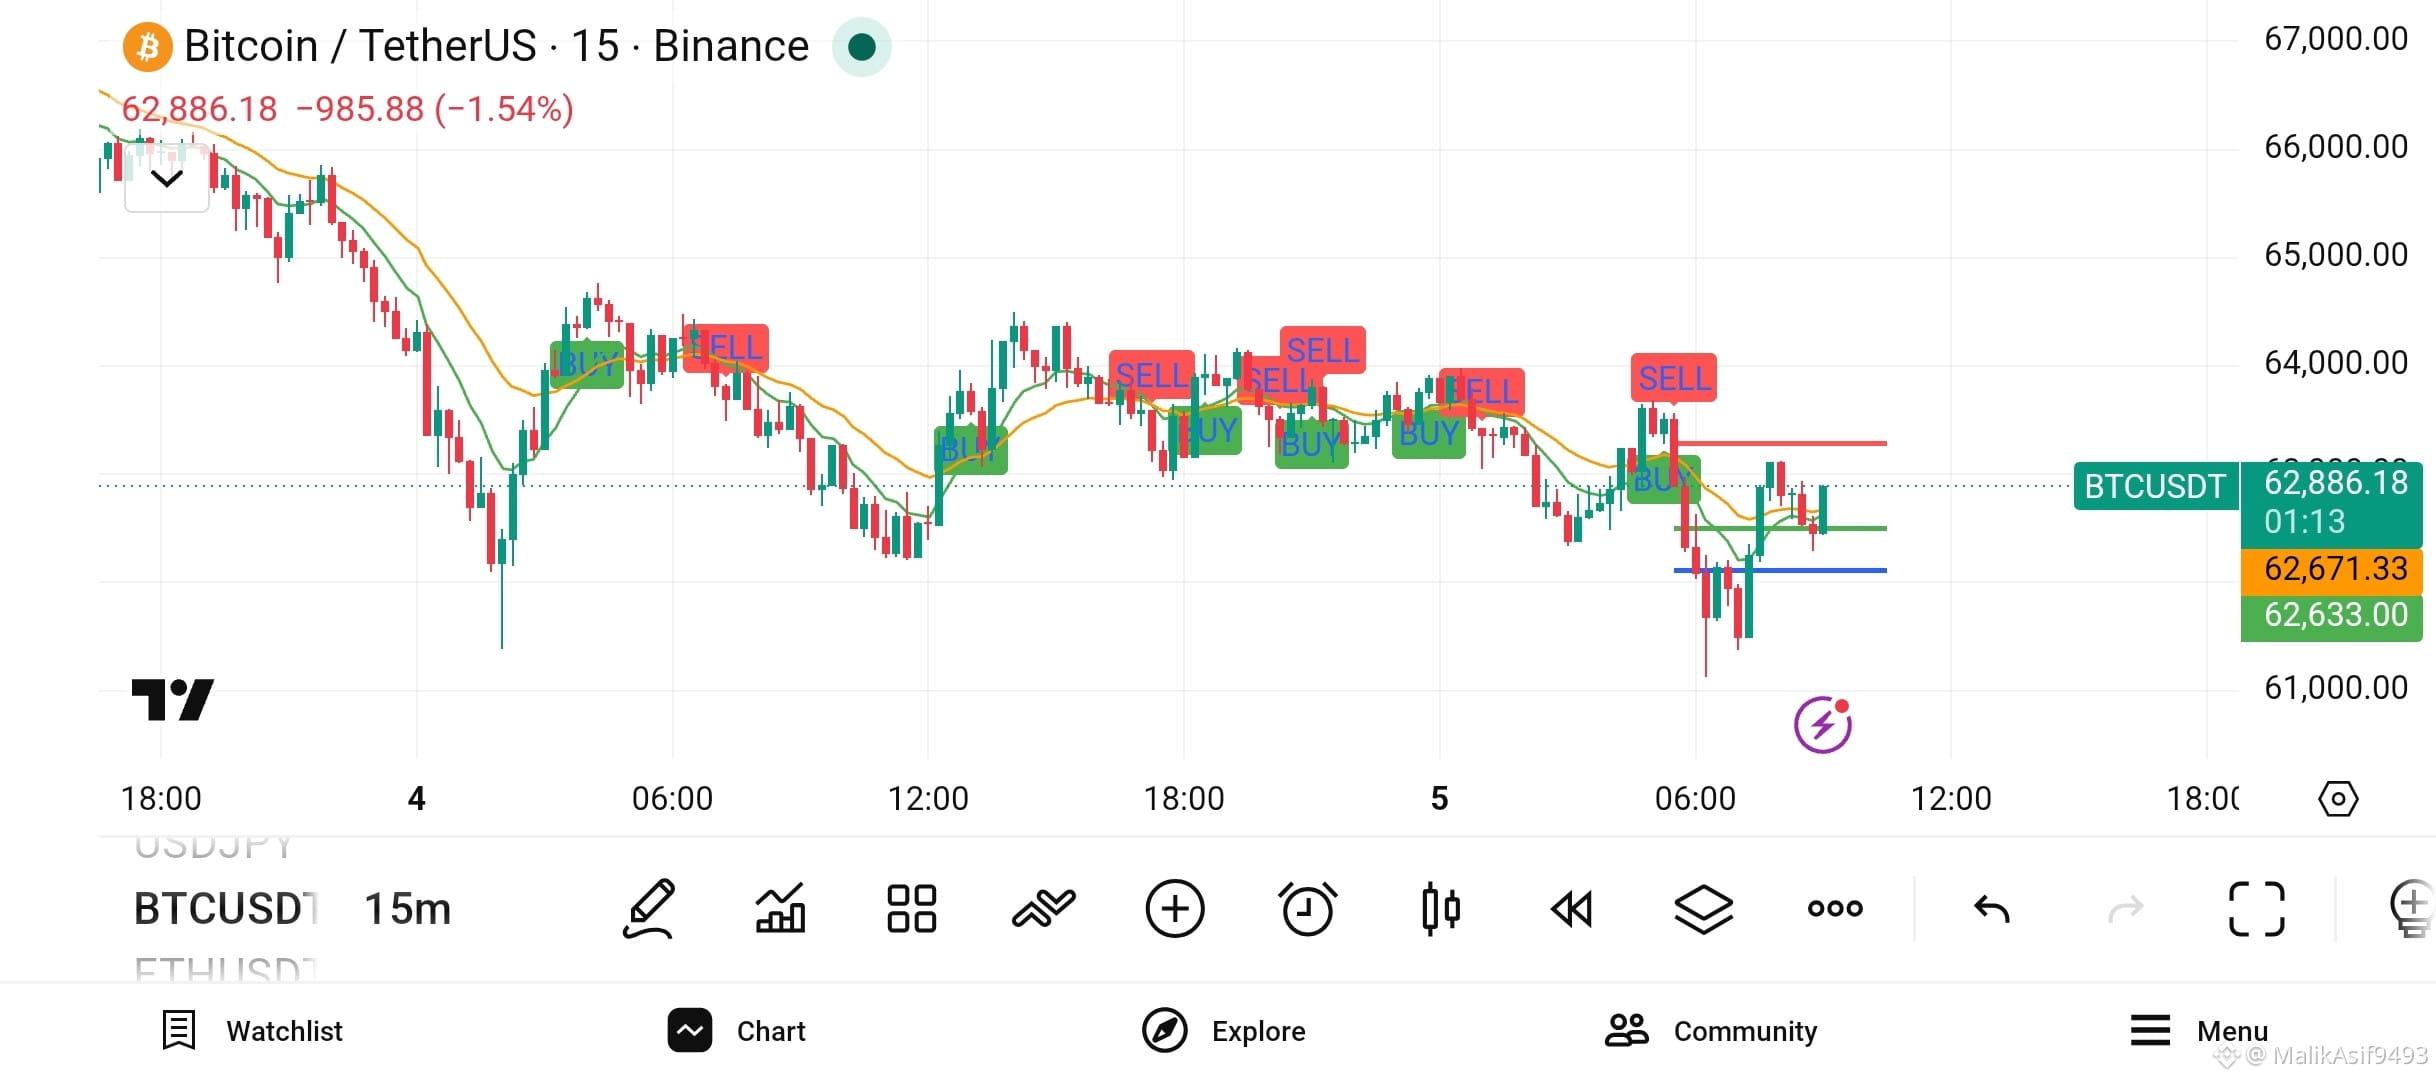
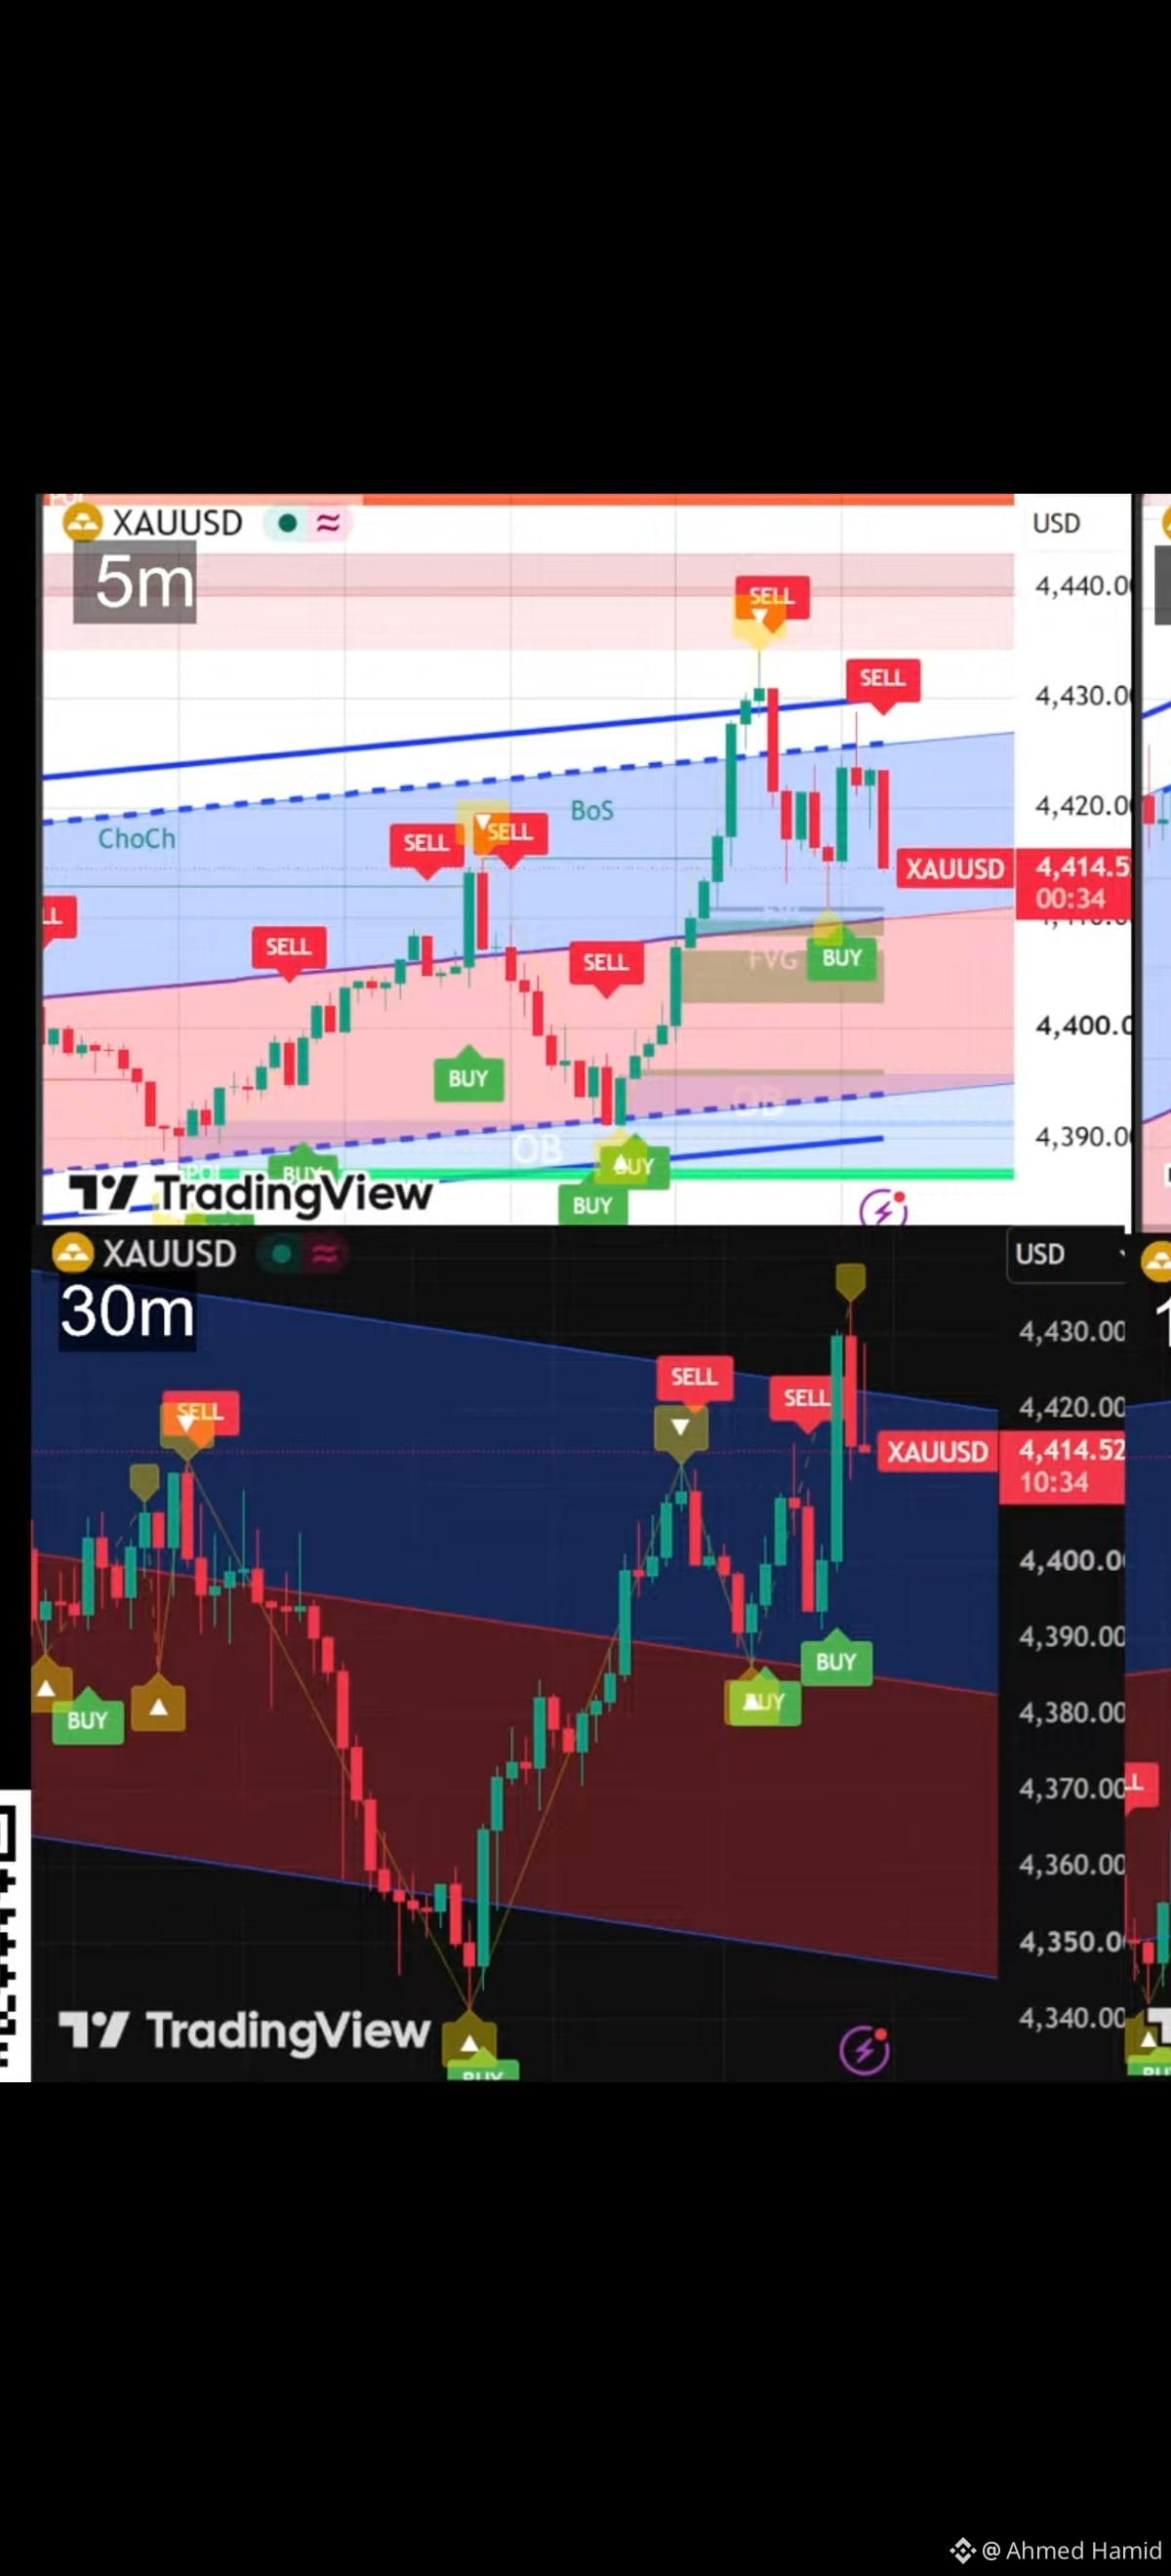
XAUUSD trading strategy Gold trade analysis charts indicator #xau #Scalping #xauusd #gold #indicator #live $XAUT
{spot}(XAUTUSDT)
XAUUSD trading strategy Gold trade analysis charts indicator #xau #Scalping #xauusd #gold #indicator #live $XAUT
1
86
·
--
බෙයාරිෂ්
පරිවර්තනය බලන්න
1
123
·
--
බෙයාරිෂ්
පරිවර්තනය බලන්න
$ADA
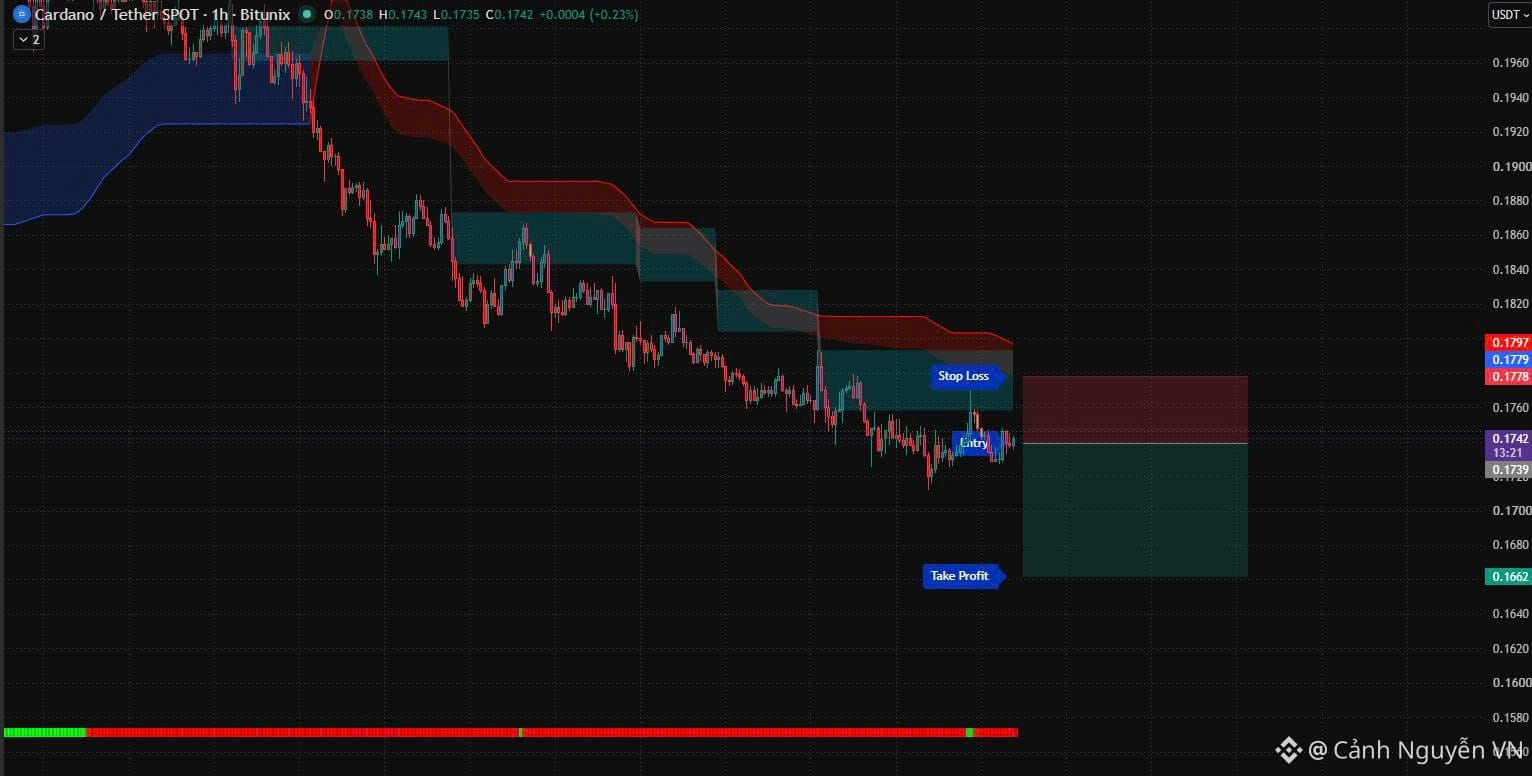
🔎 1. Thông tin tổng quan trên biểu đồ
Cặp giao dịch: Cardano / Tether · 1h ·
Mức giá hiện tại: Giá đang dao động quanh vùng 0.1742 USDT (nến màu xanh hiển thị thời gian đếm ngược còn 13 phút 21 giây là đóng nến 1 giờ).
Xu hướng chính (Trend): Xu hướng chủ đạo trước đó là giảm giá rõ rệt (Downtrend). Giá liên tục tạo các đỉnh sau thấp hơn đỉnh trước và đáy sau thấp hơn đáy trước, di chuyển xuống phía dưới các dải băng chỉ báo màu đỏ/xanh.
📊 2. Thiết lập lệnh giao dịch (Setup Lệnh Short)
ENTRY: 0.1742
STOP:0.1779
TP:0.1662
📉 3. Đánh giá chiến lược
Thuận xu hướng: Lệnh Short này được đánh giá là đánh thuận theo xu hướng giảm tổng thể của thị trường nhằm tối ưu hóa xác suất thắng.
#TheoDõiFOMC #45NgayTuDoTaiChinh #45DayTarget #signal&overlay indicator#indicator
$ADA
🔎 1. Thông tin tổng quan trên biểu đồ
Cặp giao dịch: Cardano / Tether · 1h ·
Mức giá hiện tại: Giá đang dao động quanh vùng 0.1742 USDT (nến màu xanh hiển thị thời gian đếm ngược còn 13 phút 21 giây là đóng nến 1 giờ).
Xu hướng chính (Trend): Xu hướng chủ đạo trước đó là giảm giá rõ rệt (Downtrend). Giá liên tục tạo các đỉnh sau thấp hơn đỉnh trước và đáy sau thấp hơn đáy trước, di chuyển xuống phía dưới các dải băng chỉ báo màu đỏ/xanh.
📊 2. Thiết lập lệnh giao dịch (Setup Lệnh Short)
ENTRY: 0.1742
STOP:0.1779
TP:0.1662
📉 3. Đánh giá chiến lược
Thuận xu hướng: Lệnh Short này được đánh giá là đánh thuận theo xu hướng giảm tổng thể của thị trường nhằm tối ưu hóa xác suất thắng.
#TheoDõiFOMC #45NgayTuDoTaiChinh #45DayTarget #signal&overlay indicator#indicator
🔎 1. Thông tin tổng quan trên biểu đồ
Cặp giao dịch: Cardano / Tether · 1h ·
Mức giá hiện tại: Giá đang dao động quanh vùng 0.1742 USDT (nến màu xanh hiển thị thời gian đếm ngược còn 13 phút 21 giây là đóng nến 1 giờ).
Xu hướng chính (Trend): Xu hướng chủ đạo trước đó là giảm giá rõ rệt (Downtrend). Giá liên tục tạo các đỉnh sau thấp hơn đỉnh trước và đáy sau thấp hơn đáy trước, di chuyển xuống phía dưới các dải băng chỉ báo màu đỏ/xanh.
📊 2. Thiết lập lệnh giao dịch (Setup Lệnh Short)
ENTRY: 0.1742
STOP:0.1779
TP:0.1662
📉 3. Đánh giá chiến lược
Thuận xu hướng: Lệnh Short này được đánh giá là đánh thuận theo xu hướng giảm tổng thể của thị trường nhằm tối ưu hóa xác suất thắng.
#TheoDõiFOMC #45NgayTuDoTaiChinh #45DayTarget #signal&overlay indicator#indicator
4
121

පරිවර්තනය බලන්න
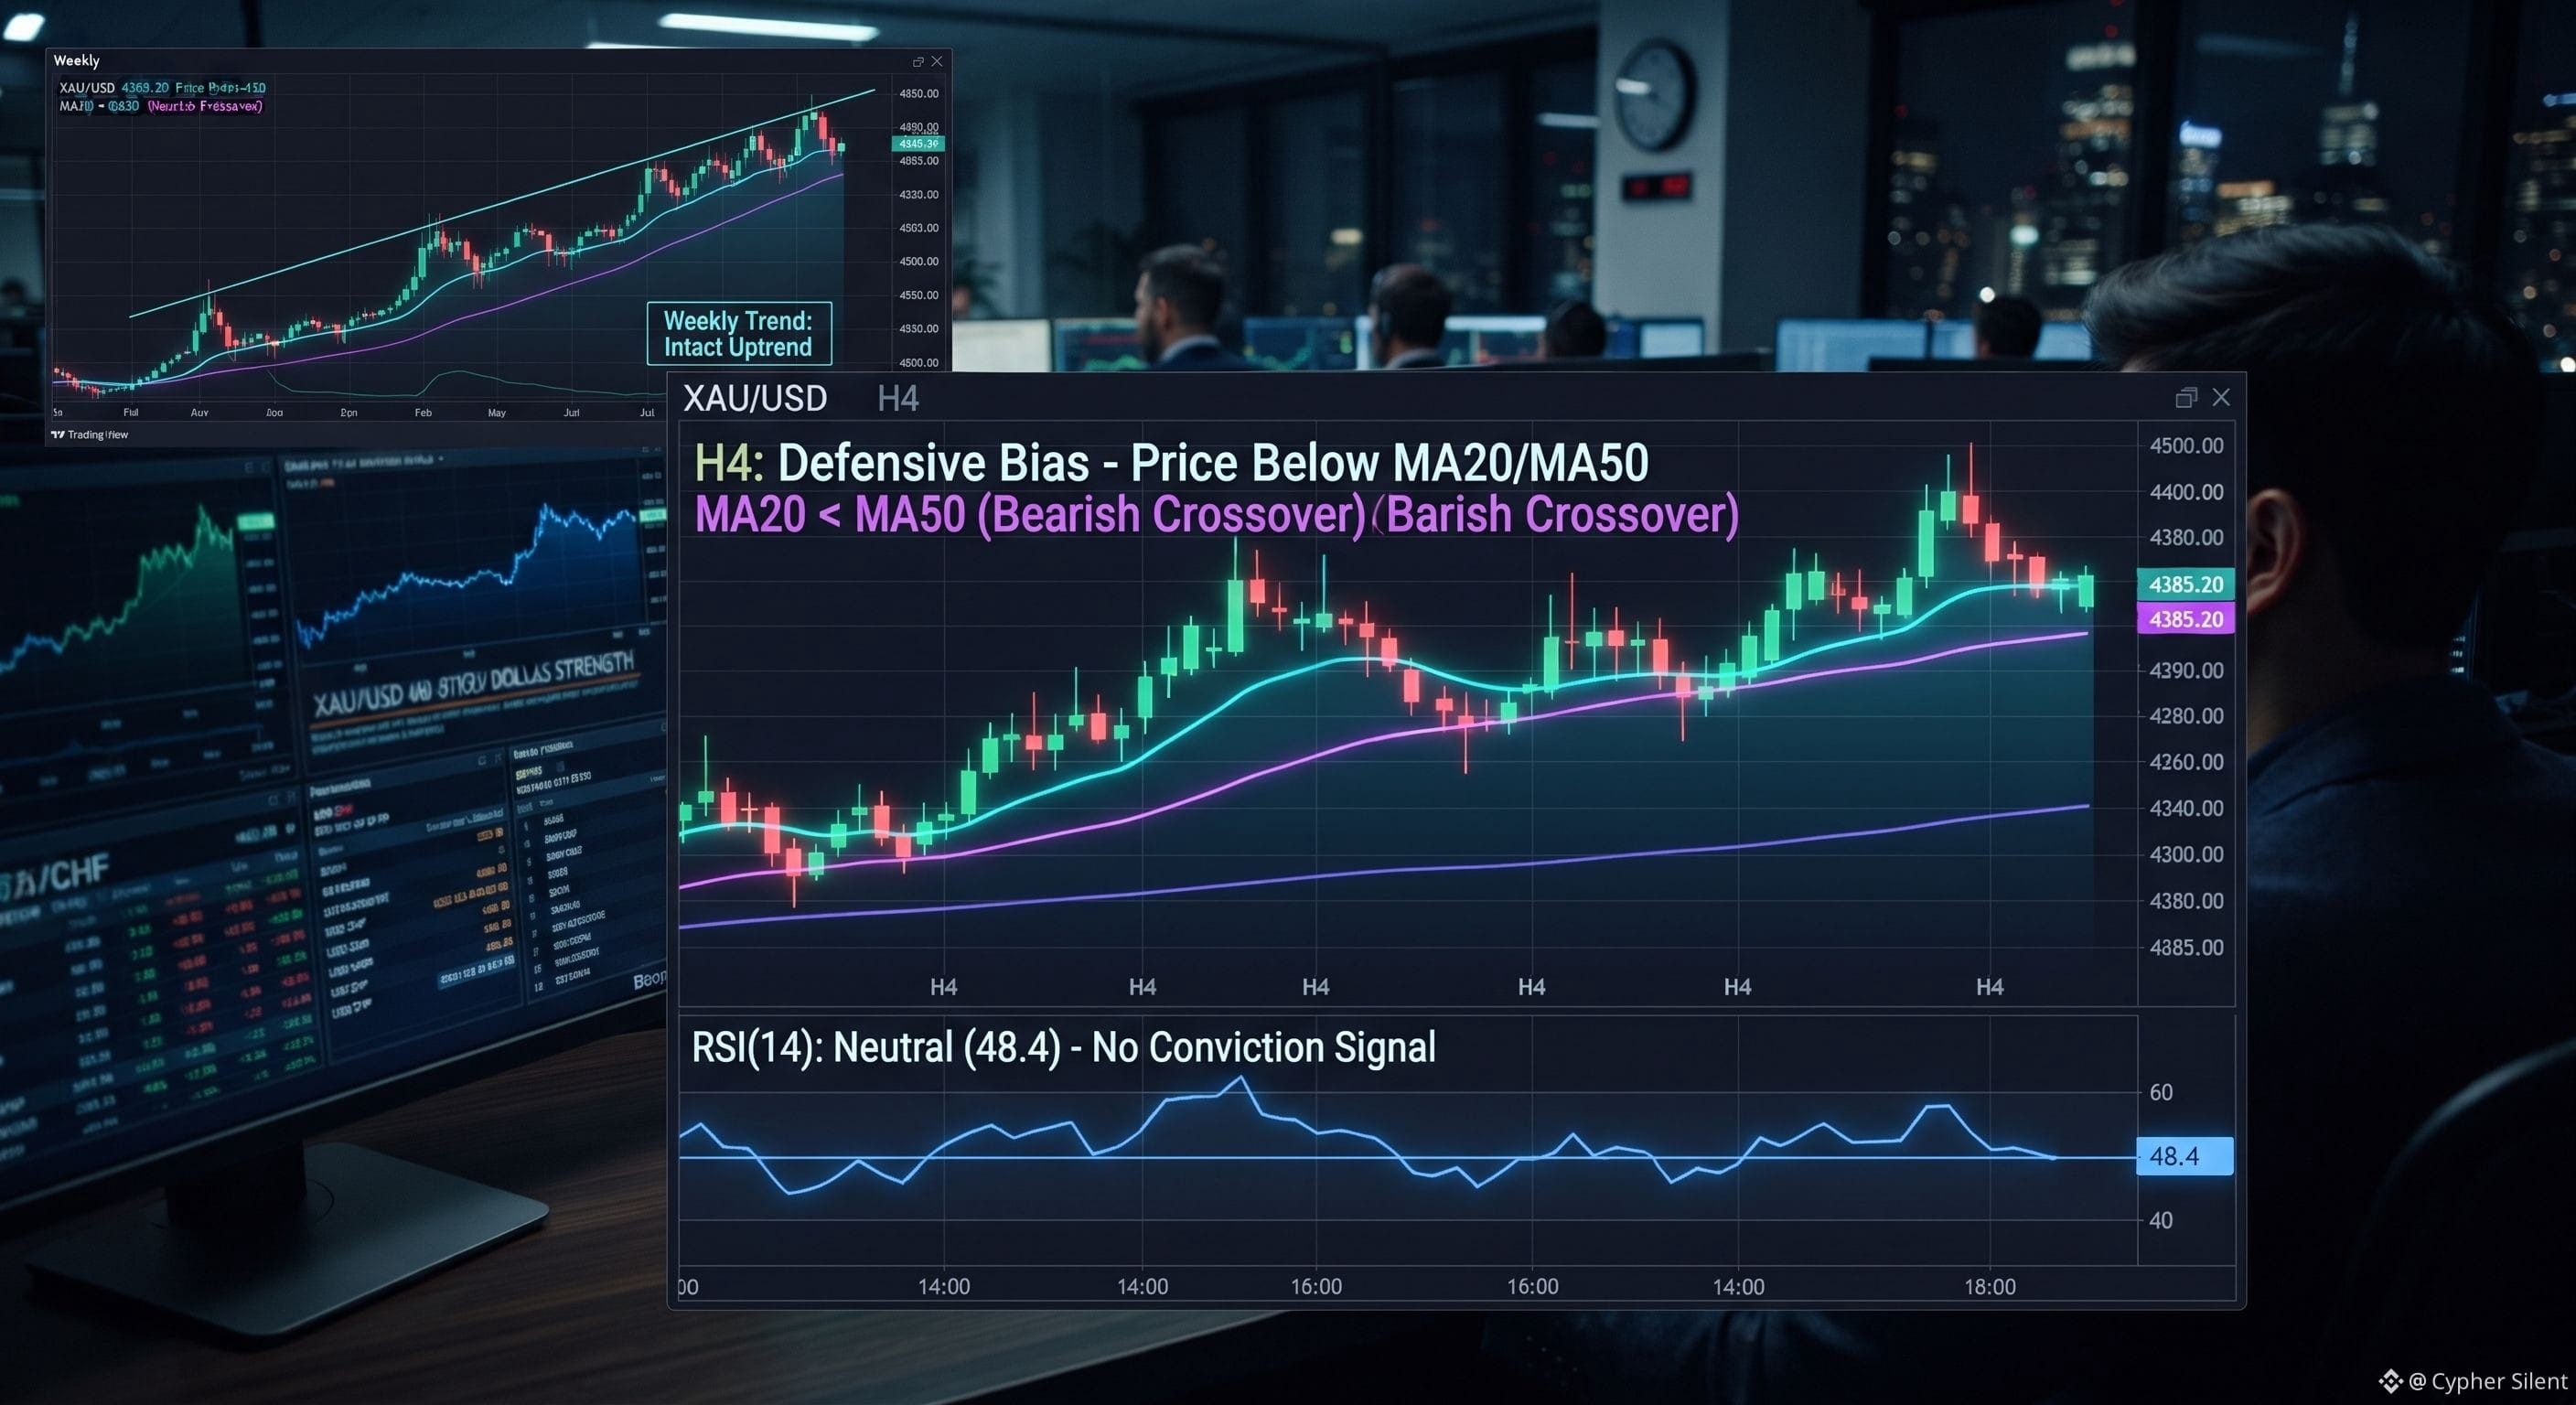
Technical Analysis
Moving Average Structure
The H4 chart shows the gold price below its short-duration moving averages, which keeps the near-term bias defensive. The MA20 and MA50 are now acting as dynamic resistance above spot. Until #XAU/USD can reclaim that cluster, rallies are likely to get sold.
The EMA structure reinforces this view. When the MA20 sits below the MA50, short-term momentum is still working against buyers. This does not guarantee a deeper sell-off, but it does mean every bounce has to prove itself.
On higher timeframes, the picture is more constructive. The weekly trend remains intact, so longer-term investors may view dips as opportunities rather than reasons to panic. The key is knowing which timeframe you are trading.
{future}(XAUUSDT)
#RSI and #momentum
The RSI(14) on the H4 chart is hovering near the middle of its range. That leaves room for the gold price to move in either direction without being overbought or oversold. It also means the indicator is not yet flashing a high-conviction reversal signal.
Momentum traders should watch for RSI to break above 50 alongside a price reclaim of the moving average cluster. If RSI stays below 50 while price retests resistance, the bounce may be short-lived. A combined move in both would carry more weight.
Conversely, an RSI drop toward 40 or lower would suggest sellers are gaining control. That could trigger a move toward the next meaningful support area. The #indicator becomes more useful when it aligns with price action, not when it is used in isolation. #EthereumFoundationDropsPoseidonForL1
Technical Analysis
Moving Average Structure
The H4 chart shows the gold price below its short-duration moving averages, which keeps the near-term bias defensive. The MA20 and MA50 are now acting as dynamic resistance above spot. Until #XAU/USD can reclaim that cluster, rallies are likely to get sold.
The EMA structure reinforces this view. When the MA20 sits below the MA50, short-term momentum is still working against buyers. This does not guarantee a deeper sell-off, but it does mean every bounce has to prove itself.
On higher timeframes, the picture is more constructive. The weekly trend remains intact, so longer-term investors may view dips as opportunities rather than reasons to panic. The key is knowing which timeframe you are trading.
#RSI and #momentum
The RSI(14) on the H4 chart is hovering near the middle of its range. That leaves room for the gold price to move in either direction without being overbought or oversold. It also means the indicator is not yet flashing a high-conviction reversal signal.
Momentum traders should watch for RSI to break above 50 alongside a price reclaim of the moving average cluster. If RSI stays below 50 while price retests resistance, the bounce may be short-lived. A combined move in both would carry more weight.
Conversely, an RSI drop toward 40 or lower would suggest sellers are gaining control. That could trigger a move toward the next meaningful support area. The #indicator becomes more useful when it aligns with price action, not when it is used in isolation. #EthereumFoundationDropsPoseidonForL1
Moving Average Structure
The H4 chart shows the gold price below its short-duration moving averages, which keeps the near-term bias defensive. The MA20 and MA50 are now acting as dynamic resistance above spot. Until #XAU/USD can reclaim that cluster, rallies are likely to get sold.
The EMA structure reinforces this view. When the MA20 sits below the MA50, short-term momentum is still working against buyers. This does not guarantee a deeper sell-off, but it does mean every bounce has to prove itself.
On higher timeframes, the picture is more constructive. The weekly trend remains intact, so longer-term investors may view dips as opportunities rather than reasons to panic. The key is knowing which timeframe you are trading.
#RSI and #momentum
The RSI(14) on the H4 chart is hovering near the middle of its range. That leaves room for the gold price to move in either direction without being overbought or oversold. It also means the indicator is not yet flashing a high-conviction reversal signal.
Momentum traders should watch for RSI to break above 50 alongside a price reclaim of the moving average cluster. If RSI stays below 50 while price retests resistance, the bounce may be short-lived. A combined move in both would carry more weight.
Conversely, an RSI drop toward 40 or lower would suggest sellers are gaining control. That could trigger a move toward the next meaningful support area. The #indicator becomes more useful when it aligns with price action, not when it is used in isolation. #EthereumFoundationDropsPoseidonForL1
1
1
126

·
--
ලිපිය
පරිවර්තනය බලන්න
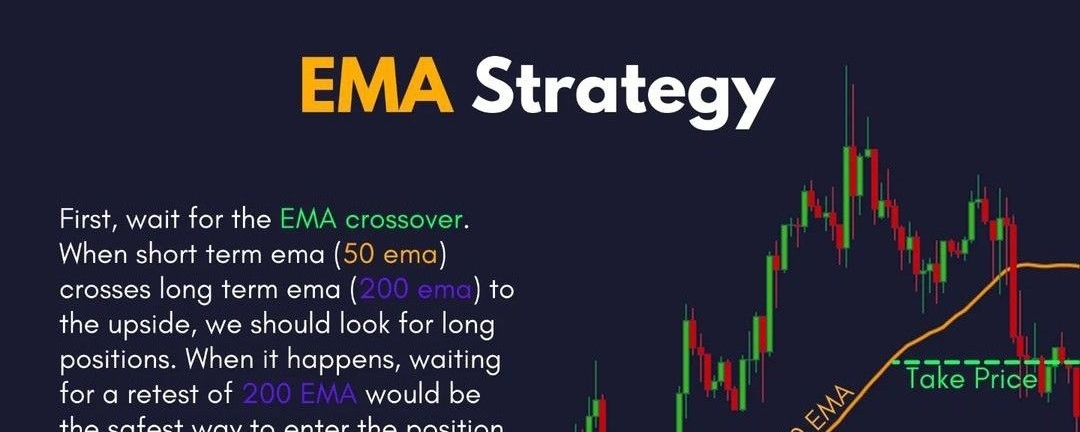
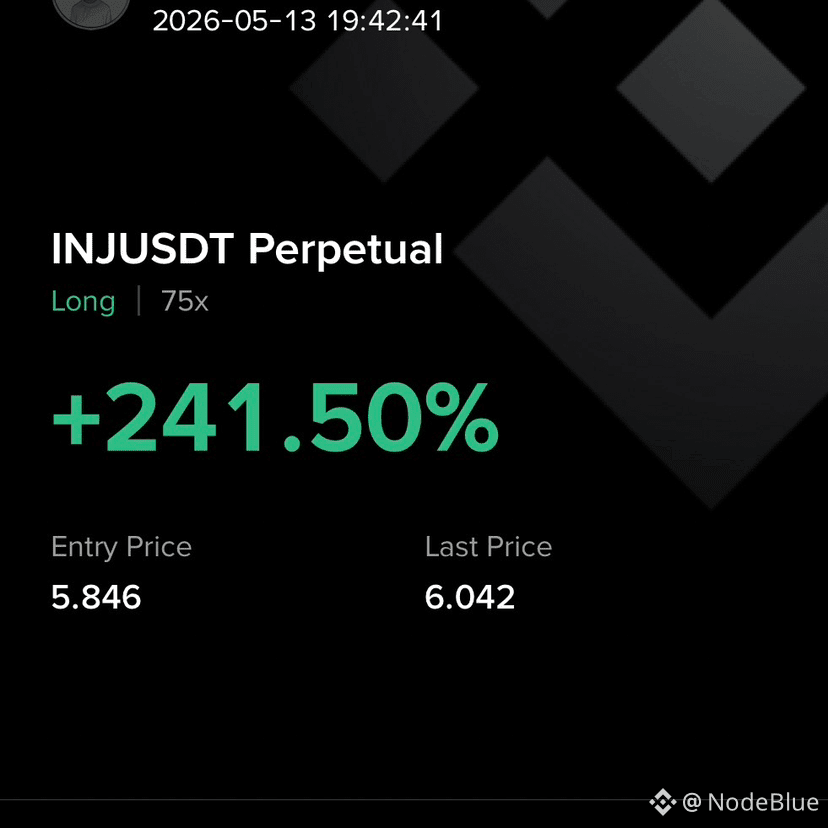
EMA CROSSOVER = FREE MONEY MOMENTWhen the 50 EMA rips above the 200 EMA, that’s your cue. Wait forthe retest, load the position, protect with a tight stop, and let the trend do the heavy lifting.$BNB #indicator
EMA CROSSOVER = FREE MONEY MOMENT
When the 50 EMA rips above the 200 EMA, that’s your cue. Wait forthe retest, load the position, protect with a tight stop, and let the trend do the heavy lifting.$BNB #indicator
94

164

·
--
ලිපිය
පරිවර්තනය බලන්න
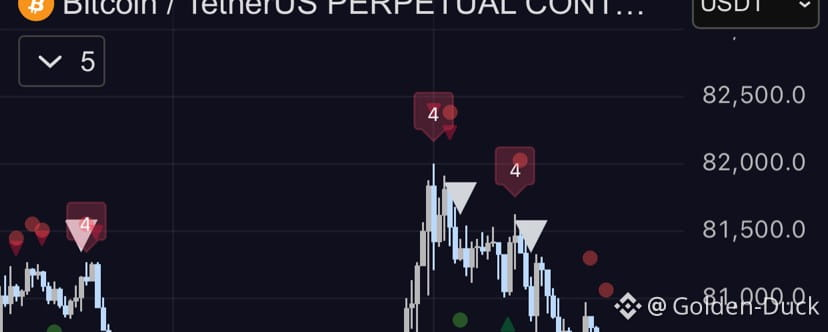
Người chơi hệ chỉ báoĐùa chứ k có chén thánh đâu. Nhưng được cái là tỷ lệ win short cao thật #indicator $BTC
{spot}(BTCUSDT)
Người chơi hệ chỉ báo
Đùa chứ k có chén thánh đâu. Nhưng được cái là tỷ lệ win short cao thật #indicator $BTC
241
·
--
ලිපිය
පරිවර්තනය බලන්න
THE SMA CROSSOVER THAT PRINTS MONEYWhen the 10 SMA slices through the
20, the market isn’t whispering, it’s
screaming direction. Combine it
with S/R and you stop guessing,
start sniping.$BTC #indicator
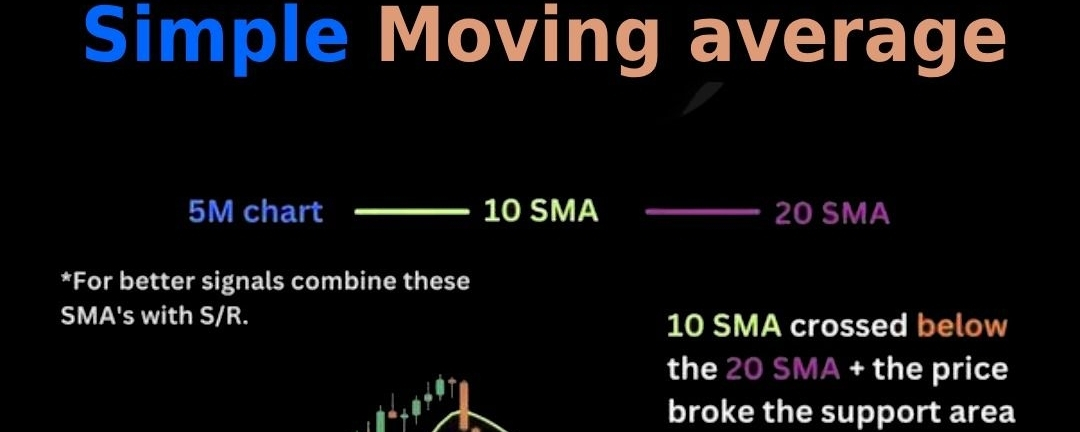
THE SMA CROSSOVER THAT PRINTS MONEY
When the 10 SMA slices through the
20, the market isn’t whispering, it’s
screaming direction. Combine it
with S/R and you stop guessing,
start sniping.$BTC #indicator
20, the market isn’t whispering, it’s
screaming direction. Combine it
with S/R and you stop guessing,
start sniping.$BTC #indicator
1
76
·
--
පරිවර්තනය බලන්න
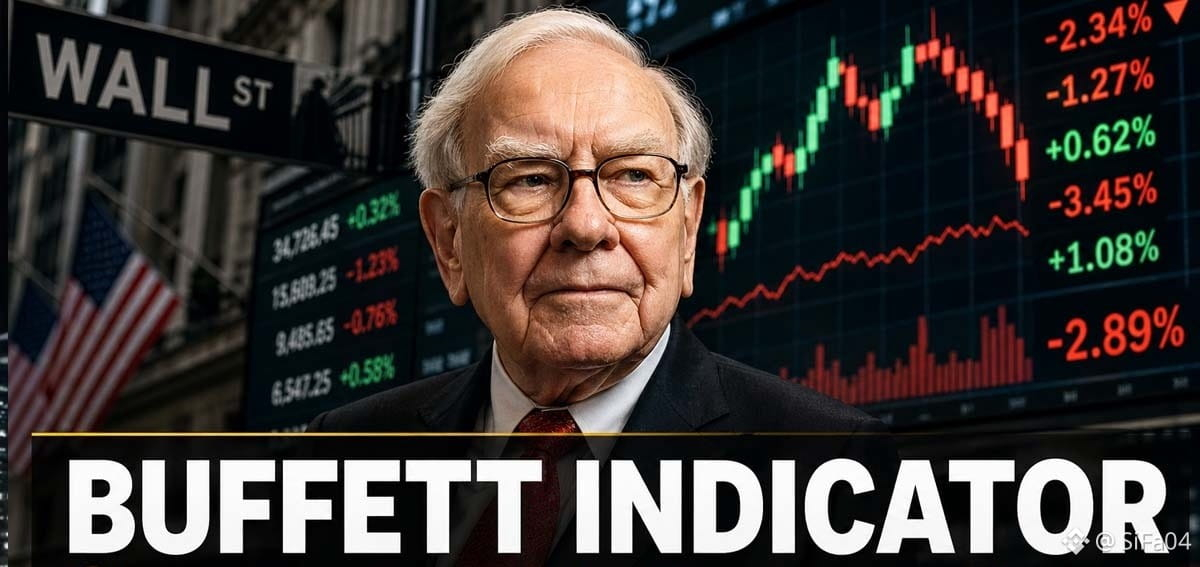
⚡ L’INDICATORE DI BUFFETT È ROTTO? PERCHÉ IL “TERMOMETRO DELLE BOLLE” NON FUNZIONA PIÙ ⚡
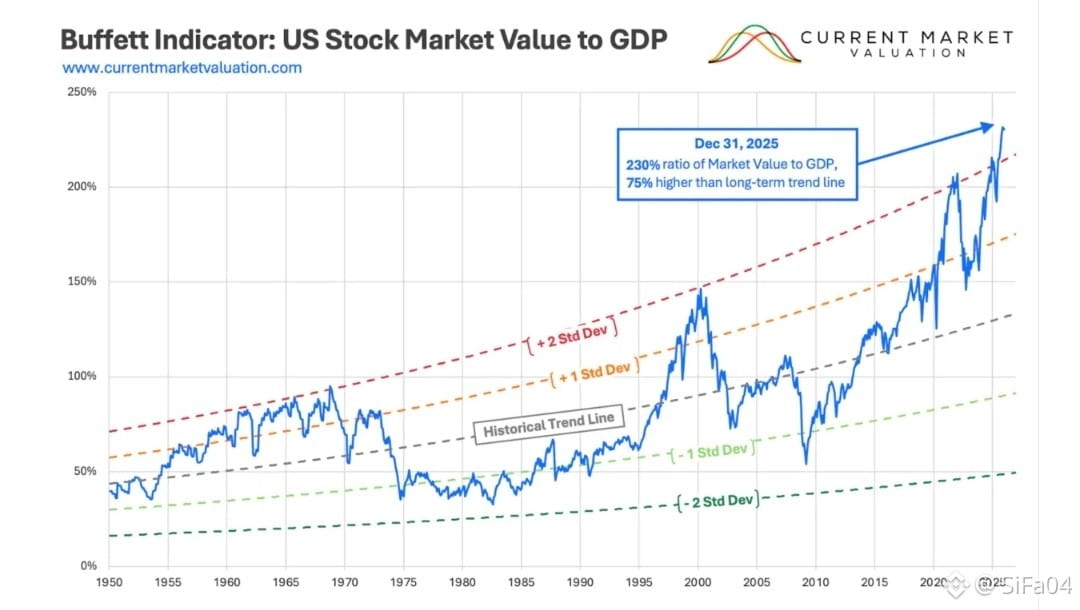
Il celebre Buffett Indicator ha raggiunto il 230%, massimo storico, spingendo molti a parlare della più grande bolla di sempre. Ma c’è un problema: questo indicatore è stato progettato per un’economia che non esiste più.
Il primo limite è strutturale: confronta la capitalizzazione globale delle aziende USA con un PIL che misura solo l’economia domestica.
Oggi colossi come Apple o Nvidia generano gran parte dei ricavi all’estero, gonfiando il numeratore senza riflettersi nel denominatore.
Inoltre, Buffett usava il GNP, non il GDP. Il GNP include i profitti globali delle aziende americane, mentre il GDP no.
Questo cambiamento altera completamente le soglie storiche.
C’è poi il tema dell’economia digitale: servizi come Google, YouTube o WhatsApp creano valore enorme ma incidono poco sul PIL.
Lo stesso vale per AI, software e asset intangibili, difficili da misurare.
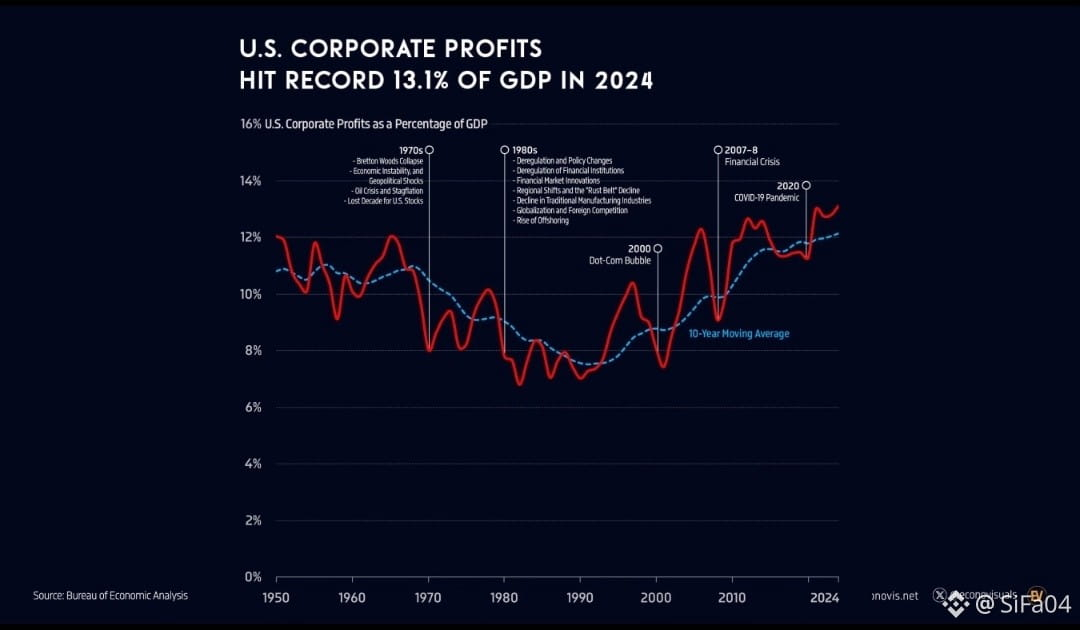
Anche i profitti aziendali sono cambiati: oggi sfiorano il 14% del PIL, contro una media storica del 7-8%.
Un livello più alto giustifica valutazioni più elevate.
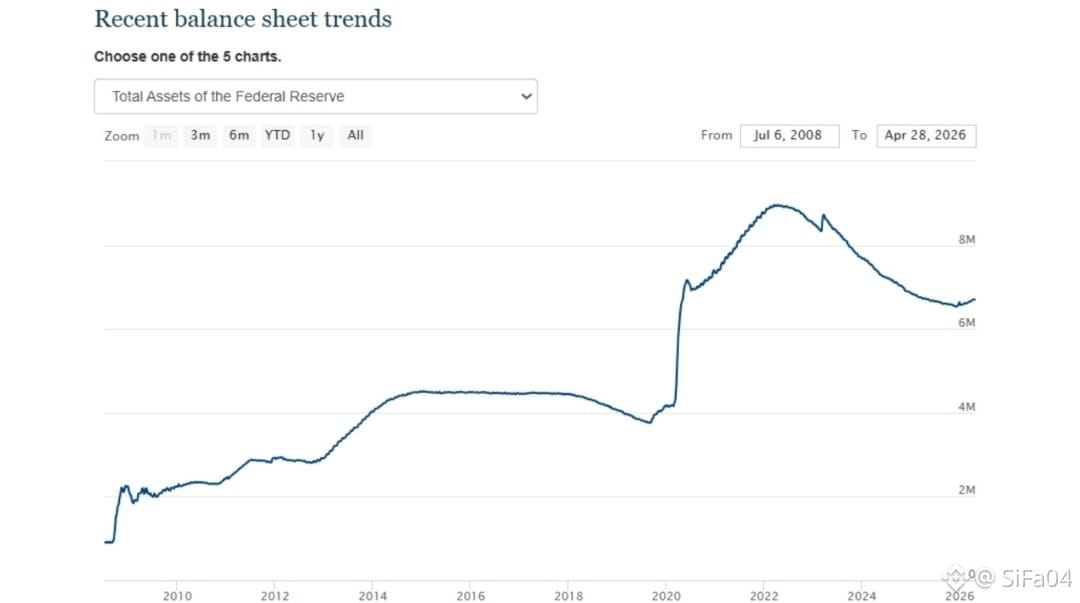
Infine, la liquidità della Fed e la globalizzazione hanno distorto il rapporto. Non a caso, l’indicatore segnala “bolla” dal 2013, mentre il mercato è triplicato.
Questo non significa che i mercati siano sicuri.
Ma che uno degli indicatori più usati potrebbe non essere più adatto al mondo moderno.
#BREAKING #WarrenBuffett #indicator #market
⚡ L’INDICATORE DI BUFFETT È ROTTO? PERCHÉ IL “TERMOMETRO DELLE BOLLE” NON FUNZIONA PIÙ ⚡
Il celebre Buffett Indicator ha raggiunto il 230%, massimo storico, spingendo molti a parlare della più grande bolla di sempre. Ma c’è un problema: questo indicatore è stato progettato per un’economia che non esiste più.
Il primo limite è strutturale: confronta la capitalizzazione globale delle aziende USA con un PIL che misura solo l’economia domestica.
Oggi colossi come Apple o Nvidia generano gran parte dei ricavi all’estero, gonfiando il numeratore senza riflettersi nel denominatore.
Inoltre, Buffett usava il GNP, non il GDP. Il GNP include i profitti globali delle aziende americane, mentre il GDP no.
Questo cambiamento altera completamente le soglie storiche.
C’è poi il tema dell’economia digitale: servizi come Google, YouTube o WhatsApp creano valore enorme ma incidono poco sul PIL.
Lo stesso vale per AI, software e asset intangibili, difficili da misurare.
Anche i profitti aziendali sono cambiati: oggi sfiorano il 14% del PIL, contro una media storica del 7-8%.
Un livello più alto giustifica valutazioni più elevate.
Infine, la liquidità della Fed e la globalizzazione hanno distorto il rapporto. Non a caso, l’indicatore segnala “bolla” dal 2013, mentre il mercato è triplicato.
Questo non significa che i mercati siano sicuri.
Ma che uno degli indicatori più usati potrebbe non essere più adatto al mondo moderno.
#BREAKING #WarrenBuffett #indicator #market
Il celebre Buffett Indicator ha raggiunto il 230%, massimo storico, spingendo molti a parlare della più grande bolla di sempre. Ma c’è un problema: questo indicatore è stato progettato per un’economia che non esiste più.
Il primo limite è strutturale: confronta la capitalizzazione globale delle aziende USA con un PIL che misura solo l’economia domestica.
Oggi colossi come Apple o Nvidia generano gran parte dei ricavi all’estero, gonfiando il numeratore senza riflettersi nel denominatore.
Inoltre, Buffett usava il GNP, non il GDP. Il GNP include i profitti globali delle aziende americane, mentre il GDP no.
Questo cambiamento altera completamente le soglie storiche.
C’è poi il tema dell’economia digitale: servizi come Google, YouTube o WhatsApp creano valore enorme ma incidono poco sul PIL.
Lo stesso vale per AI, software e asset intangibili, difficili da misurare.
Anche i profitti aziendali sono cambiati: oggi sfiorano il 14% del PIL, contro una media storica del 7-8%.
Un livello più alto giustifica valutazioni più elevate.
Infine, la liquidità della Fed e la globalizzazione hanno distorto il rapporto. Non a caso, l’indicatore segnala “bolla” dal 2013, mentre il mercato è triplicato.
Questo non significa che i mercati siano sicuri.
Ma che uno degli indicatori più usati potrebbe non essere più adatto al mondo moderno.
#BREAKING #WarrenBuffett #indicator #market
2
927

·
--

ලිපිය
ක්රිප්ටෝ වෙළඳාමේ විවෘත උනන්දුව අවබෝධ කර ගැනීම: ලාභදායි උපාය මාර්ග සඳහා මාර්ගෝපදේශයක්විවෘත උනන්දුව (OI) යනු ලෝකයේ ඉතා වැදගත් නමුත් බොහෝ විට අඩුවෙන් භාවිතා කරන මිනුම් දර්ශකයක් වන අතර #CryptoTrading. මෙය #guide ය පිළිබඳ ඔබට වඩා හොඳ අවබෝධයක් ලබා දෙයි. #Openinterest එය ඵලදායී ලෙස භාවිතා කරන්නේ කෙසේද, සහ ඔබේ වෙළඳ උපාය මාර්ගය ශක්තිමත් කරමින් ලාභදායිතාවය වැඩි කර ගැනීමට එය වෙනත් වෙළඳ උපකරණ සමඟ එකට භාවිතා කරන්නේ කෙසේද යන්නත් මෙයෙන් පැහැදිලි කරයි.
විවෘත උනන්දුව යනු කුමක්ද?
විවෘත උනන්දුව යනු futures හෝ options වැනි වත්මන්ව විවෘතව හා ක්රියාකාරීව පවතින දර්ශනික (derivative) කොන්ත්රාත්තු වල මුළු සංඛ්යාව නියෝජනය කරයි. මෙය futures වෙළඳපොළට මුදල් ගලා ඒම (flow of money) මැනීමක් වන අතර #Indicator වෙළඳපොළ #Sentiments සහ ද්රවශීලතාව (liquidity) ගැන දර්ශනයක් ලබා දෙයි.
ක්රිප්ටෝ වෙළඳාමේ විවෘත උනන්දුව අවබෝධ කර ගැනීම: ලාභදායි උපාය මාර්ග සඳහා මාර්ගෝපදේශයක්
විවෘත උනන්දුව (OI) යනු ලෝකයේ ඉතා වැදගත් නමුත් බොහෝ විට අඩුවෙන් භාවිතා කරන මිනුම් දර්ශකයක් වන අතර #CryptoTrading. මෙය #guide ය පිළිබඳ ඔබට වඩා හොඳ අවබෝධයක් ලබා දෙයි. #Openinterest එය ඵලදායී ලෙස භාවිතා කරන්නේ කෙසේද, සහ ඔබේ වෙළඳ උපාය මාර්ගය ශක්තිමත් කරමින් ලාභදායිතාවය වැඩි කර ගැනීමට එය වෙනත් වෙළඳ උපකරණ සමඟ එකට භාවිතා කරන්නේ කෙසේද යන්නත් මෙයෙන් පැහැදිලි කරයි.
විවෘත උනන්දුව යනු කුමක්ද?
විවෘත උනන්දුව යනු futures හෝ options වැනි වත්මන්ව විවෘතව හා ක්රියාකාරීව පවතින දර්ශනික (derivative) කොන්ත්රාත්තු වල මුළු සංඛ්යාව නියෝජනය කරයි. මෙය futures වෙළඳපොළට මුදල් ගලා ඒම (flow of money) මැනීමක් වන අතර #Indicator වෙළඳපොළ #Sentiments සහ ද්රවශීලතාව (liquidity) ගැන දර්ශනයක් ලබා දෙයි.
විවෘත උනන්දුව යනු කුමක්ද?
විවෘත උනන්දුව යනු futures හෝ options වැනි වත්මන්ව විවෘතව හා ක්රියාකාරීව පවතින දර්ශනික (derivative) කොන්ත්රාත්තු වල මුළු සංඛ්යාව නියෝජනය කරයි. මෙය futures වෙළඳපොළට මුදල් ගලා ඒම (flow of money) මැනීමක් වන අතර #Indicator වෙළඳපොළ #Sentiments සහ ද්රවශීලතාව (liquidity) ගැන දර්ශනයක් ලබා දෙයි.
2
1.7k

·
--
පරිවර්තනය බලන්න
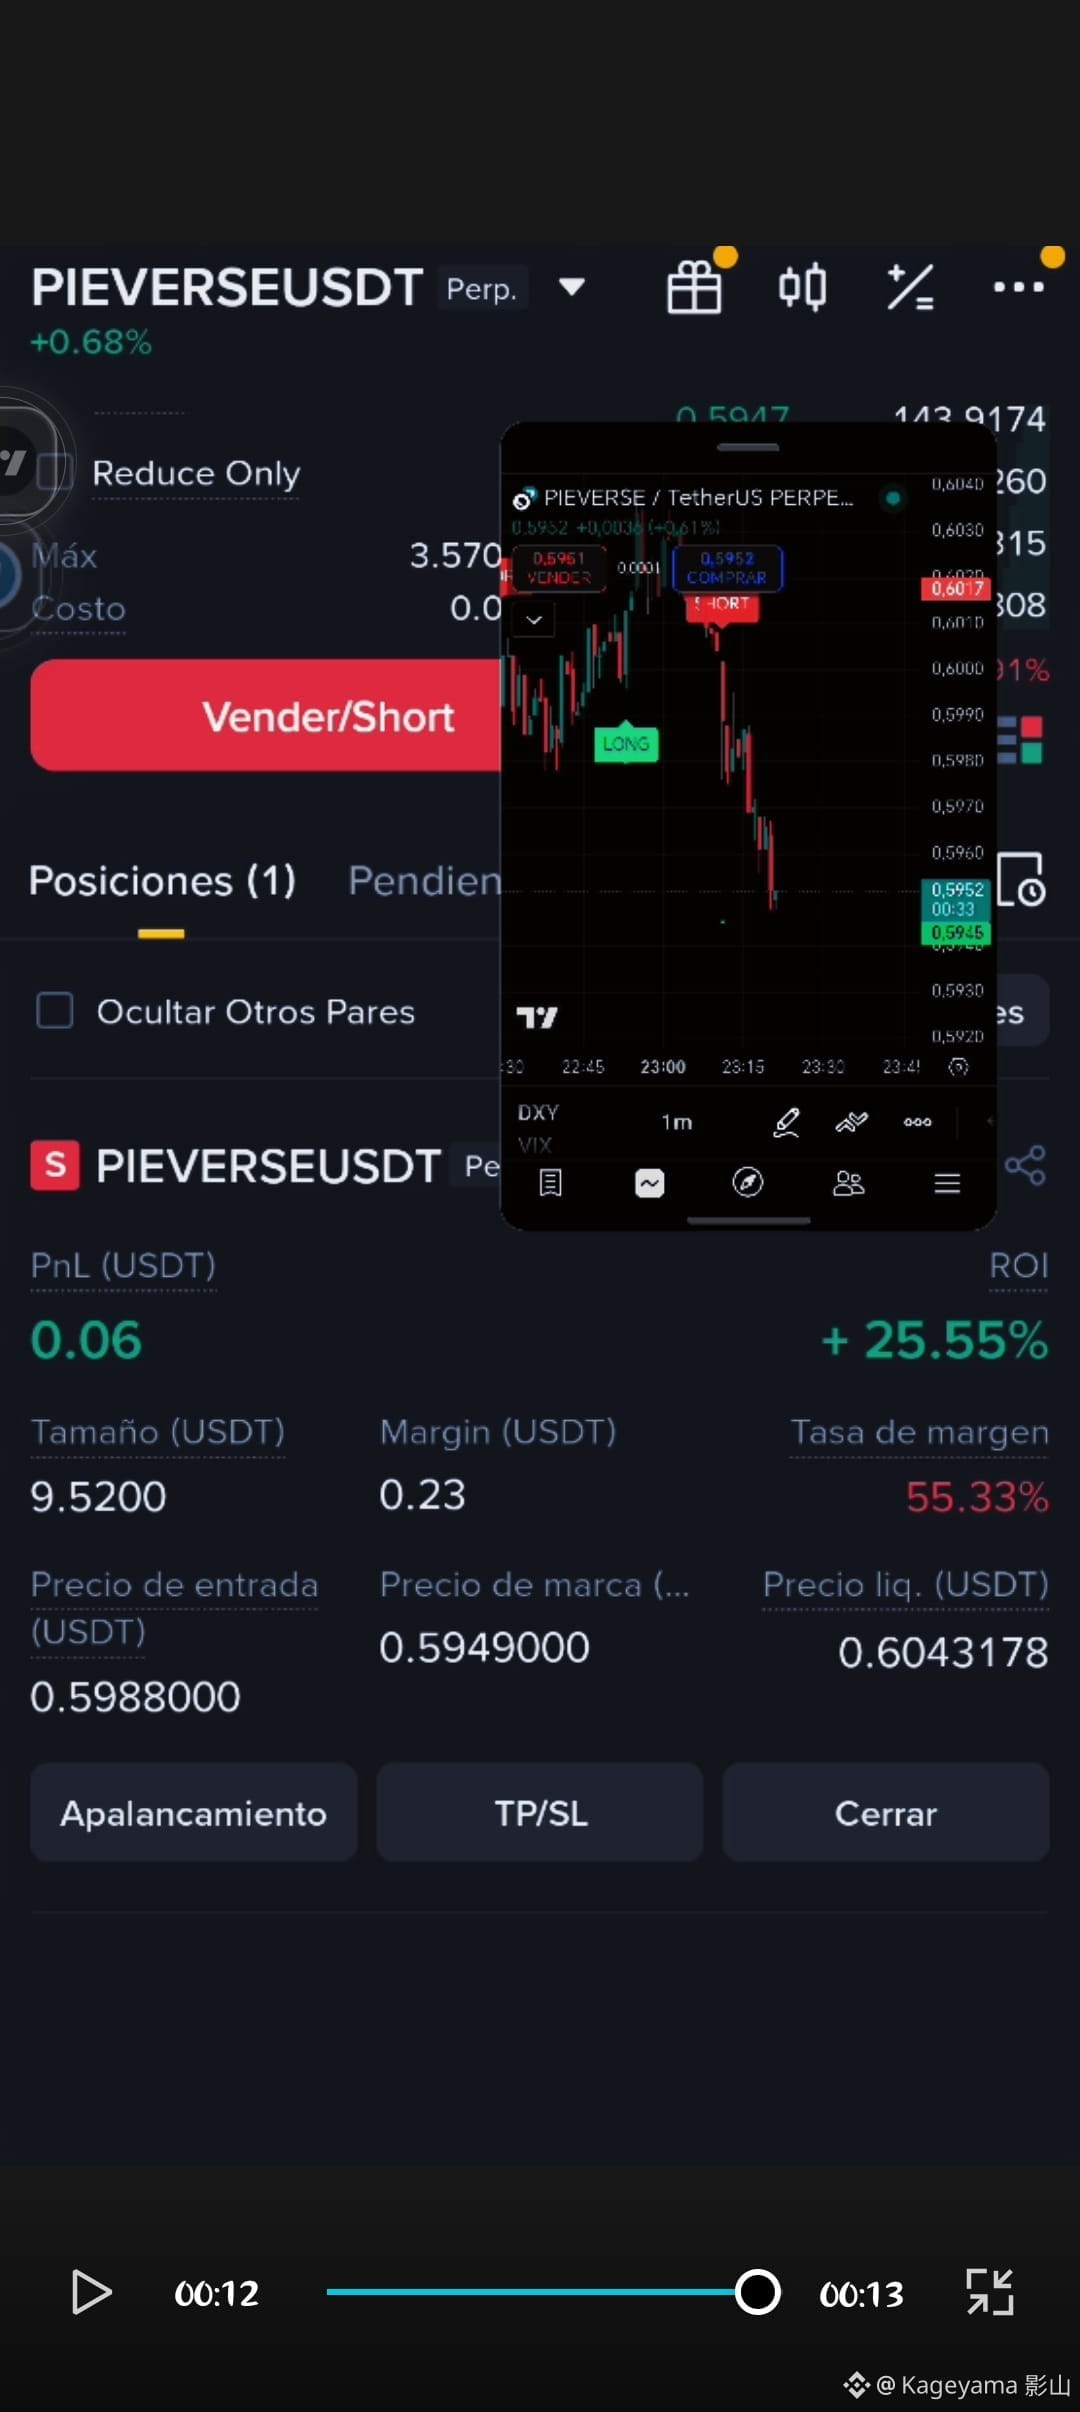
🚨Testeando mi propio indicador,
Pronto saldrá : Ultra zero. #KAGEYAMAENGINEULTRAZERO #indicator #scalping #creador @Eslava_23crypto
🚨Testeando mi propio indicador,
Pronto saldrá : Ultra zero. #KAGEYAMAENGINEULTRAZERO #indicator #scalping #creador @Eslava_23crypto
Pronto saldrá : Ultra zero. #KAGEYAMAENGINEULTRAZERO #indicator #scalping #creador @Eslava_23crypto
1
218

ලිපිය
පරිවර්තනය බලන්න
Indicadores de trading: quais são os principais e como usá-los a seu favor?Os indicadores de trading são ferramentas fundamentais para quem busca tomar decisões baseadas em dados nos mercados financeiros.
Eles utilizam cálculos matemáticos aplicados aos preços, volumes e outros fatores de mercado para trazer informações relevantes sobre tendências, momento, volatilidade e força das movimentações de ativos.
$LAB Ao serem aplicados em gráficos, os indicadores ajudam os traders a identificar oportunidades, confirmar sinais de entrada e saída e gerenciar riscos de forma mais eficiente.
Entender como funcionam e quais são os mais utilizados é um passo essencial para aprimorar estratégias de negociação.
Por isso, neste artigo vamos te mostrar os principais indicadores de trading e como utilizá-los a seu favor nas operações. Vamos lá?
O que são indicadores de trading? $NFP
Indicadores de trading são ferramentas utilizadas por traders para analisar o comportamento do mercado financeiro e tomar decisões sobre compra e venda de ativos.
Esses indicadores são baseados em cálculos matemáticos aplicados a dados históricos de preços, volume ou outros fatores relacionados ao mercado. Isso significa que eles fazem parte da Análise Técnica.
Eles ajudam a identificar tendências, pontos de reversão, níveis de suporte e resistência, além de fornecer informações importantes sobre a força do mercado ou sobre possíveis movimentos futuros.
Os principais indicadores de trading podem ser divididos em 5 categorias:
Indicadores de tendência: identificam a direção geral do mercado. Exemplos: Média Móvel, MACD.Indicadores de momento: medem a força de um movimento de preço. Exemplos: IFR (Índice de Força Relativa) e estocástico.Indicadores de volatilidade: avaliam o grau de variação dos preços em determinado período. Exemplo: Bandas de Bollinger.Indicadores de volume: analisam o volume negociado para identificar a força de uma tendência. Exemplo: OBV (On Balance Volume).Indicadores de suporte e resistência: apontam possíveis zonas onde o preço pode parar ou reverter. Exemplos: pontos de pivô, retração de Fibonacci.
Principais indicadores de trading
Para você saber por onde pode começar a estudar os principais indicadores de trading, selecionamos os mais utilizados por traders profissionais.
Além disso, você pode conferir artigos específicos sobre cada um dos principais indicadores, com explicações completas para você se aprofundar neles. Vamos lá?
1. Média móvel
A média móvel é uma ferramenta que suaviza os preços ao longo de um período definido, ajudando a identificar tendências.
Existem dois tipos principais:
Média Móvel Simples: calcula a média dos preços em um período específico (exemplo: 10 dias).Média Móvel Exponencial: dá mais peso aos preços recentes, reagindo mais rápido às mudanças.
O cruzamento de médias (curta e longa) sinaliza compra ou venda. Se o preço estiver acima da média, sugere tendência de alta; abaixo, tendência de baixa.
2. Bandas de Bollinger
As Bandas de Bollinger consistem em três linhas:
Média móvel central: base para as bandas.Bandas superior e inferior: calculadas com base na volatilidade (desvio padrão).
Dessa forma, quando o preço atinge a banda superior, pode indicar sobrecompra; na inferior, sobrevenda.
3. MACD
O MACD mede a diferença entre duas médias móveis exponenciais (geralmente de 12 e 26 períodos). Ele inclui:
Linha MACD: diferença entre as médias móveis.Linha de sinal: média móvel da linha MACD.Histograma: diferença entre a linha MACD e a linha de sinal.
Assim, o cruzamento da linha MACD com a linha de sinal indica compra ou venda. O histograma positivo sugere alta; já o negativo sugere baixa.
4. Índice de Força Relativa (IFR)
O Índice de Força Relativa (IFR) mede a força dos movimentos de alta e baixa em um intervalo de 0 a 100.
IFR acima de 70 indica sobrecompra (possível reversão para baixa).IFR abaixo de 30 indica sobrevenda (possível reversão para alta).
Já as divergências entre o IFR e o preço podem sinalizar reversões.
5. Estocástico lento e estocástico rápido
O Estocástico compara o preço de fechamento com a faixa de preços em um período específico.
Estocástico rápido: reage rapidamente às mudanças de preço.Estocástico lento: é suavizado para reduzir ruídos.
Valores acima de 80 indicam sobrecompra; abaixo de 20, sobrevenda. Ademais, o cruzamento das linhas %K e %D sinaliza compra ou venda.
6. Retração de Fibonacci
Baseia-se nos níveis de retração (%), como 38,2%, 50% e 61,8%, que são usados para identificar possíveis zonas de suporte e resistência.
Após um movimento significativo, o preço frequentemente “retrai” para um desses níveis antes de continuar na direção original.
7. On Balance Volume (OBV)
O On Balance Volume (OBV) mede a força de uma tendência por meio da avaliação do volume de negociações.
Assim, ele funciona somando o volume de negociações em dias em que o preço aumenta e subtraindo o volume em dias em que o preço cai.
8. Nuvem de Ichimoku
É um indicador multifuncional que identifica suporte, resistência, tendência e força do mercado. Ele inclui:
Linha Tenkan-sen e Kijun-sen: médias móveis de curto e médio prazo.Senkou Span A e B: criam a “nuvem”, projetando suporte ou resistência futura.Linha Chikou Span: preço atrasado (lagging).
Se o preço estiver acima da nuvem, há tendência de alta; abaixo, tendência de baixa. Os cruzamentos das linhas Tenkan e Kijun geram sinais de compra e venda.
9. Oscilador de preço percentual (PPO)
Esse é um indicador de momentum que leva em conta a diferença entre duas médias móveis. Ela é usada para avaliar a tendência de um ativo.
O cálculo do PPO leva a diferença entre uma média móvel de curto prazo e outra de longo prazo.
10. Volume de balanço (OBV)
Esse é um indicador baseado no volume de negociação para medir a pressão de compra e venda de um ativo. Ou seja, ele calcula a atividade comercial acumulada de compradores e vendedores.
Ele foi criado por Joseph Granville e é útil para perceber o movimento de grandes investidores e prever mudanças na direção do mercado.
Quais indicadores técnicos aprender primeiro?
Se você está começando no trading, é ideal começar com os indicadores técnicos mais simples e bastante utilizados, que ajudam a entender tendências, força do mercado e pontos de reversão.
Como citamos anteriormente, as médias móveis são simples de entender e ajudam a identificar a tendência geral do mercado.
Já o IFR mostra rapidamente condições de sobrecompra ou sobrevenda, sendo fácil de interpretar e pode ser combinado com outros indicadores.
O MACD combina a análise de tendência e momento, sendo visual e prático para identificar sinais de compra e venda.
Por fim, o OBV mostra o interesse dos participantes do mercado em determinada movimentação de preços, ajudando a confirmar tendências (mais volume = tendência mais forte). $B
{future}(UBUSDT)
{future}(LABUSDT)
{future}(BUSDT)
#trading #analysis #StrategicTrading #MACD #indicator
Indicadores de trading: quais são os principais e como usá-los a seu favor?
Os indicadores de trading são ferramentas fundamentais para quem busca tomar decisões baseadas em dados nos mercados financeiros.
Eles utilizam cálculos matemáticos aplicados aos preços, volumes e outros fatores de mercado para trazer informações relevantes sobre tendências, momento, volatilidade e força das movimentações de ativos.
$LAB Ao serem aplicados em gráficos, os indicadores ajudam os traders a identificar oportunidades, confirmar sinais de entrada e saída e gerenciar riscos de forma mais eficiente.
Entender como funcionam e quais são os mais utilizados é um passo essencial para aprimorar estratégias de negociação.
Por isso, neste artigo vamos te mostrar os principais indicadores de trading e como utilizá-los a seu favor nas operações. Vamos lá?
O que são indicadores de trading? $NFP
Indicadores de trading são ferramentas utilizadas por traders para analisar o comportamento do mercado financeiro e tomar decisões sobre compra e venda de ativos.
Esses indicadores são baseados em cálculos matemáticos aplicados a dados históricos de preços, volume ou outros fatores relacionados ao mercado. Isso significa que eles fazem parte da Análise Técnica.
Eles ajudam a identificar tendências, pontos de reversão, níveis de suporte e resistência, além de fornecer informações importantes sobre a força do mercado ou sobre possíveis movimentos futuros.
Os principais indicadores de trading podem ser divididos em 5 categorias:
Indicadores de tendência: identificam a direção geral do mercado. Exemplos: Média Móvel, MACD.Indicadores de momento: medem a força de um movimento de preço. Exemplos: IFR (Índice de Força Relativa) e estocástico.Indicadores de volatilidade: avaliam o grau de variação dos preços em determinado período. Exemplo: Bandas de Bollinger.Indicadores de volume: analisam o volume negociado para identificar a força de uma tendência. Exemplo: OBV (On Balance Volume).Indicadores de suporte e resistência: apontam possíveis zonas onde o preço pode parar ou reverter. Exemplos: pontos de pivô, retração de Fibonacci.
Principais indicadores de trading
Para você saber por onde pode começar a estudar os principais indicadores de trading, selecionamos os mais utilizados por traders profissionais.
Além disso, você pode conferir artigos específicos sobre cada um dos principais indicadores, com explicações completas para você se aprofundar neles. Vamos lá?
1. Média móvel
A média móvel é uma ferramenta que suaviza os preços ao longo de um período definido, ajudando a identificar tendências.
Existem dois tipos principais:
Média Móvel Simples: calcula a média dos preços em um período específico (exemplo: 10 dias).Média Móvel Exponencial: dá mais peso aos preços recentes, reagindo mais rápido às mudanças.
O cruzamento de médias (curta e longa) sinaliza compra ou venda. Se o preço estiver acima da média, sugere tendência de alta; abaixo, tendência de baixa.
2. Bandas de Bollinger
As Bandas de Bollinger consistem em três linhas:
Média móvel central: base para as bandas.Bandas superior e inferior: calculadas com base na volatilidade (desvio padrão).
Dessa forma, quando o preço atinge a banda superior, pode indicar sobrecompra; na inferior, sobrevenda.
3. MACD
O MACD mede a diferença entre duas médias móveis exponenciais (geralmente de 12 e 26 períodos). Ele inclui:
Linha MACD: diferença entre as médias móveis.Linha de sinal: média móvel da linha MACD.Histograma: diferença entre a linha MACD e a linha de sinal.
Assim, o cruzamento da linha MACD com a linha de sinal indica compra ou venda. O histograma positivo sugere alta; já o negativo sugere baixa.
4. Índice de Força Relativa (IFR)
O Índice de Força Relativa (IFR) mede a força dos movimentos de alta e baixa em um intervalo de 0 a 100.
IFR acima de 70 indica sobrecompra (possível reversão para baixa).IFR abaixo de 30 indica sobrevenda (possível reversão para alta).
Já as divergências entre o IFR e o preço podem sinalizar reversões.
5. Estocástico lento e estocástico rápido
O Estocástico compara o preço de fechamento com a faixa de preços em um período específico.
Estocástico rápido: reage rapidamente às mudanças de preço.Estocástico lento: é suavizado para reduzir ruídos.
Valores acima de 80 indicam sobrecompra; abaixo de 20, sobrevenda. Ademais, o cruzamento das linhas %K e %D sinaliza compra ou venda.
6. Retração de Fibonacci
Baseia-se nos níveis de retração (%), como 38,2%, 50% e 61,8%, que são usados para identificar possíveis zonas de suporte e resistência.
Após um movimento significativo, o preço frequentemente “retrai” para um desses níveis antes de continuar na direção original.
7. On Balance Volume (OBV)
O On Balance Volume (OBV) mede a força de uma tendência por meio da avaliação do volume de negociações.
Assim, ele funciona somando o volume de negociações em dias em que o preço aumenta e subtraindo o volume em dias em que o preço cai.
8. Nuvem de Ichimoku
É um indicador multifuncional que identifica suporte, resistência, tendência e força do mercado. Ele inclui:
Linha Tenkan-sen e Kijun-sen: médias móveis de curto e médio prazo.Senkou Span A e B: criam a “nuvem”, projetando suporte ou resistência futura.Linha Chikou Span: preço atrasado (lagging).
Se o preço estiver acima da nuvem, há tendência de alta; abaixo, tendência de baixa. Os cruzamentos das linhas Tenkan e Kijun geram sinais de compra e venda.
9. Oscilador de preço percentual (PPO)
Esse é um indicador de momentum que leva em conta a diferença entre duas médias móveis. Ela é usada para avaliar a tendência de um ativo.
O cálculo do PPO leva a diferença entre uma média móvel de curto prazo e outra de longo prazo.
10. Volume de balanço (OBV)
Esse é um indicador baseado no volume de negociação para medir a pressão de compra e venda de um ativo. Ou seja, ele calcula a atividade comercial acumulada de compradores e vendedores.
Ele foi criado por Joseph Granville e é útil para perceber o movimento de grandes investidores e prever mudanças na direção do mercado.
Quais indicadores técnicos aprender primeiro?
Se você está começando no trading, é ideal começar com os indicadores técnicos mais simples e bastante utilizados, que ajudam a entender tendências, força do mercado e pontos de reversão.
Como citamos anteriormente, as médias móveis são simples de entender e ajudam a identificar a tendência geral do mercado.
Já o IFR mostra rapidamente condições de sobrecompra ou sobrevenda, sendo fácil de interpretar e pode ser combinado com outros indicadores.
O MACD combina a análise de tendência e momento, sendo visual e prático para identificar sinais de compra e venda.
Por fim, o OBV mostra o interesse dos participantes do mercado em determinada movimentação de preços, ajudando a confirmar tendências (mais volume = tendência mais forte). $B
#trading #analysis #StrategicTrading #MACD #indicator
Eles utilizam cálculos matemáticos aplicados aos preços, volumes e outros fatores de mercado para trazer informações relevantes sobre tendências, momento, volatilidade e força das movimentações de ativos.
$LAB Ao serem aplicados em gráficos, os indicadores ajudam os traders a identificar oportunidades, confirmar sinais de entrada e saída e gerenciar riscos de forma mais eficiente.
Entender como funcionam e quais são os mais utilizados é um passo essencial para aprimorar estratégias de negociação.
Por isso, neste artigo vamos te mostrar os principais indicadores de trading e como utilizá-los a seu favor nas operações. Vamos lá?
O que são indicadores de trading? $NFP
Indicadores de trading são ferramentas utilizadas por traders para analisar o comportamento do mercado financeiro e tomar decisões sobre compra e venda de ativos.
Esses indicadores são baseados em cálculos matemáticos aplicados a dados históricos de preços, volume ou outros fatores relacionados ao mercado. Isso significa que eles fazem parte da Análise Técnica.
Eles ajudam a identificar tendências, pontos de reversão, níveis de suporte e resistência, além de fornecer informações importantes sobre a força do mercado ou sobre possíveis movimentos futuros.
Os principais indicadores de trading podem ser divididos em 5 categorias:
Indicadores de tendência: identificam a direção geral do mercado. Exemplos: Média Móvel, MACD.Indicadores de momento: medem a força de um movimento de preço. Exemplos: IFR (Índice de Força Relativa) e estocástico.Indicadores de volatilidade: avaliam o grau de variação dos preços em determinado período. Exemplo: Bandas de Bollinger.Indicadores de volume: analisam o volume negociado para identificar a força de uma tendência. Exemplo: OBV (On Balance Volume).Indicadores de suporte e resistência: apontam possíveis zonas onde o preço pode parar ou reverter. Exemplos: pontos de pivô, retração de Fibonacci.
Principais indicadores de trading
Para você saber por onde pode começar a estudar os principais indicadores de trading, selecionamos os mais utilizados por traders profissionais.
Além disso, você pode conferir artigos específicos sobre cada um dos principais indicadores, com explicações completas para você se aprofundar neles. Vamos lá?
1. Média móvel
A média móvel é uma ferramenta que suaviza os preços ao longo de um período definido, ajudando a identificar tendências.
Existem dois tipos principais:
Média Móvel Simples: calcula a média dos preços em um período específico (exemplo: 10 dias).Média Móvel Exponencial: dá mais peso aos preços recentes, reagindo mais rápido às mudanças.
O cruzamento de médias (curta e longa) sinaliza compra ou venda. Se o preço estiver acima da média, sugere tendência de alta; abaixo, tendência de baixa.
2. Bandas de Bollinger
As Bandas de Bollinger consistem em três linhas:
Média móvel central: base para as bandas.Bandas superior e inferior: calculadas com base na volatilidade (desvio padrão).
Dessa forma, quando o preço atinge a banda superior, pode indicar sobrecompra; na inferior, sobrevenda.
3. MACD
O MACD mede a diferença entre duas médias móveis exponenciais (geralmente de 12 e 26 períodos). Ele inclui:
Linha MACD: diferença entre as médias móveis.Linha de sinal: média móvel da linha MACD.Histograma: diferença entre a linha MACD e a linha de sinal.
Assim, o cruzamento da linha MACD com a linha de sinal indica compra ou venda. O histograma positivo sugere alta; já o negativo sugere baixa.
4. Índice de Força Relativa (IFR)
O Índice de Força Relativa (IFR) mede a força dos movimentos de alta e baixa em um intervalo de 0 a 100.
IFR acima de 70 indica sobrecompra (possível reversão para baixa).IFR abaixo de 30 indica sobrevenda (possível reversão para alta).
Já as divergências entre o IFR e o preço podem sinalizar reversões.
5. Estocástico lento e estocástico rápido
O Estocástico compara o preço de fechamento com a faixa de preços em um período específico.
Estocástico rápido: reage rapidamente às mudanças de preço.Estocástico lento: é suavizado para reduzir ruídos.
Valores acima de 80 indicam sobrecompra; abaixo de 20, sobrevenda. Ademais, o cruzamento das linhas %K e %D sinaliza compra ou venda.
6. Retração de Fibonacci
Baseia-se nos níveis de retração (%), como 38,2%, 50% e 61,8%, que são usados para identificar possíveis zonas de suporte e resistência.
Após um movimento significativo, o preço frequentemente “retrai” para um desses níveis antes de continuar na direção original.
7. On Balance Volume (OBV)
O On Balance Volume (OBV) mede a força de uma tendência por meio da avaliação do volume de negociações.
Assim, ele funciona somando o volume de negociações em dias em que o preço aumenta e subtraindo o volume em dias em que o preço cai.
8. Nuvem de Ichimoku
É um indicador multifuncional que identifica suporte, resistência, tendência e força do mercado. Ele inclui:
Linha Tenkan-sen e Kijun-sen: médias móveis de curto e médio prazo.Senkou Span A e B: criam a “nuvem”, projetando suporte ou resistência futura.Linha Chikou Span: preço atrasado (lagging).
Se o preço estiver acima da nuvem, há tendência de alta; abaixo, tendência de baixa. Os cruzamentos das linhas Tenkan e Kijun geram sinais de compra e venda.
9. Oscilador de preço percentual (PPO)
Esse é um indicador de momentum que leva em conta a diferença entre duas médias móveis. Ela é usada para avaliar a tendência de um ativo.
O cálculo do PPO leva a diferença entre uma média móvel de curto prazo e outra de longo prazo.
10. Volume de balanço (OBV)
Esse é um indicador baseado no volume de negociação para medir a pressão de compra e venda de um ativo. Ou seja, ele calcula a atividade comercial acumulada de compradores e vendedores.
Ele foi criado por Joseph Granville e é útil para perceber o movimento de grandes investidores e prever mudanças na direção do mercado.
Quais indicadores técnicos aprender primeiro?
Se você está começando no trading, é ideal começar com os indicadores técnicos mais simples e bastante utilizados, que ajudam a entender tendências, força do mercado e pontos de reversão.
Como citamos anteriormente, as médias móveis são simples de entender e ajudam a identificar a tendência geral do mercado.
Já o IFR mostra rapidamente condições de sobrecompra ou sobrevenda, sendo fácil de interpretar e pode ser combinado com outros indicadores.
O MACD combina a análise de tendência e momento, sendo visual e prático para identificar sinais de compra e venda.
Por fim, o OBV mostra o interesse dos participantes do mercado em determinada movimentação de preços, ajudando a confirmar tendências (mais volume = tendência mais forte). $B
#trading #analysis #StrategicTrading #MACD #indicator
2
4
2k
තවත් අන්තර්ගතයන් ගවේෂණය කිරීමට ඇතුල් වන්න
Binance චතුරශ්රය හි ගෝලීය ක්රිප්ටෝ පරිශීලකයින් හා එක්වන්න
⚡️ ක්රිප්ටෝ පිළිබඳ නවතම සහ ප්රයෝජනවත් තොරතුරු ලබා ගන්න.
💬 ලොව විශාලතම ක්රිප්ටෝ හුවමාරුව මගින් විශ්වාස කෙරේ.
👍 සත්යායනය කරන ලද නිර්මාණකරුවන්ගෙන් සැබෑ විදසුන් සොයා ගන්න.
විද්යුත් තැපෑල / දුරකථන අංකය
නැගී එන මාතෘකා
1
#USAugustPPIRisesLessThanExpected
52,374 views
822 සාකච්ඡා කරමින්
2
#SECApprovesNasdaqTexasCommodityTrustRule
28,143 views
600 සාකච්ඡා කරමින්
3
#ECBRaisesRatesSecondTimeTo2.5%
25,804 views
428 සාකච්ඡා කරමින්
4
#USContinuingJoblessClaims1.774M
34,248 views
522 සාකච්ඡා කරමින්
5
#USAugustPPIYoYRisesTo5.4%
32,792 views
405 සාකච්ඡා කරමින්
6
#AppleDebutsFoldablePhone
110,671 views
1,564 සාකච්ඡා කරමින්
7
#TSMCAugustRevenueUp53.3%YoY
27,249 views
558 සාකච්ඡා කරමින්
8
#IranSaysReadyToEscalateWarWithUS
39,044 views
539 සාකච්ඡා කරමින්
9
#EUExtendsCentralContactPointToCASPs
33,776 views
551 සාකච්ඡා කරමින්
10
#US10YTreasuryYieldHitsHighestSinceNov2023
72,348 views
856 සාකච්ඡා කරමින්