
#futuresanalysis
futuresanalysis
13,924 නැරඹීම්
51 සාකච්ඡා කරමින්
උණුසුම්
නවතම

·
--
$OKBUSDT — Bullish Pullback Strategy | Futures Analysis
OKB is showing positive short-term momentum after gaining approximately 3.37%, trading around $113.74. Buyers may attempt to extend the recovery, but a controlled pullback toward $112.50–$113.50 would offer a more realistic entry area.
EP: $112.50–$113.50
TP1: $115.00
TP2: $116.50
TP3: $118.00
SL: $111.00
Watch for a liquidity sweep near support followed by renewed buying pressure. A confirmed breakout above nearby resistance could support further upside, while a breakdown below $111.00 invalidates this setup.
Focus on confirmation, disciplined entries, and proper risk management.
#OKB #OKBUSDT #CryptoTrading #FuturesAnalysis #KOSPIFalls3.53%BackBelow6000 $AAPLB
$OKBUSDT — Bullish Pullback Strategy | Futures Analysis
OKB is showing positive short-term momentum after gaining approximately 3.37%, trading around $113.74. Buyers may attempt to extend the recovery, but a controlled pullback toward $112.50–$113.50 would offer a more realistic entry area.
EP: $112.50–$113.50
TP1: $115.00
TP2: $116.50
TP3: $118.00
SL: $111.00
Watch for a liquidity sweep near support followed by renewed buying pressure. A confirmed breakout above nearby resistance could support further upside, while a breakdown below $111.00 invalidates this setup.
Focus on confirmation, disciplined entries, and proper risk management.
#OKB #OKBUSDT #CryptoTrading #FuturesAnalysis #KOSPIFalls3.53%BackBelow6000 $AAPLB
OKB is showing positive short-term momentum after gaining approximately 3.37%, trading around $113.74. Buyers may attempt to extend the recovery, but a controlled pullback toward $112.50–$113.50 would offer a more realistic entry area.
EP: $112.50–$113.50
TP1: $115.00
TP2: $116.50
TP3: $118.00
SL: $111.00
Watch for a liquidity sweep near support followed by renewed buying pressure. A confirmed breakout above nearby resistance could support further upside, while a breakdown below $111.00 invalidates this setup.
Focus on confirmation, disciplined entries, and proper risk management.
#OKB #OKBUSDT #CryptoTrading #FuturesAnalysis #KOSPIFalls3.53%BackBelow6000 $AAPLB
25
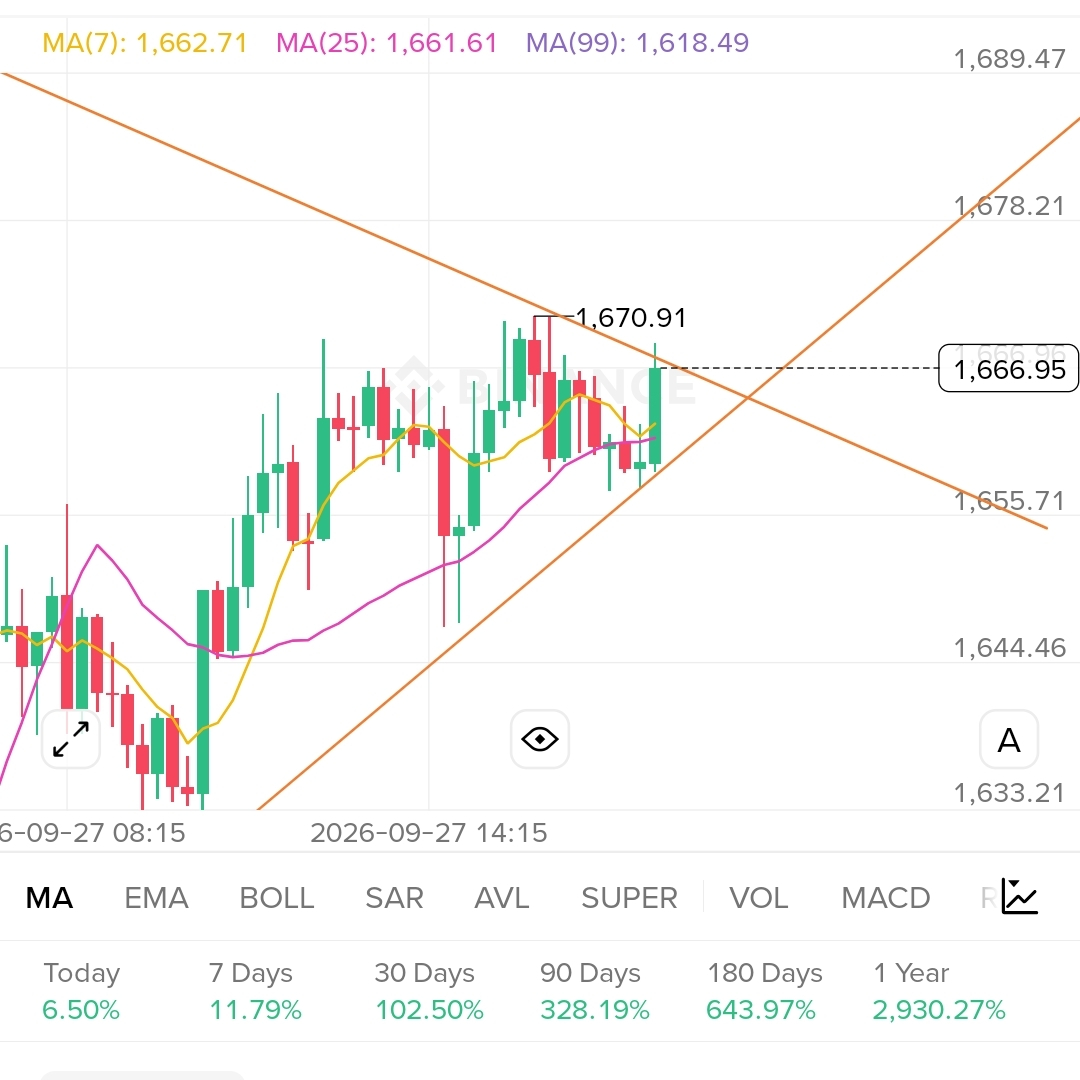
📈📉 Learning to read the room is crucial. Back when I blew my $600, I ignored the obvious. Extremely positive funding rates, like +0.03% and above consistently, tell you longs are paying dearly to stay in their positions. That's usually a warning sign – the market is crowded long, often signaling a local top before a correction. Pair this with the Long/Short Ratio. When it consistently climbs above 65-70% longs, it means the crowd is overwhelmingly biased one way. My rule: when both funding rate is significantly positive AND the Long/Short Ratio is above 65%, consider it a massive contrarian signal. The market is overleveraged, primed for a flush. Don't get caught in the cascade like I did initially. Stay sharp!
#CryptoTrading #FuturesAnalysis #SentimentIndicators #BinanceSquare
📈📉 Learning to read the room is crucial. Back when I blew my $600, I ignored the obvious. Extremely positive funding rates, like +0.03% and above consistently, tell you longs are paying dearly to stay in their positions. That's usually a warning sign – the market is crowded long, often signaling a local top before a correction. Pair this with the Long/Short Ratio. When it consistently climbs above 65-70% longs, it means the crowd is overwhelmingly biased one way. My rule: when both funding rate is significantly positive AND the Long/Short Ratio is above 65%, consider it a massive contrarian signal. The market is overleveraged, primed for a flush. Don't get caught in the cascade like I did initially. Stay sharp!
#CryptoTrading #FuturesAnalysis #SentimentIndicators #BinanceSquare
#CryptoTrading #FuturesAnalysis #SentimentIndicators #BinanceSquare
18

$XNO
{spot}(XNOUSDT)
+21% ke $0,385 Lalu Dibanting ke $0,308 dalam 15 Menit - Ini Surganya Futures!
1. 15M - LIKUIDASI PARTY [Gambar 1]*
BOLL(20,2): UP 0,369 MB 0,346 DN 0,324
Harga pump dari 0,340 ke 0,385 jebol Upper Band, lalu longsor langsung ke 0,318. Ini classic *Bollinger Squeeze & Fake Pump*.
RSI(6): *20,951* = OVERSOLD PARAH.
MACD: DIF -0,003 di bawah DEA 0,000 = Bearish kuat.
Artinya: Yang LONG di pucuk 0,385 pakai leverage besar, habis diliquid di 0,308. Futures bukan tempat FOMO.
2. 1D - DI UJUNG JURANG [Gambar 2]*
BOLL: DN 0,318. Harga sekarang NEMPEL di Lower Band.
RSI 30,980 - mau masuk oversold daily. Dari 0,306 naik ke 0,385, sekarang balik lagi ke titik awal.
3. 4H - TREN BESAR MASIH BEARISH [Gamb
ar 3]*
Dari 0,412 di 8 Sept, turun terus. MB 0,331 jadi resistance kuat. Selama di bawah 0,331, bearish belum selesai.
30 Hari -22,25% | 1 Tahun -63,57%
> *Karena volatilitas tanpa volume = mesin uang buat yang sabar, kuburan buat yang serakah.*
- *SCENARIO SHORT:* Di 15M & 1D, setiap retest MB 0,346 (15M) atau 0,331-0,340 (4H/1D) adalah area SHORT scalping dengan RR bagus. Target balik ke DN 0,305 - 0,308.
- *SCENARIO LONG:* Hanya untuk counter-trend scalper. RSI 15M 20,95 itu jenuh jual ekstrem. Bisa ada pantulan teknikal ke 0,324 - 0,338, tapi JANGAN HOLD LAMA. Ini bukan bottom, ini hanya pantulan karet.
Futures beda sama spot. Di spot kamu takut turun. Di futures, turun sedalam ini yang kita tunggu.
*Settingan Aman:*
Leverage max 3-5x aja, koin tipis spread lebar. SL wajib di atas 0,350 untuk short, atau di bawah 0,305 untuk long pantulan. Modal kecil, jangan all-in.
Vol 24j cuma 2,31M XNO ($817K) - artinya jangan pakai modal besar, rawan slippage.
Mau LONG pantulan atau SHORT lanjutan?
dyor $BTC
{future}(BTCUSDT)
#XNO🚀 #NANO #FuturesAnalysis #cryptotradingpro
$XNO
+21% ke $0,385 Lalu Dibanting ke $0,308 dalam 15 Menit - Ini Surganya Futures!
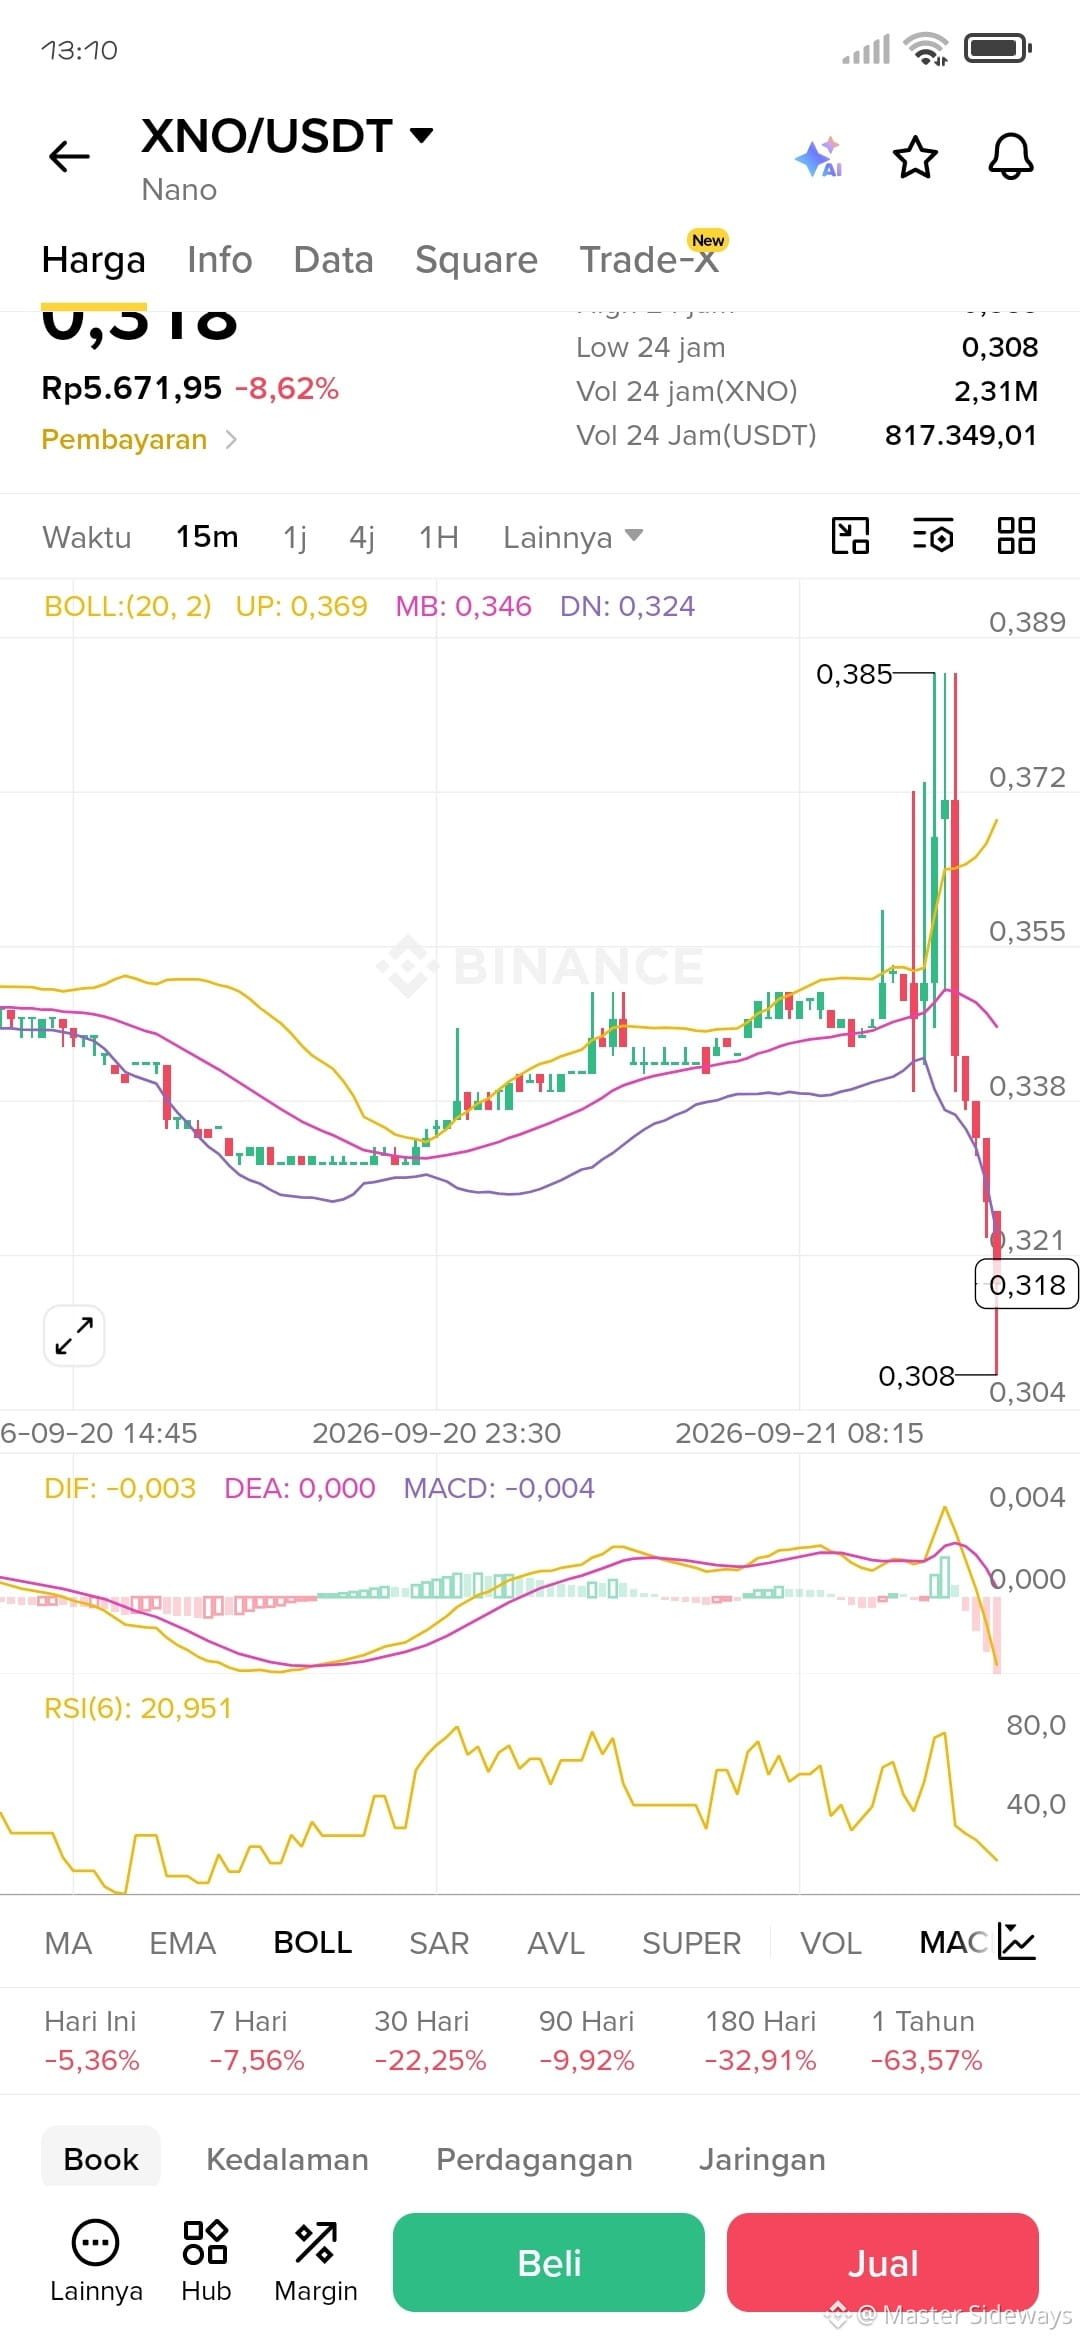
1. 15M - LIKUIDASI PARTY [Gambar 1]*
BOLL(20,2): UP 0,369 MB 0,346 DN 0,324
Harga pump dari 0,340 ke 0,385 jebol Upper Band, lalu longsor langsung ke 0,318. Ini classic *Bollinger Squeeze & Fake Pump*.
RSI(6): *20,951* = OVERSOLD PARAH.
MACD: DIF -0,003 di bawah DEA 0,000 = Bearish kuat.
Artinya: Yang LONG di pucuk 0,385 pakai leverage besar, habis diliquid di 0,308. Futures bukan tempat FOMO.
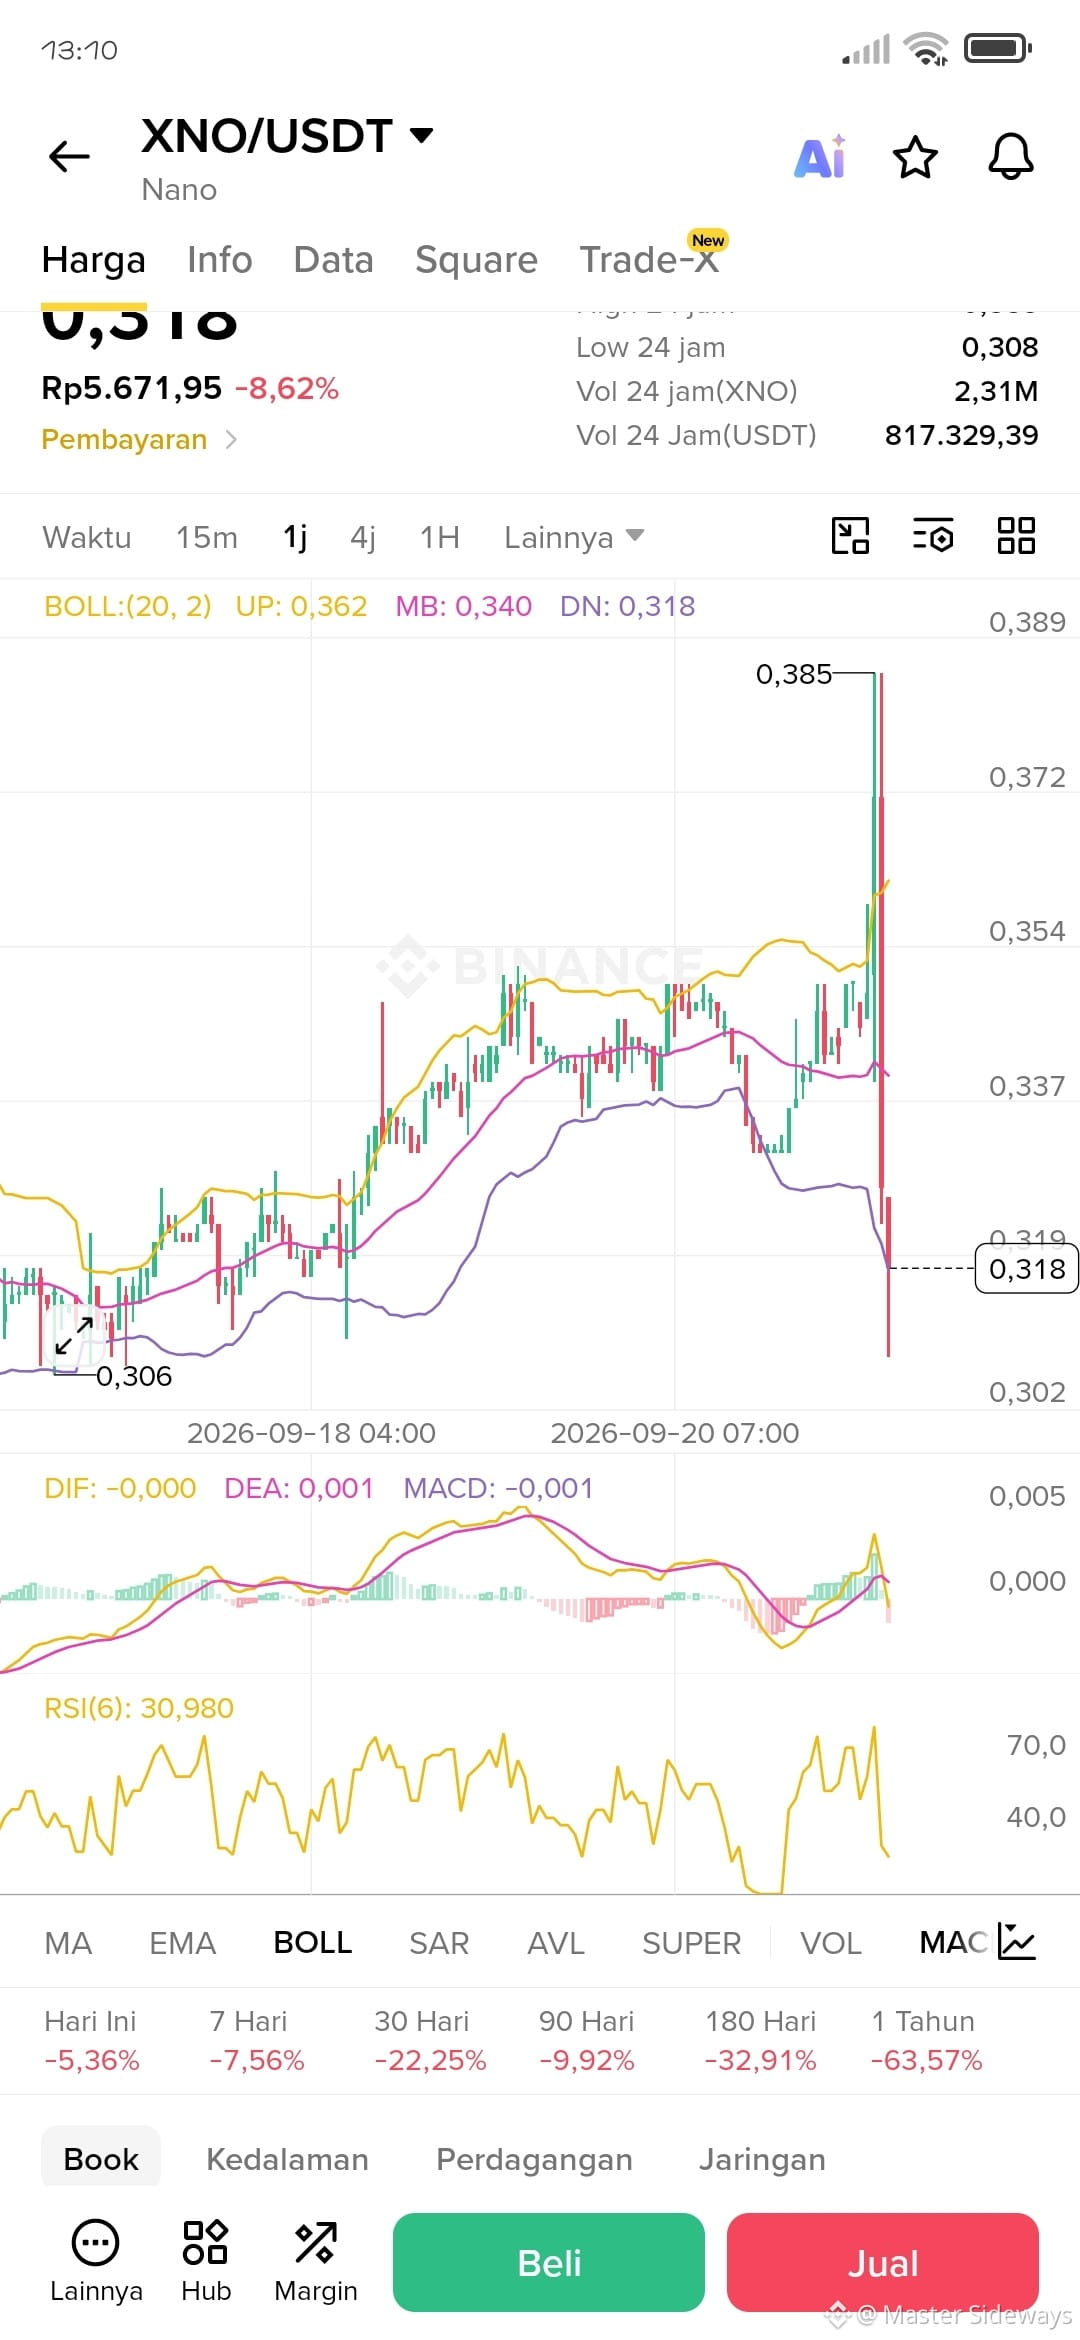
2. 1D - DI UJUNG JURANG [Gambar 2]*
BOLL: DN 0,318. Harga sekarang NEMPEL di Lower Band.
RSI 30,980 - mau masuk oversold daily. Dari 0,306 naik ke 0,385, sekarang balik lagi ke titik awal.
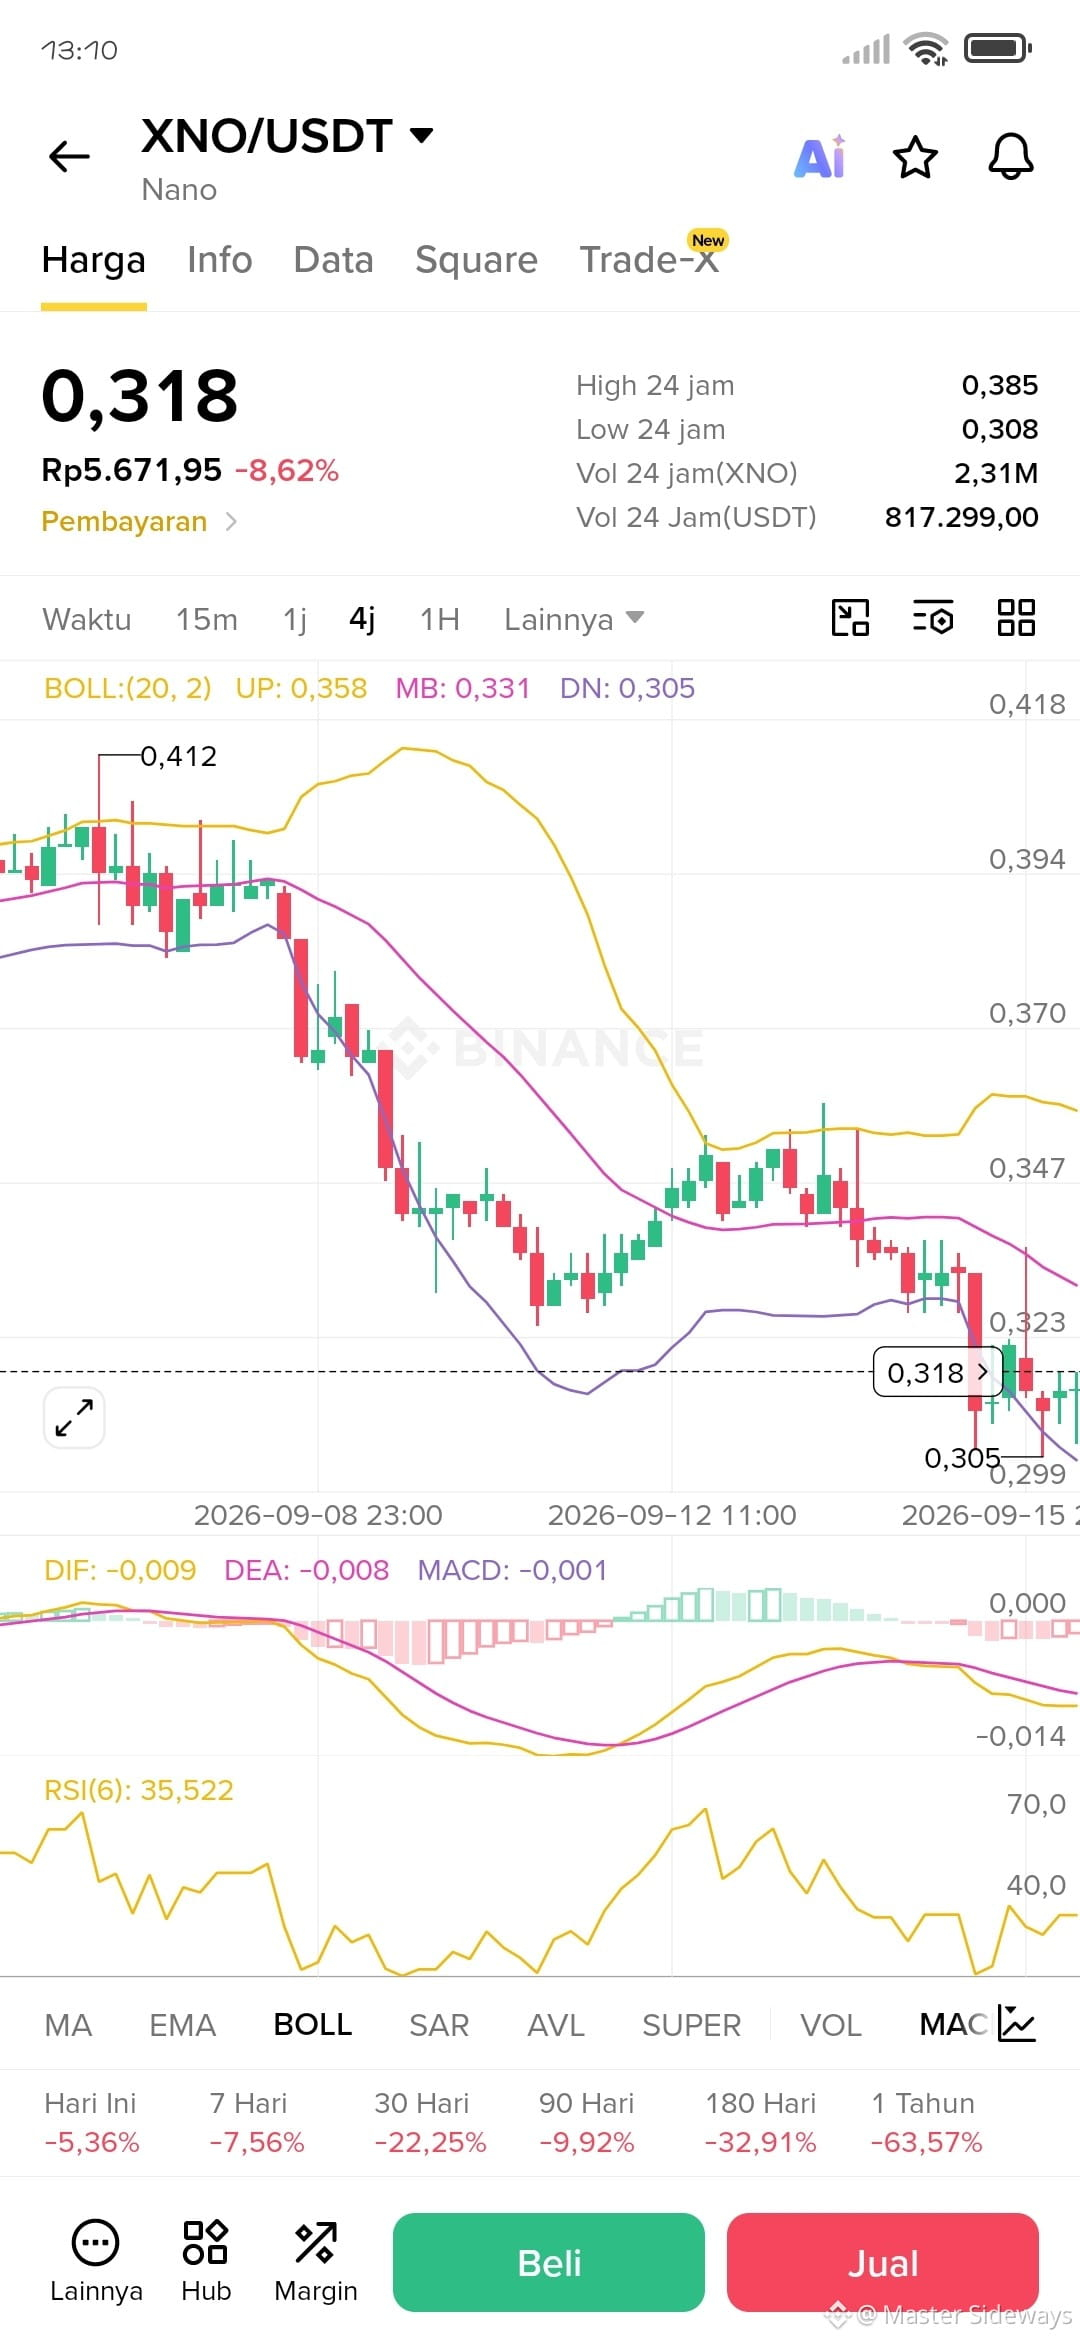
3. 4H - TREN BESAR MASIH BEARISH [Gamb
ar 3]*
Dari 0,412 di 8 Sept, turun terus. MB 0,331 jadi resistance kuat. Selama di bawah 0,331, bearish belum selesai.
30 Hari -22,25% | 1 Tahun -63,57%
> *Karena volatilitas tanpa volume = mesin uang buat yang sabar, kuburan buat yang serakah.*
- *SCENARIO SHORT:* Di 15M & 1D, setiap retest MB 0,346 (15M) atau 0,331-0,340 (4H/1D) adalah area SHORT scalping dengan RR bagus. Target balik ke DN 0,305 - 0,308.
- *SCENARIO LONG:* Hanya untuk counter-trend scalper. RSI 15M 20,95 itu jenuh jual ekstrem. Bisa ada pantulan teknikal ke 0,324 - 0,338, tapi JANGAN HOLD LAMA. Ini bukan bottom, ini hanya pantulan karet.
Futures beda sama spot. Di spot kamu takut turun. Di futures, turun sedalam ini yang kita tunggu.
*Settingan Aman:*
Leverage max 3-5x aja, koin tipis spread lebar. SL wajib di atas 0,350 untuk short, atau di bawah 0,305 untuk long pantulan. Modal kecil, jangan all-in.
Vol 24j cuma 2,31M XNO ($817K) - artinya jangan pakai modal besar, rawan slippage.
Mau LONG pantulan atau SHORT lanjutan?
dyor $BTC
#XNO🚀 #NANO #FuturesAnalysis #cryptotradingpro
+21% ke $0,385 Lalu Dibanting ke $0,308 dalam 15 Menit - Ini Surganya Futures!
1. 15M - LIKUIDASI PARTY [Gambar 1]*
BOLL(20,2): UP 0,369 MB 0,346 DN 0,324
Harga pump dari 0,340 ke 0,385 jebol Upper Band, lalu longsor langsung ke 0,318. Ini classic *Bollinger Squeeze & Fake Pump*.
RSI(6): *20,951* = OVERSOLD PARAH.
MACD: DIF -0,003 di bawah DEA 0,000 = Bearish kuat.
Artinya: Yang LONG di pucuk 0,385 pakai leverage besar, habis diliquid di 0,308. Futures bukan tempat FOMO.
2. 1D - DI UJUNG JURANG [Gambar 2]*
BOLL: DN 0,318. Harga sekarang NEMPEL di Lower Band.
RSI 30,980 - mau masuk oversold daily. Dari 0,306 naik ke 0,385, sekarang balik lagi ke titik awal.
3. 4H - TREN BESAR MASIH BEARISH [Gamb
ar 3]*
Dari 0,412 di 8 Sept, turun terus. MB 0,331 jadi resistance kuat. Selama di bawah 0,331, bearish belum selesai.
30 Hari -22,25% | 1 Tahun -63,57%
> *Karena volatilitas tanpa volume = mesin uang buat yang sabar, kuburan buat yang serakah.*
- *SCENARIO SHORT:* Di 15M & 1D, setiap retest MB 0,346 (15M) atau 0,331-0,340 (4H/1D) adalah area SHORT scalping dengan RR bagus. Target balik ke DN 0,305 - 0,308.
- *SCENARIO LONG:* Hanya untuk counter-trend scalper. RSI 15M 20,95 itu jenuh jual ekstrem. Bisa ada pantulan teknikal ke 0,324 - 0,338, tapi JANGAN HOLD LAMA. Ini bukan bottom, ini hanya pantulan karet.
Futures beda sama spot. Di spot kamu takut turun. Di futures, turun sedalam ini yang kita tunggu.
*Settingan Aman:*
Leverage max 3-5x aja, koin tipis spread lebar. SL wajib di atas 0,350 untuk short, atau di bawah 0,305 untuk long pantulan. Modal kecil, jangan all-in.
Vol 24j cuma 2,31M XNO ($817K) - artinya jangan pakai modal besar, rawan slippage.
Mau LONG pantulan atau SHORT lanjutan?
dyor $BTC
#XNO🚀 #NANO #FuturesAnalysis #cryptotradingpro
1
250

·
--
📊 $HBAR — Why It's Moving
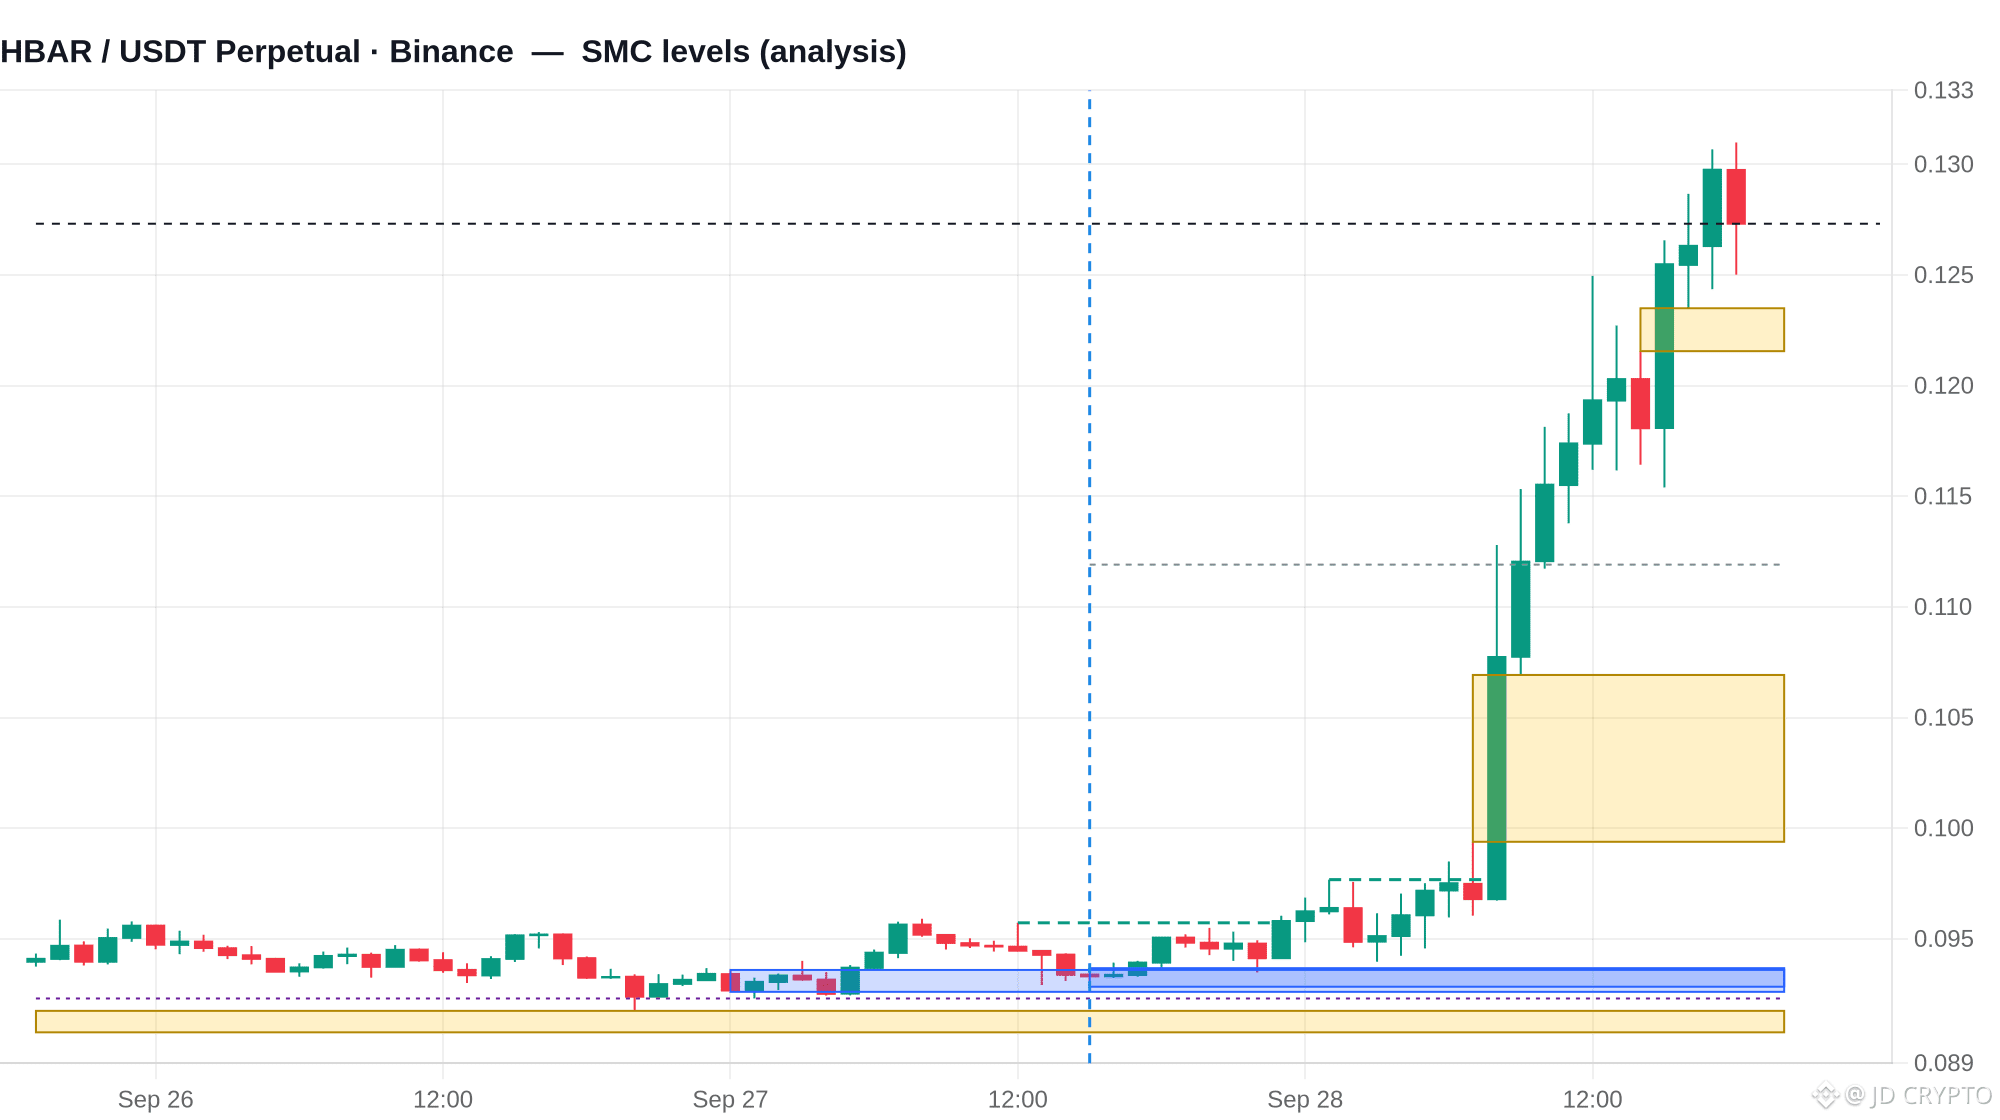
Well, HBAR has been on a serious run, kicking off its pump about 27 hours ago and gaining over 41% from its low. Looking at the volume, it’s pretty wild – nearly 13 times the normal volume during the pump, with seeing a massive 39.5x spike. The taker buy share was exactly 50%, which, honestly, feels a bit thin for such a big move; it doesn't scream broad participation, more like an aggressive push. Hedera is a decentralized public network focused on secure, fair applications with near real-time consensus, governed by a global council of major companies. The upside potential here is limited, with only about a 2.88% move needed to retest the recent peak. On the flip side, there's a bullish FVG around 3% down. Right now, risk is HIGH on BOTH SIDES. Buying more here is risky because the price has already run a lot, it’s in a premium zone, and momentum indicators are overheated. Selling or shorting is also HIGHLY risky because the market structure is still very bullish, fresh highs are being printed, and there’s no downside break yet. It’s a tricky spot where patience might be the best strategy before making a move. Remember, don't chase pumps blindly; always consider the underlying risk.
📈 Quick Stats
• 24h move: +34.1%
• Pump began: about 27 hours ago from 0.09284 (+41.1% to a peak of 0.13099)
• Volume: $777.10M in 24h; the run is trading at ~12.9x its normal hourly volume, buyers took ~50% of the flow
• Upside potential: ~2.88% to a retest of the peak at 0.13099
• Pullback risk: ~3% down to the nearest support zone (0.12156 - 0.1235)
• Buying more here: HIGH risk | Selling/shorting here: HIGH risk
• Riskier side right now: both sides (no clear edge, waiting is better)
⚠️ Analysis only — not a trade signal, not financial advice.
#Crypto #Binance #FuturesAnalysis #HBAR
📊 $HBAR — Why It's Moving
Well, HBAR has been on a serious run, kicking off its pump about 27 hours ago and gaining over 41% from its low. Looking at the volume, it’s pretty wild – nearly 13 times the normal volume during the pump, with seeing a massive 39.5x spike. The taker buy share was exactly 50%, which, honestly, feels a bit thin for such a big move; it doesn't scream broad participation, more like an aggressive push. Hedera is a decentralized public network focused on secure, fair applications with near real-time consensus, governed by a global council of major companies. The upside potential here is limited, with only about a 2.88% move needed to retest the recent peak. On the flip side, there's a bullish FVG around 3% down. Right now, risk is HIGH on BOTH SIDES. Buying more here is risky because the price has already run a lot, it’s in a premium zone, and momentum indicators are overheated. Selling or shorting is also HIGHLY risky because the market structure is still very bullish, fresh highs are being printed, and there’s no downside break yet. It’s a tricky spot where patience might be the best strategy before making a move. Remember, don't chase pumps blindly; always consider the underlying risk.
📈 Quick Stats
• 24h move: +34.1%
• Pump began: about 27 hours ago from 0.09284 (+41.1% to a peak of 0.13099)
• Volume: $777.10M in 24h; the run is trading at ~12.9x its normal hourly volume, buyers took ~50% of the flow
• Upside potential: ~2.88% to a retest of the peak at 0.13099
• Pullback risk: ~3% down to the nearest support zone (0.12156 - 0.1235)
• Buying more here: HIGH risk | Selling/shorting here: HIGH risk
• Riskier side right now: both sides (no clear edge, waiting is better)
⚠️ Analysis only — not a trade signal, not financial advice.
#Crypto #Binance #FuturesAnalysis #HBAR
Well, HBAR has been on a serious run, kicking off its pump about 27 hours ago and gaining over 41% from its low. Looking at the volume, it’s pretty wild – nearly 13 times the normal volume during the pump, with seeing a massive 39.5x spike. The taker buy share was exactly 50%, which, honestly, feels a bit thin for such a big move; it doesn't scream broad participation, more like an aggressive push. Hedera is a decentralized public network focused on secure, fair applications with near real-time consensus, governed by a global council of major companies. The upside potential here is limited, with only about a 2.88% move needed to retest the recent peak. On the flip side, there's a bullish FVG around 3% down. Right now, risk is HIGH on BOTH SIDES. Buying more here is risky because the price has already run a lot, it’s in a premium zone, and momentum indicators are overheated. Selling or shorting is also HIGHLY risky because the market structure is still very bullish, fresh highs are being printed, and there’s no downside break yet. It’s a tricky spot where patience might be the best strategy before making a move. Remember, don't chase pumps blindly; always consider the underlying risk.
📈 Quick Stats
• 24h move: +34.1%
• Pump began: about 27 hours ago from 0.09284 (+41.1% to a peak of 0.13099)
• Volume: $777.10M in 24h; the run is trading at ~12.9x its normal hourly volume, buyers took ~50% of the flow
• Upside potential: ~2.88% to a retest of the peak at 0.13099
• Pullback risk: ~3% down to the nearest support zone (0.12156 - 0.1235)
• Buying more here: HIGH risk | Selling/shorting here: HIGH risk
• Riskier side right now: both sides (no clear edge, waiting is better)
⚠️ Analysis only — not a trade signal, not financial advice.
#Crypto #Binance #FuturesAnalysis #HBAR
53

JCTUSDT Futures: Uzun Vadeli Büyüme Tehlikesi | JCTUSDT Futures: Long-Term Bullish Signal
🇹🇷 TÜRKÇE
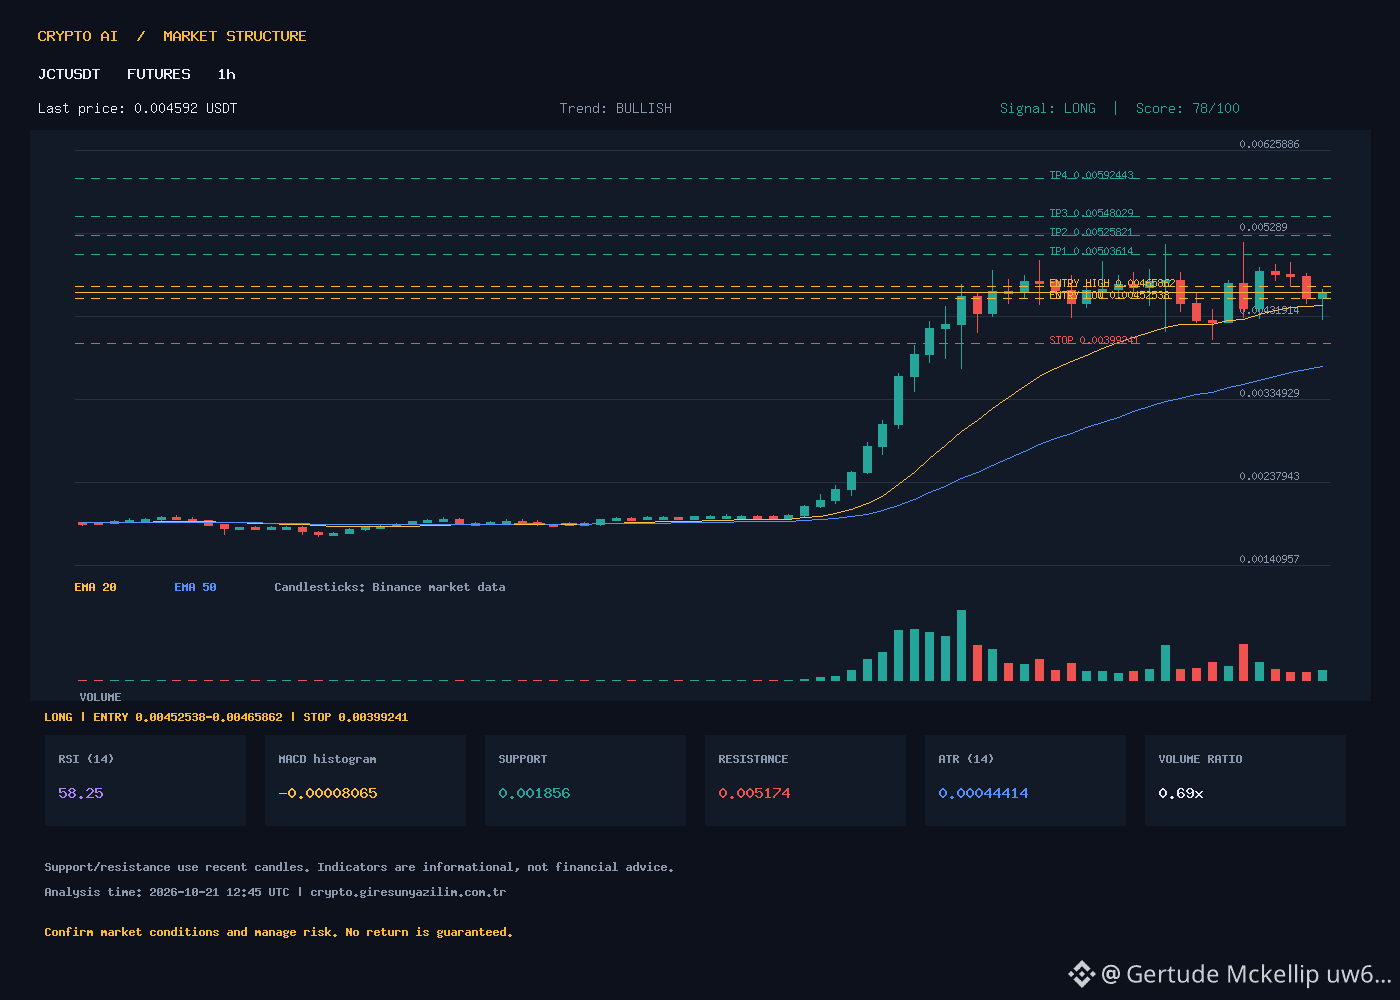
JCTUSDT Futures grafikleri 1 saatlik zaman diliminde büyük bir yükseliş trendi gösteriyor. Şu an fiyat 0.004592 seviyesinde. RSI 58.25 ile nötr bölge, MACD histrogramı negatif (-0.00008065) seviyelerde. EMA20 (0.004442) ve EMA50 (0.003735) fiyatın üstünde, trend güçlü. ATR 0.00044414 volatilite gösteriyor.
**Trade Plan (ATR bazlı senaryolar):**
- **Sinyal:** LONG
- **Giriş:** 0.00452538 - 0.00465862
- **Stop-Loss:** 0.00399241
- **TP1:** 0.00503614
- **TP2:** 0.00525821
- **TP3:** 0.00548029
- **TP4:** 0.00592443
Destek: 0.001856, Direnç: 0.005174. Volume oranı 0.69 seviyesinde.
🇬🇧 ENGLISH
JCTUSDT Futures charts show strong bullish momentum on the 1-hour timeframe. Current price stands at 0.004592. RSI at 58.25 indicates neutral territory, MACD histogram negative (-0.00008065). EMA20 (0.004442) and EMA50 (0.003735) positioned above price, confirming strong trend. ATR at 0.00044414 reflects volatility levels.
**Trade Plan (ATR-based scenarios):**
- **Signal:** LONG
- **Entry:** 0.00452538 - 0.00465862
- **Stop-Loss:** 0.00399241
- **TP1:** 0.00503614
- **TP2:** 0.00525821
- **TP3:** 0.00548029
- **TP4:** 0.00592443
Support: 0.001856, Resistance: 0.005174. Volume ratio at 0.69.
#JCTUSDT #FuturesAnalysis #LONGSignal #ATRStrategy #CryptoTrading
JCTUSDT Futures: Uzun Vadeli Büyüme Tehlikesi | JCTUSDT Futures: Long-Term Bullish Signal
🇹🇷 TÜRKÇE
JCTUSDT Futures grafikleri 1 saatlik zaman diliminde büyük bir yükseliş trendi gösteriyor. Şu an fiyat 0.004592 seviyesinde. RSI 58.25 ile nötr bölge, MACD histrogramı negatif (-0.00008065) seviyelerde. EMA20 (0.004442) ve EMA50 (0.003735) fiyatın üstünde, trend güçlü. ATR 0.00044414 volatilite gösteriyor.
**Trade Plan (ATR bazlı senaryolar):**
- **Sinyal:** LONG
- **Giriş:** 0.00452538 - 0.00465862
- **Stop-Loss:** 0.00399241
- **TP1:** 0.00503614
- **TP2:** 0.00525821
- **TP3:** 0.00548029
- **TP4:** 0.00592443
Destek: 0.001856, Direnç: 0.005174. Volume oranı 0.69 seviyesinde.
🇬🇧 ENGLISH
JCTUSDT Futures charts show strong bullish momentum on the 1-hour timeframe. Current price stands at 0.004592. RSI at 58.25 indicates neutral territory, MACD histogram negative (-0.00008065). EMA20 (0.004442) and EMA50 (0.003735) positioned above price, confirming strong trend. ATR at 0.00044414 reflects volatility levels.
**Trade Plan (ATR-based scenarios):**
- **Signal:** LONG
- **Entry:** 0.00452538 - 0.00465862
- **Stop-Loss:** 0.00399241
- **TP1:** 0.00503614
- **TP2:** 0.00525821
- **TP3:** 0.00548029
- **TP4:** 0.00592443
Support: 0.001856, Resistance: 0.005174. Volume ratio at 0.69.
#JCTUSDT #FuturesAnalysis #LONGSignal #ATRStrategy #CryptoTrading
🇹🇷 TÜRKÇE
JCTUSDT Futures grafikleri 1 saatlik zaman diliminde büyük bir yükseliş trendi gösteriyor. Şu an fiyat 0.004592 seviyesinde. RSI 58.25 ile nötr bölge, MACD histrogramı negatif (-0.00008065) seviyelerde. EMA20 (0.004442) ve EMA50 (0.003735) fiyatın üstünde, trend güçlü. ATR 0.00044414 volatilite gösteriyor.
**Trade Plan (ATR bazlı senaryolar):**
- **Sinyal:** LONG
- **Giriş:** 0.00452538 - 0.00465862
- **Stop-Loss:** 0.00399241
- **TP1:** 0.00503614
- **TP2:** 0.00525821
- **TP3:** 0.00548029
- **TP4:** 0.00592443
Destek: 0.001856, Direnç: 0.005174. Volume oranı 0.69 seviyesinde.
🇬🇧 ENGLISH
JCTUSDT Futures charts show strong bullish momentum on the 1-hour timeframe. Current price stands at 0.004592. RSI at 58.25 indicates neutral territory, MACD histogram negative (-0.00008065). EMA20 (0.004442) and EMA50 (0.003735) positioned above price, confirming strong trend. ATR at 0.00044414 reflects volatility levels.
**Trade Plan (ATR-based scenarios):**
- **Signal:** LONG
- **Entry:** 0.00452538 - 0.00465862
- **Stop-Loss:** 0.00399241
- **TP1:** 0.00503614
- **TP2:** 0.00525821
- **TP3:** 0.00548029
- **TP4:** 0.00592443
Support: 0.001856, Resistance: 0.005174. Volume ratio at 0.69.
#JCTUSDT #FuturesAnalysis #LONGSignal #ATRStrategy #CryptoTrading
4
NEARUSDT / NEARUSD — Aşırı Düşüşte Uzun Poşlar, ATR Bazlı Seviyeler
🇹🇷 TÜRKÇE
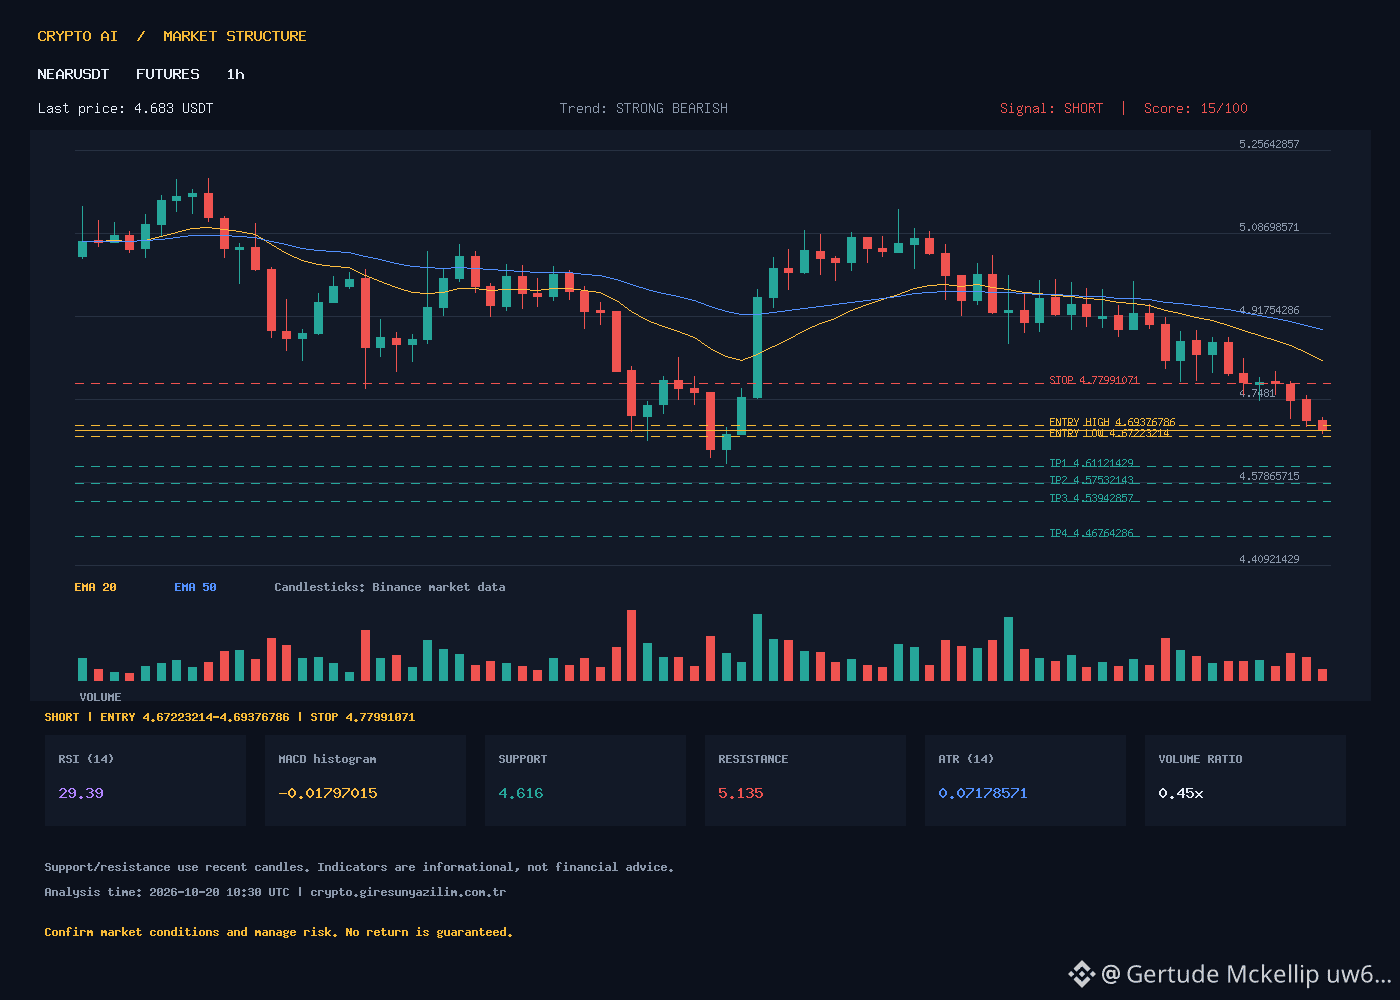
NEAR/USDT 1 saatte STRONG BEARİŞ trendinde. Fiyat 4.683, RSI 29.39, EMA20/50/200 çapları aşağıdaki gibi. MACD negatif histogram var. ATR 0.0718, destek 4.616, direzi 5.135. Hacim ordu yüzde 0.45 düşük. Puan 15, Sinyal SHORT.
Uzun tarafta giriş aralığı: 4.6722–4.6938. Stop stoplos: 4.7799. TP1: 4.6112, TP2: 4.5753, TP3: 4.5394, TP4: 4.4676. Seviyeler ATR bazlı örneki; garanti değildir. Riski destekle doğrudan karşılaştırın.
🇬🇧 ENGLISH
NEAR/USDT on the hourly chart shows a STRONG BEARISH trend. Price at 4.683, RSI 29.39, EMA20/50/200 values as above. MACD negative histogram present. ATR 0.0718, support 4.616, resistance 5.135. Volume ratio down 0.45. Score 15, Signal SHORT.
For a long setup, entry range is 4.6722–4.6938. Stop loss at 4.7799. TP1: 4.6112, TP2: 4.5753, TP3: 4.5394, TP4: 4.4676. Levels are ATR-based scenarios, not guaranteed outcomes. Compare risk against support proximity.
#NEAR #NEARUSDT #FuturesAnalysis #CryptoTechnicalAnalysis #TradingSetup
NEARUSDT / NEARUSD — Aşırı Düşüşte Uzun Poşlar, ATR Bazlı Seviyeler
🇹🇷 TÜRKÇE
NEAR/USDT 1 saatte STRONG BEARİŞ trendinde. Fiyat 4.683, RSI 29.39, EMA20/50/200 çapları aşağıdaki gibi. MACD negatif histogram var. ATR 0.0718, destek 4.616, direzi 5.135. Hacim ordu yüzde 0.45 düşük. Puan 15, Sinyal SHORT.
Uzun tarafta giriş aralığı: 4.6722–4.6938. Stop stoplos: 4.7799. TP1: 4.6112, TP2: 4.5753, TP3: 4.5394, TP4: 4.4676. Seviyeler ATR bazlı örneki; garanti değildir. Riski destekle doğrudan karşılaştırın.
🇬🇧 ENGLISH
NEAR/USDT on the hourly chart shows a STRONG BEARISH trend. Price at 4.683, RSI 29.39, EMA20/50/200 values as above. MACD negative histogram present. ATR 0.0718, support 4.616, resistance 5.135. Volume ratio down 0.45. Score 15, Signal SHORT.
For a long setup, entry range is 4.6722–4.6938. Stop loss at 4.7799. TP1: 4.6112, TP2: 4.5753, TP3: 4.5394, TP4: 4.4676. Levels are ATR-based scenarios, not guaranteed outcomes. Compare risk against support proximity.
#NEAR #NEARUSDT #FuturesAnalysis #CryptoTechnicalAnalysis #TradingSetup
🇹🇷 TÜRKÇE
NEAR/USDT 1 saatte STRONG BEARİŞ trendinde. Fiyat 4.683, RSI 29.39, EMA20/50/200 çapları aşağıdaki gibi. MACD negatif histogram var. ATR 0.0718, destek 4.616, direzi 5.135. Hacim ordu yüzde 0.45 düşük. Puan 15, Sinyal SHORT.
Uzun tarafta giriş aralığı: 4.6722–4.6938. Stop stoplos: 4.7799. TP1: 4.6112, TP2: 4.5753, TP3: 4.5394, TP4: 4.4676. Seviyeler ATR bazlı örneki; garanti değildir. Riski destekle doğrudan karşılaştırın.
🇬🇧 ENGLISH
NEAR/USDT on the hourly chart shows a STRONG BEARISH trend. Price at 4.683, RSI 29.39, EMA20/50/200 values as above. MACD negative histogram present. ATR 0.0718, support 4.616, resistance 5.135. Volume ratio down 0.45. Score 15, Signal SHORT.
For a long setup, entry range is 4.6722–4.6938. Stop loss at 4.7799. TP1: 4.6112, TP2: 4.5753, TP3: 4.5394, TP4: 4.4676. Levels are ATR-based scenarios, not guaranteed outcomes. Compare risk against support proximity.
#NEAR #NEARUSDT #FuturesAnalysis #CryptoTechnicalAnalysis #TradingSetup
4

·
--
උසබ තත්ත්වය
🚨 Polkadot Futures: Is the Coast Clear for LONGs or SHORTs?
$DOT
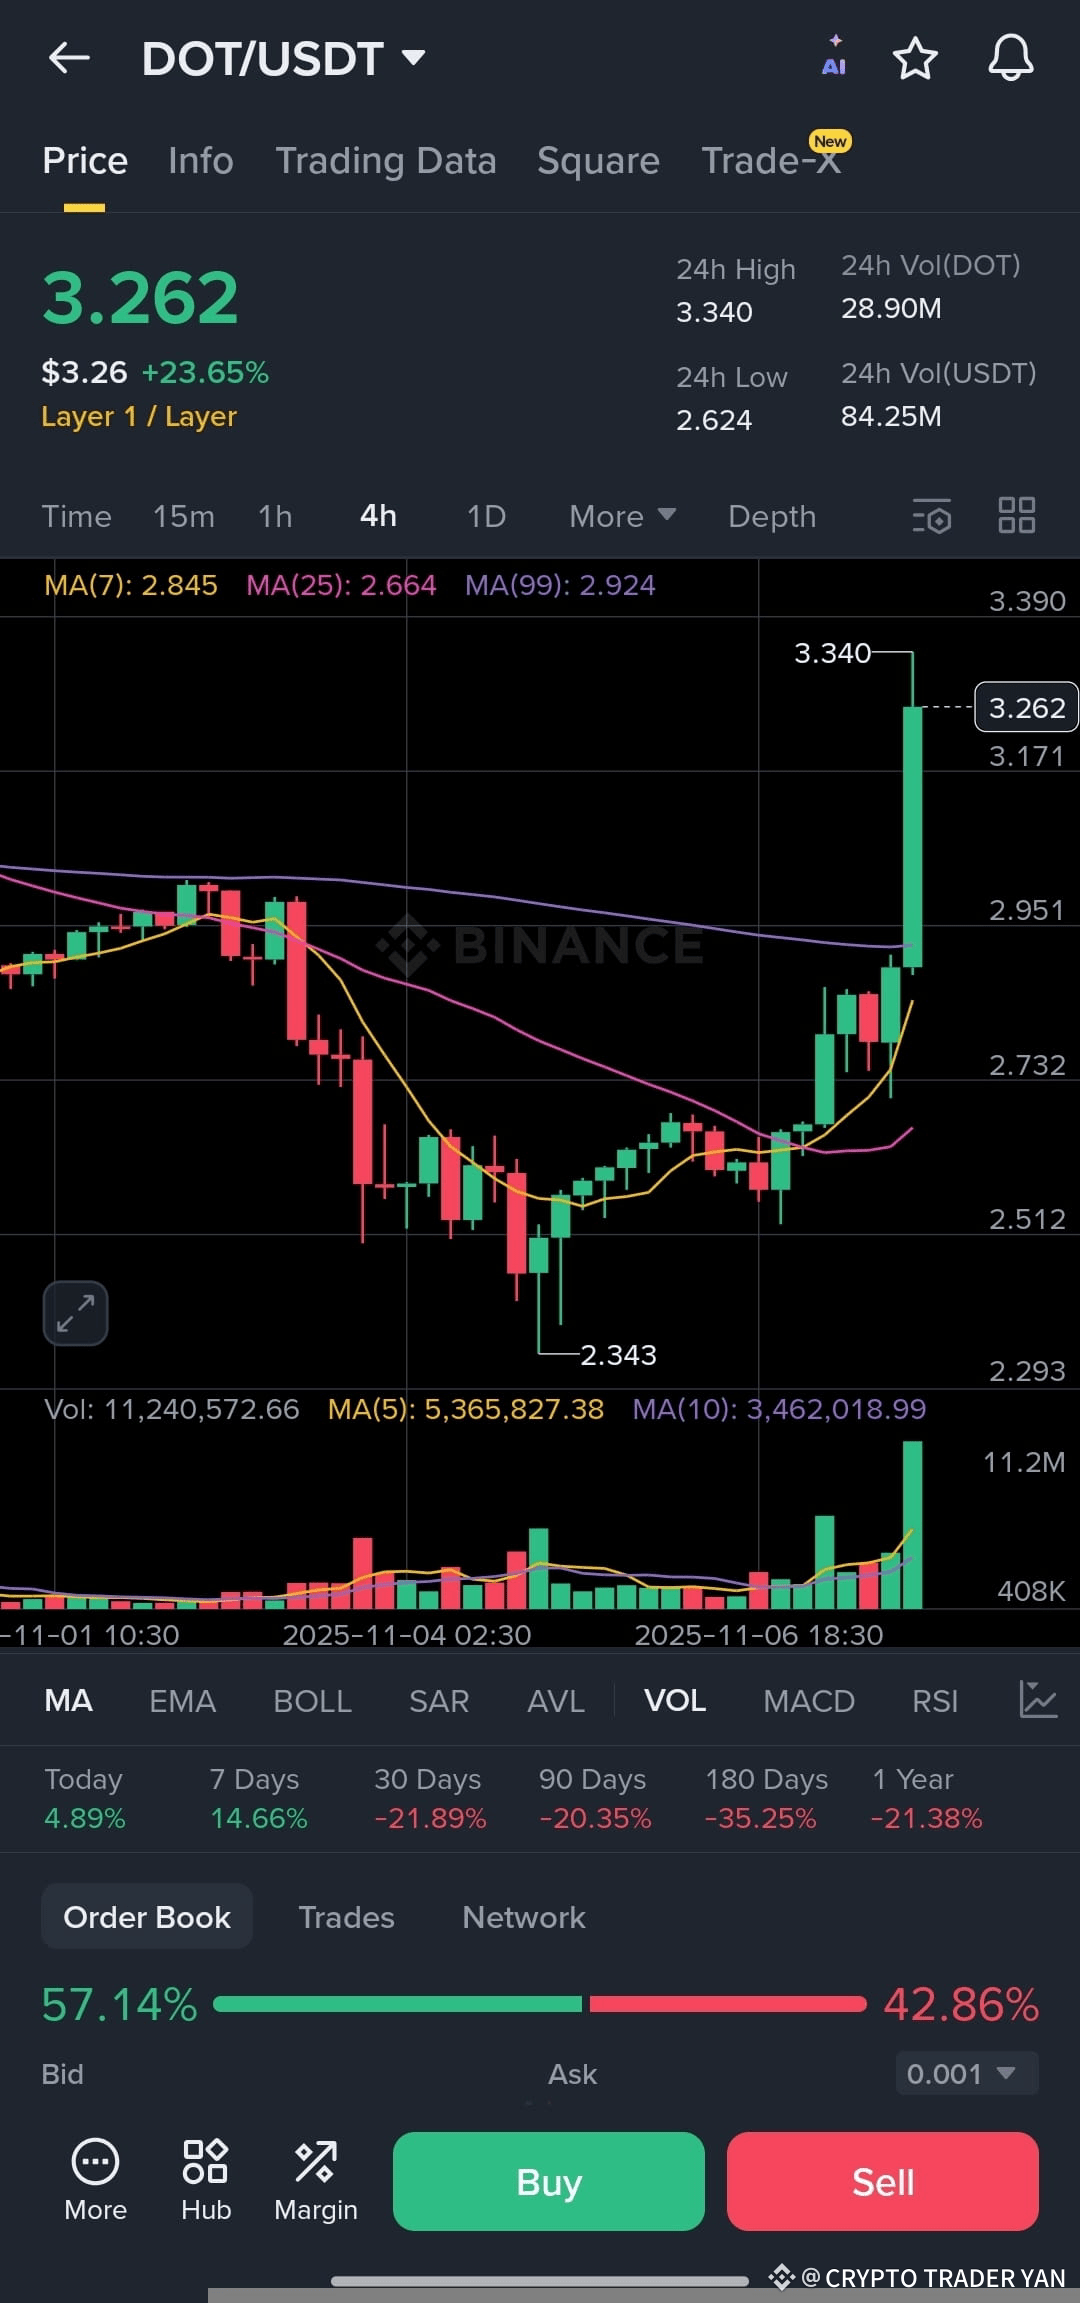
Futures traders, listen up! The DOT/USDT battleground is heating up. Right now, the price is consolidating around a critical area (near $2.90-$3.00), which is a huge decision point.
For a LONG position, we need to see clear conviction—a strong break and hold above $3.15, ideally fueled by positive Funding Rates (meaning longs are paying shorts) and rising Open Interest (new money entering). Target the next resistance at $3.30, but keep that Stop-Loss tight below the consolidation low! 🟢
$DOT
For a SHORT position, the bears are hunting a drop below the immediate support around $2.80. If that level breaks with increasing volume, it signals a high-probability flush down to the next support at $2.60. Look for negative funding rates to confirm the market bias. Remember, high leverage means high risk—trade with caution! 🔴
The macro environment (Polkadot 2.0, elastic scaling) favors long-term bulls, but futures trading is all about the immediate momentum. Don't trade the news; trade the chart!
$DOT
{future}(DOTUSDT)
#DOTFutures #CryptoTrading #LongOrShort #FuturesAnalysis #Polkadot
🚨 Polkadot Futures: Is the Coast Clear for LONGs or SHORTs?
$DOT
Futures traders, listen up! The DOT/USDT battleground is heating up. Right now, the price is consolidating around a critical area (near $2.90-$3.00), which is a huge decision point.
For a LONG position, we need to see clear conviction—a strong break and hold above $3.15, ideally fueled by positive Funding Rates (meaning longs are paying shorts) and rising Open Interest (new money entering). Target the next resistance at $3.30, but keep that Stop-Loss tight below the consolidation low! 🟢
$DOT
For a SHORT position, the bears are hunting a drop below the immediate support around $2.80. If that level breaks with increasing volume, it signals a high-probability flush down to the next support at $2.60. Look for negative funding rates to confirm the market bias. Remember, high leverage means high risk—trade with caution! 🔴
The macro environment (Polkadot 2.0, elastic scaling) favors long-term bulls, but futures trading is all about the immediate momentum. Don't trade the news; trade the chart!
$DOT
#DOTFutures #CryptoTrading #LongOrShort #FuturesAnalysis #Polkadot
$DOT
Futures traders, listen up! The DOT/USDT battleground is heating up. Right now, the price is consolidating around a critical area (near $2.90-$3.00), which is a huge decision point.
For a LONG position, we need to see clear conviction—a strong break and hold above $3.15, ideally fueled by positive Funding Rates (meaning longs are paying shorts) and rising Open Interest (new money entering). Target the next resistance at $3.30, but keep that Stop-Loss tight below the consolidation low! 🟢
$DOT
For a SHORT position, the bears are hunting a drop below the immediate support around $2.80. If that level breaks with increasing volume, it signals a high-probability flush down to the next support at $2.60. Look for negative funding rates to confirm the market bias. Remember, high leverage means high risk—trade with caution! 🔴
The macro environment (Polkadot 2.0, elastic scaling) favors long-term bulls, but futures trading is all about the immediate momentum. Don't trade the news; trade the chart!
$DOT
#DOTFutures #CryptoTrading #LongOrShort #FuturesAnalysis #Polkadot
1
2
280
තවත් අන්තර්ගතයන් ගවේෂණය කිරීමට ඇතුල් වන්න
Binance චතුරශ්රය හි ගෝලීය ක්රිප්ටෝ පරිශීලකයින් හා එක්වන්න
⚡️ ක්රිප්ටෝ පිළිබඳ නවතම සහ ප්රයෝජනවත් තොරතුරු ලබා ගන්න.
💬 ලොව විශාලතම ක්රිප්ටෝ හුවමාරුව මගින් විශ්වාස කෙරේ.
👍 සත්යායනය කරන ලද නිර්මාණකරුවන්ගෙන් සැබෑ විදසුන් සොයා ගන්න.
විද්යුත් තැපෑල / දුරකථන අංකය
නැගී එන මාතෘකා
1
#WhoWillSucceedJensenHuangatNvidia?
123,077 නැරඹීම්
1,420 සාකච්ඡා කරමින්
2
#WhatWillDriveCryptoandStocks’NextRebound?
506,875 නැරඹීම්
3,297 සාකච්ඡා කරමින්
3
#BitcoinActiveSupplyInProfitDropsBelow45%
49,611 නැරඹීම්
569 සාකච්ඡා කරමින්
4
#KavaSaysAbnormalActivityLimitedToKavaLend
25,425 නැරඹීම්
310 සාකච්ඡා කරමින්
5
#USSpotXRPETFsSeeLargestWeeklyOutflowIn8Months
19,640 නැරඹීම්
265 සාකච්ඡා කරමින්
6
#USPPIMissMayEaseBTCPressure
252,587 නැරඹීම්
2,172 සාකච්ඡා කරමින්
7
#WORPTLetsTouristsConvertCryptoToThaiBaht
6,838 නැරඹීම්
78 සාකච්ඡා කරමින්
8
#TONStrategyReports$23.97MQ3NetLoss
7,533 නැරඹීම්
41 සාකච්ඡා කරමින්
9
#PolkadotCommunityApprovesNewStrategyWith97%Vote
23,818 නැරඹීම්
275 සාකච්ඡා කරමින්
10
#dYdXPlansV9.9UpgradeToShiftUSDCToInjective
18,580 නැරඹීම්
227 සාකච්ඡා කරමින්