
#footprintchart
footprintchart
61 නැරඹීම්
2 සාකච්ඡා කරමින්
උණුසුම්
නවතම


📊 BTC FOOTPRINT ANALYSIS: WHAT ARE BUYERS AND SELLERS TELLING US?
Let’s break down this BTCUSDT 15-minute footprint chart and understand what’s happening behind the candles.
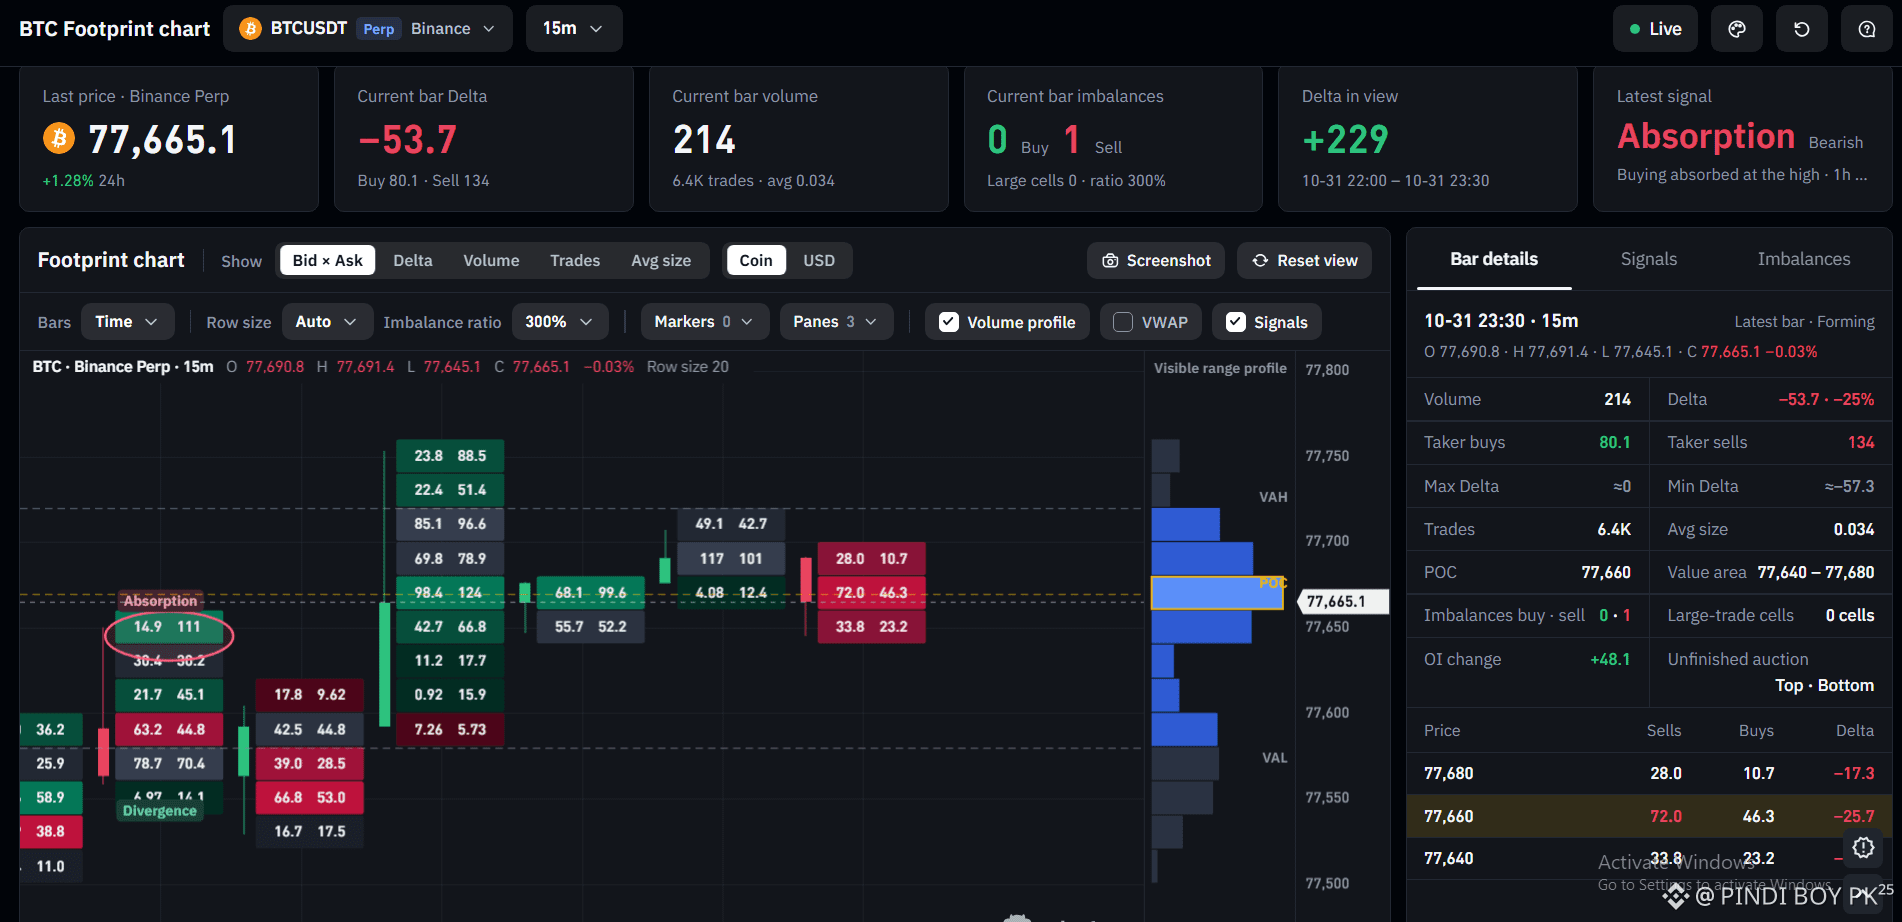
Bitcoin is trading around $77,665 in this snapshot. The current bar shows a negative delta of -53.7, with taker sells at 134 versus taker buys at 80.1. This indicates stronger aggressive selling during the candle, but it doesn't automatically confirm a bearish reversal.
🔍 Here’s What I’m Watching:
🟢 Footprint Numbers: These show buying and selling activity at individual price levels, helping traders identify where aggressive orders are entering.
🔴 Delta: The difference between buying and selling volume. Negative delta suggests sellers are more aggressive, while positive delta indicates stronger buying pressure.
📍 POC at $77,660: This is the price level with the highest traded volume in the displayed bar. The value area is marked between $77,640 and $77,680.
⚠️ Absorption Signal: The chart flags bearish absorption, suggesting buying pressure may be getting absorbed by sellers near a higher price area. Confirmation from subsequent candles is still essential.
My takeaway: I’d watch whether BTC holds the $77,640–$77,660 area or breaks below it. Order flow provides clues, not guarantees. Always manage risk and wait for price confirmation.
#bitcoin #BTC #FootprintChart #cryptotrading #TechnicalAnalysis
$BTC
$LSK
$COW
{spot}(COWUSDT)
📊 BTC FOOTPRINT ANALYSIS: WHAT ARE BUYERS AND SELLERS TELLING US?
Let’s break down this BTCUSDT 15-minute footprint chart and understand what’s happening behind the candles.
Bitcoin is trading around $77,665 in this snapshot. The current bar shows a negative delta of -53.7, with taker sells at 134 versus taker buys at 80.1. This indicates stronger aggressive selling during the candle, but it doesn't automatically confirm a bearish reversal.
🔍 Here’s What I’m Watching:
🟢 Footprint Numbers: These show buying and selling activity at individual price levels, helping traders identify where aggressive orders are entering.
🔴 Delta: The difference between buying and selling volume. Negative delta suggests sellers are more aggressive, while positive delta indicates stronger buying pressure.
📍 POC at $77,660: This is the price level with the highest traded volume in the displayed bar. The value area is marked between $77,640 and $77,680.
⚠️ Absorption Signal: The chart flags bearish absorption, suggesting buying pressure may be getting absorbed by sellers near a higher price area. Confirmation from subsequent candles is still essential.
My takeaway: I’d watch whether BTC holds the $77,640–$77,660 area or breaks below it. Order flow provides clues, not guarantees. Always manage risk and wait for price confirmation.
#bitcoin #BTC #FootprintChart #cryptotrading #TechnicalAnalysis
$BTC
$LSK
$COW
Let’s break down this BTCUSDT 15-minute footprint chart and understand what’s happening behind the candles.
Bitcoin is trading around $77,665 in this snapshot. The current bar shows a negative delta of -53.7, with taker sells at 134 versus taker buys at 80.1. This indicates stronger aggressive selling during the candle, but it doesn't automatically confirm a bearish reversal.
🔍 Here’s What I’m Watching:
🟢 Footprint Numbers: These show buying and selling activity at individual price levels, helping traders identify where aggressive orders are entering.
🔴 Delta: The difference between buying and selling volume. Negative delta suggests sellers are more aggressive, while positive delta indicates stronger buying pressure.
📍 POC at $77,660: This is the price level with the highest traded volume in the displayed bar. The value area is marked between $77,640 and $77,680.
⚠️ Absorption Signal: The chart flags bearish absorption, suggesting buying pressure may be getting absorbed by sellers near a higher price area. Confirmation from subsequent candles is still essential.
My takeaway: I’d watch whether BTC holds the $77,640–$77,660 area or breaks below it. Order flow provides clues, not guarantees. Always manage risk and wait for price confirmation.
#bitcoin #BTC #FootprintChart #cryptotrading #TechnicalAnalysis
$BTC
$LSK
$COW
1
242
තවත් අන්තර්ගතයන් ගවේෂණය කිරීමට ඇතුල් වන්න
Binance චතුරශ්රය හි ගෝලීය ක්රිප්ටෝ පරිශීලකයින් හා එක්වන්න
⚡️ ක්රිප්ටෝ පිළිබඳ නවතම සහ ප්රයෝජනවත් තොරතුරු ලබා ගන්න.
💬 ලොව විශාලතම ක්රිප්ටෝ හුවමාරුව මගින් විශ්වාස කෙරේ.
👍 සත්යායනය කරන ලද නිර්මාණකරුවන්ගෙන් සැබෑ විදසුන් සොයා ගන්න.
විද්යුත් තැපෑල / දුරකථන අංකය
නැගී එන මාතෘකා
1
#BinanceWithdrawalScamWarning
150 නැරඹීම්
53 සාකච්ඡා කරමින්
2
#USMidtermElections
542,540 නැරඹීම්
2,605 සාකච්ඡා කරමින්
3
#USOctoberNFP-AreRateCutsStillPossible
5,704 නැරඹීම්
194 සාකච්ඡා කරමින්
4
#AppleEarningsAhead-CanStockHitNewHigh
1,725 නැරඹීම්
112 සාකච්ඡා කරමින්
5
#Verify1to1BinanceReserves
8,096 නැරඹීම්
176 සාකච්ඡා කරමින්
6
#BinanceRestores28FiatWithdrawals
61,688 නැරඹීම්
808 සාකච්ඡා කරමින්
7
#StrategyRepurchases$208MSTRCAdds811Bitcoin
17 නැරඹීම්
5 සාකච්ඡා කරමින්
8
#FATFLaunchesReviewOfCryptoHubsMoneyLaunderingControls
50 නැරඹීම්
2 සාකච්ඡා කරමින්
9
#BinanceProcesses$4.65BWithdrawals
83,486 නැරඹීම්
339 සාකච්ඡා කරමින්
10
#HKMALaunchesSAGEAgenticFinanceProject
1,744 නැරඹීම්
115 සාකච්ඡා කරමින්