

#diadata
diadata
399 නැරඹීම්
6 සාකච්ඡා කරමින්
උණුසුම්
නවතම

·
--
උසබ තත්ත්වය
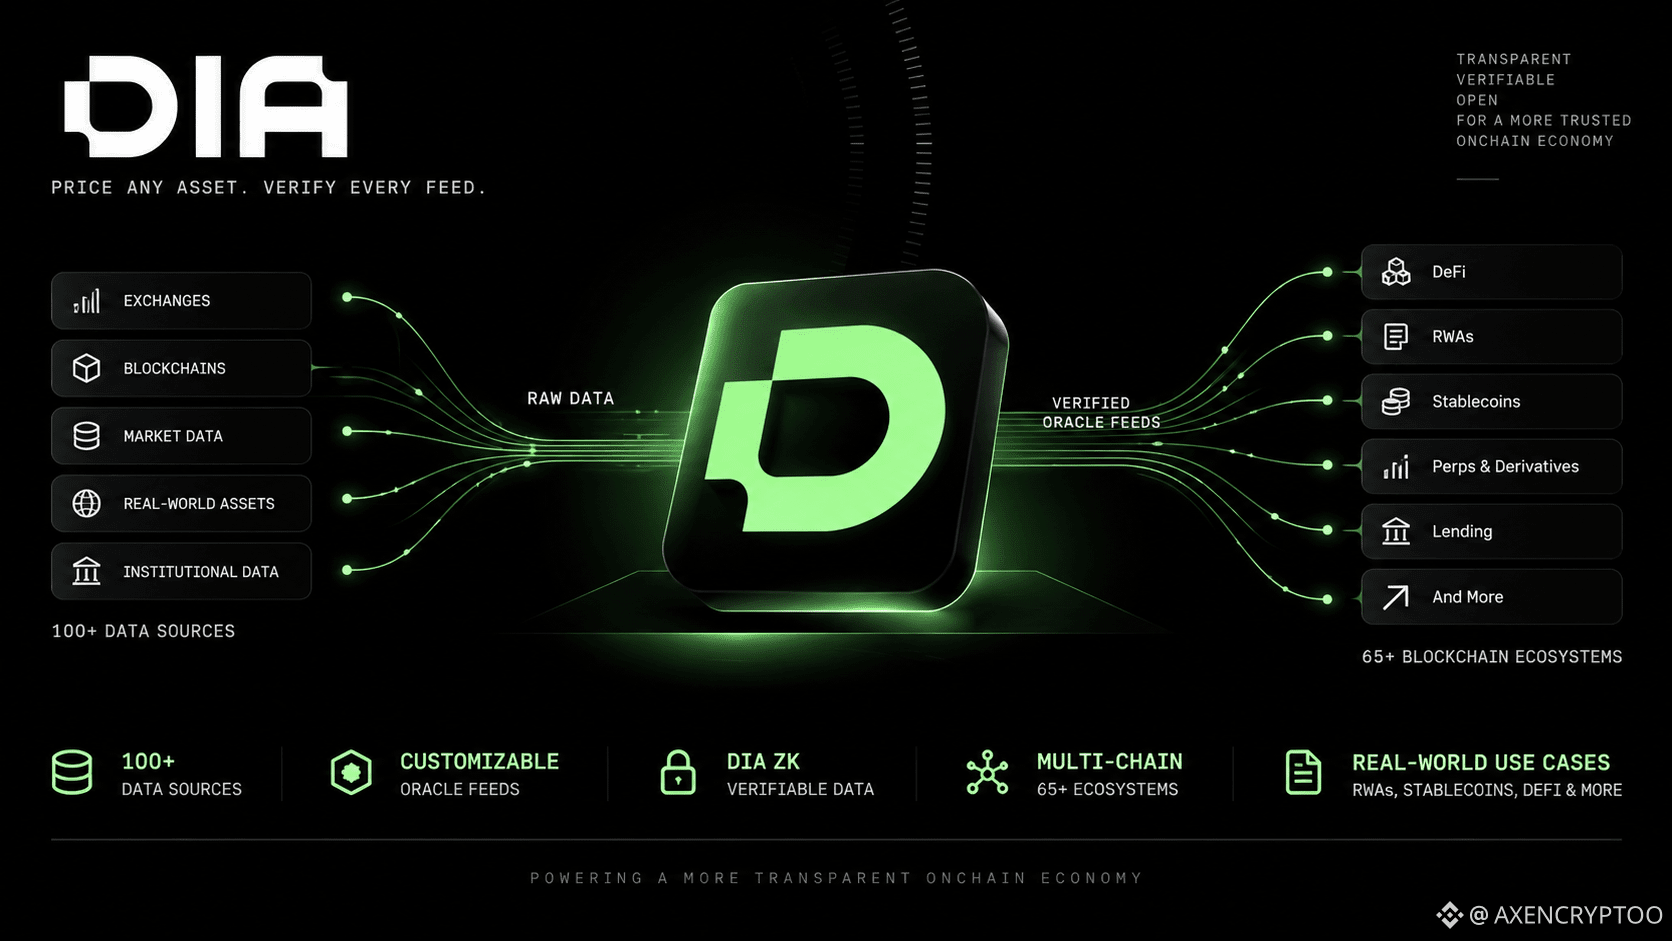
DIA Ecosystem Explained in 60 Seconds
What is @DIAdata actually building?
Here’s the 60-second version:
01 - DATA
100+ data sources.
Market data from centralized and decentralized venues.
02 - ORACLES
Raw data transformed into customizable, onchain-ready feeds.
Built for DeFi, RWAs, stablecoins, perps and lending.
03 - VERIFICATION
DIA ZK adds cryptographic verification to the data layer.
Less “trust me.”
More “prove it.”
04 - MULTI-CHAIN
65+ blockchain ecosystems.
One data infrastructure layer, built for multiple onchain environments.
05 - THE BIGGER PLAY
DIA isn’t just answering:
“What’s the price?”
It’s building infrastructure to make data:
Collected → Verified → Customized → Delivered onchain.
That’s DIA in 60 seconds.
as RWAs and institutional DeFi expand, reliable data becomes critical infrastructure.
#DIA #DIAdata
1
1
141

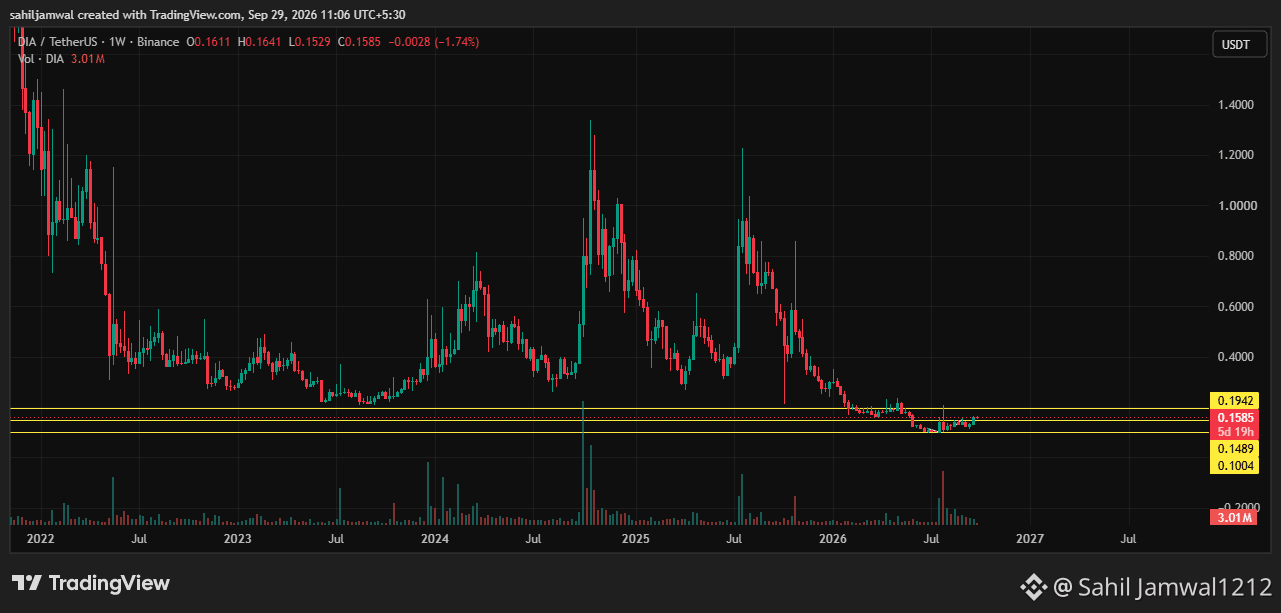
DIA/USDT Weekly: Base Holding Above Support, Resistance at $0.1942 in Focus
$DIA
{spot}(DIAUSDT)
is trading at $0.1585 on the weekly chart, about 58% above its 2026 low near $0.1004.
Price has held above the $0.1489 support and is now trading toward the $0.1942 resistance. After a long decline from the $1.20 area in mid 2025, weekly candles have become smaller, which suggests selling pressure has slowed.
Key levels:
Support: $0.1489
Resistance: $0.1942
Range low: $0.1004
A weekly close above $0.1942 would break the current range. A weekly close below $0.1489 would weaken this structure and put the lower zone back in play.
The project continues to ship products while price stays well below its earlier highs. That gap is worth tracking.
This is not financial advice. Crypto is volatile and you can lose money. Do your own research.
#Dia #DIAdata #CryptoAnalysis #Oracle #TechnicalAnalysis
DIA/USDT Weekly: Base Holding Above Support, Resistance at $0.1942 in Focus
$DIA
is trading at $0.1585 on the weekly chart, about 58% above its 2026 low near $0.1004.
Price has held above the $0.1489 support and is now trading toward the $0.1942 resistance. After a long decline from the $1.20 area in mid 2025, weekly candles have become smaller, which suggests selling pressure has slowed.
Key levels:
Support: $0.1489
Resistance: $0.1942
Range low: $0.1004
A weekly close above $0.1942 would break the current range. A weekly close below $0.1489 would weaken this structure and put the lower zone back in play.
The project continues to ship products while price stays well below its earlier highs. That gap is worth tracking.
This is not financial advice. Crypto is volatile and you can lose money. Do your own research.
#Dia #DIAdata #CryptoAnalysis #Oracle #TechnicalAnalysis
130

·
--
උසබ තත්ත්වය
$DIA وصلت لحاجة نادر أشوفها بالوضوح ده، وحسيت لازم أكتبها فورًا.
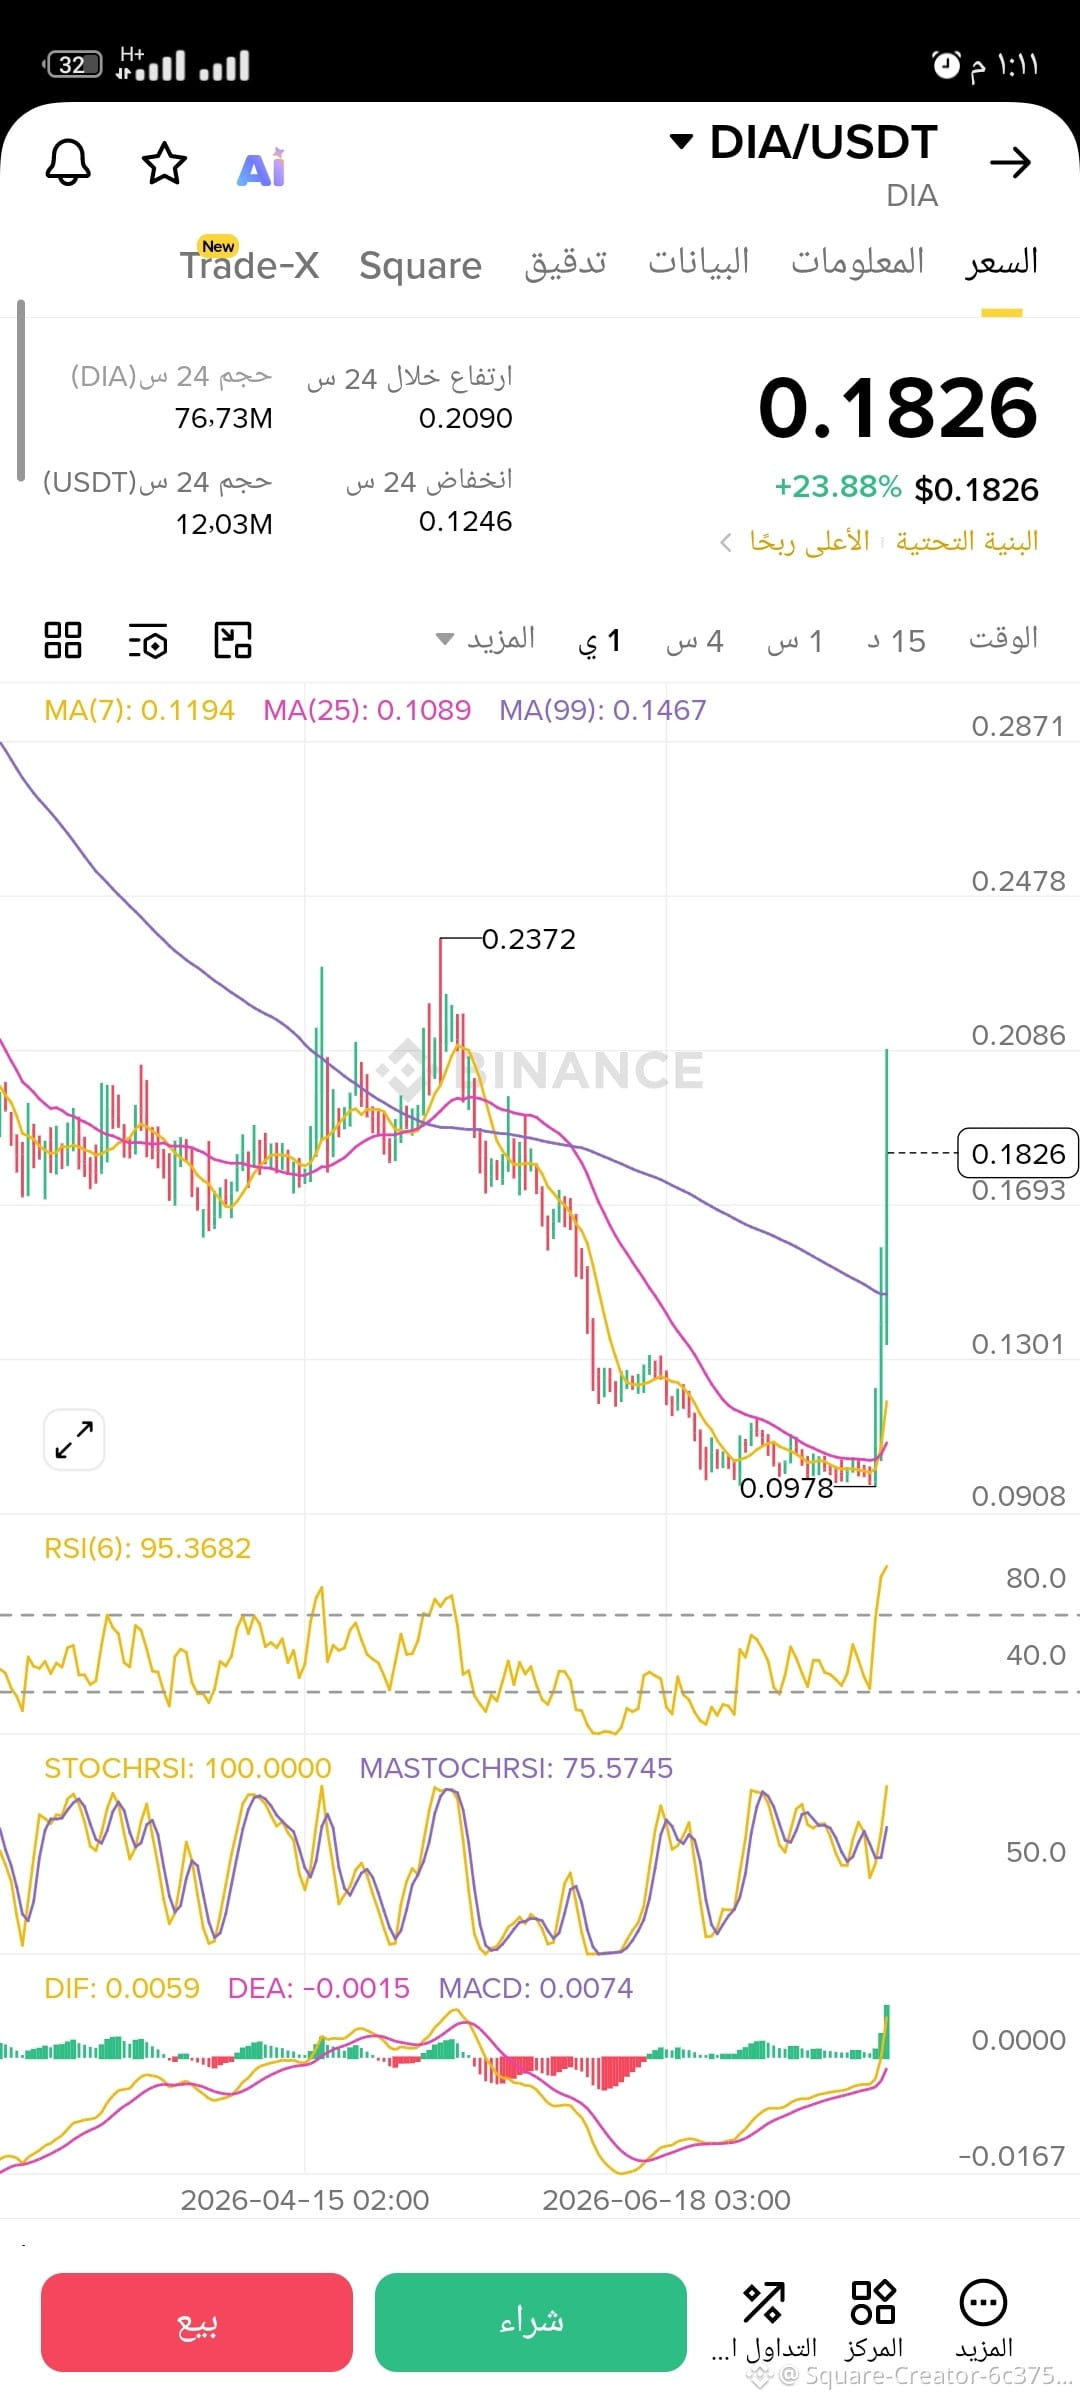
RSI(6) وصل لـ95.37 وStochRSI وصل للحد الأقصى تمامًا: 100.0. الرقمين دول مع بعض معناهم إن العملة في أقصى درجة تشبع شرائي ممكنة فنيًا، مفيش مساحة فوق كده على المؤشر نفسه.
السعر دلوقتي عند 0.1826 دولار بارتفاع 23.88%، بعد ما كانت لمست قاع عند 0.0978 دولار في وقت قريب، وقبل كده كانت في قمة محلية عند 0.2372 دولار. يعني الحركة الحالية جزء من ارتداد قوي من قاع، مش قمة جديدة تمامًا.
المهم، الزخم مؤكد فنيًا من زاوية تانية: MACD موجب والخط السريع فوق البطيء، يعني فيه قوة شرائية حقيقية وراء الحركة، مش مجرد قفزة عشوائية على فوليوم ضعيف. الفوليوم نفسه كبير: 76.73 مليون توكن اتداولوا بقيمة تجاوزت 12 مليون دولار.
اللي بيحصل هنا كلاسيكي: زخم فني قوي ومؤكد، بس في أقصى درجة تشبع ممكنة على الإطلاق. التاريخ بيقول إن اللحظات دي غالبًا بتسبق تصحيح قريب، لكن مش شرط يحصل فورًا، ممكن الزخم يفضل مستمر لفترة قبل أي رجوع.
مين شاف RSI يوصل 95 وStochRSI للحد الأقصى قبل كده على عملة تانية؟ إيه اللي حصل بعدها في تجربتكم بالضبط؟
هذا التحليل لأغراض تعليمية فقط وليس نصيحة استثمارية (DYOR)، اعملوا بحثكم الشخصي قبل أي قرار.
#DIA #DIAdata #Write2Earn #CryptoNews #BinanceSquare $DIA
{future}(DIAUSDT)
$DIA وصلت لحاجة نادر أشوفها بالوضوح ده، وحسيت لازم أكتبها فورًا.
RSI(6) وصل لـ95.37 وStochRSI وصل للحد الأقصى تمامًا: 100.0. الرقمين دول مع بعض معناهم إن العملة في أقصى درجة تشبع شرائي ممكنة فنيًا، مفيش مساحة فوق كده على المؤشر نفسه.
السعر دلوقتي عند 0.1826 دولار بارتفاع 23.88%، بعد ما كانت لمست قاع عند 0.0978 دولار في وقت قريب، وقبل كده كانت في قمة محلية عند 0.2372 دولار. يعني الحركة الحالية جزء من ارتداد قوي من قاع، مش قمة جديدة تمامًا.
المهم، الزخم مؤكد فنيًا من زاوية تانية: MACD موجب والخط السريع فوق البطيء، يعني فيه قوة شرائية حقيقية وراء الحركة، مش مجرد قفزة عشوائية على فوليوم ضعيف. الفوليوم نفسه كبير: 76.73 مليون توكن اتداولوا بقيمة تجاوزت 12 مليون دولار.
اللي بيحصل هنا كلاسيكي: زخم فني قوي ومؤكد، بس في أقصى درجة تشبع ممكنة على الإطلاق. التاريخ بيقول إن اللحظات دي غالبًا بتسبق تصحيح قريب، لكن مش شرط يحصل فورًا، ممكن الزخم يفضل مستمر لفترة قبل أي رجوع.
مين شاف RSI يوصل 95 وStochRSI للحد الأقصى قبل كده على عملة تانية؟ إيه اللي حصل بعدها في تجربتكم بالضبط؟
هذا التحليل لأغراض تعليمية فقط وليس نصيحة استثمارية (DYOR)، اعملوا بحثكم الشخصي قبل أي قرار.
#DIA #DIAdata #Write2Earn #CryptoNews #BinanceSquare $DIA
191

·
--
උසබ තත්ත්වය
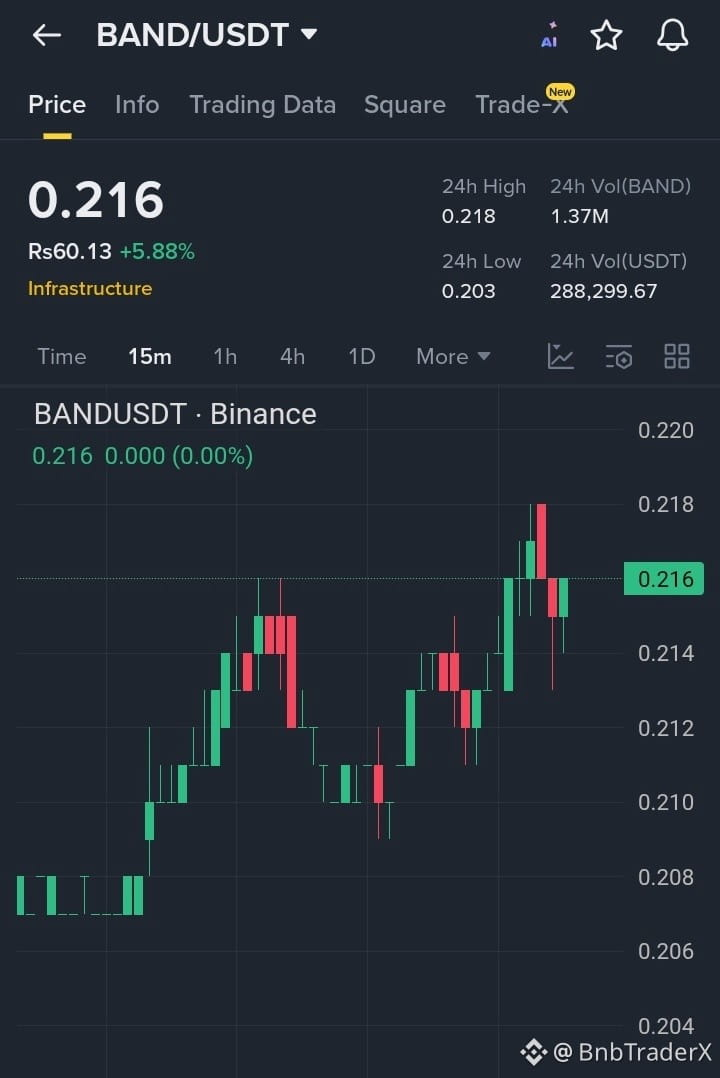
🚀 **$BAND Tech Analysis & Next Move** 🚀
$BAND has put on an impressive display of bullish momentum on the 15-minute chart, surging over 5% to break through early resistance levels. The chart shows a classic higher-high and higher-low structure, proving that buyers are actively defending the dips. After hitting a 24-hour high near 0.218, the price experienced a healthy, minor cooling-off period and is now stabilizing right around the 0.216 support zone. If the current support holds and volume remains steady, this consolidation looks like a textbook consolidation pattern before the next leg up. Traders should watch for a decisive push past the recent local peak to spark a fresh wave of buying momentum.
### Target 1: 0.219
### Target 2: 0.224
### Target 3: 0.230
#BAND #LINK #TRB #API3 #DIADATA
{spot}(BANDUSDT)
🚀 **$BAND Tech Analysis & Next Move** 🚀
$BAND has put on an impressive display of bullish momentum on the 15-minute chart, surging over 5% to break through early resistance levels. The chart shows a classic higher-high and higher-low structure, proving that buyers are actively defending the dips. After hitting a 24-hour high near 0.218, the price experienced a healthy, minor cooling-off period and is now stabilizing right around the 0.216 support zone. If the current support holds and volume remains steady, this consolidation looks like a textbook consolidation pattern before the next leg up. Traders should watch for a decisive push past the recent local peak to spark a fresh wave of buying momentum.
### Target 1: 0.219
### Target 2: 0.224
### Target 3: 0.230
#BAND #LINK #TRB #API3 #DIADATA
1
270
තවත් අන්තර්ගතයන් ගවේෂණය කිරීමට ඇතුල් වන්න
Binance චතුරශ්රය හි ගෝලීය ක්රිප්ටෝ පරිශීලකයින් හා එක්වන්න
⚡️ ක්රිප්ටෝ පිළිබඳ නවතම සහ ප්රයෝජනවත් තොරතුරු ලබා ගන්න.
💬 ලොව විශාලතම ක්රිප්ටෝ හුවමාරුව මගින් විශ්වාස කෙරේ.
👍 සත්යායනය කරන ලද නිර්මාණකරුවන්ගෙන් සැබෑ විදසුන් සොයා ගන්න.
විද්යුත් තැපෑල / දුරකථන අංකය
නැගී එන මාතෘකා
1
#WithdrawalsBack: 15 networks live
1,473 නැරඹීම්
50 සාකච්ඡා කරමින්
2
#BinanceUpdatesProofofReservesAddresses
47,705 නැරඹීම්
920 සාකච්ඡා කරමින්
3
#BinanceToResumePhaseOneOfWithdrawals
81,384 නැරඹීම්
1,142 සාකච්ඡා කරමින්
4
#BinanceHadAlreadyCovered$6BofHackLoss
6,458 නැරඹීම්
110 සාකච්ඡා කරමින්
5
#FBIConfirmsNorthKoreaIsResponsibleForBinanceCryptoHack
34,273 නැරඹීම්
121 සාකච්ඡා කරමින්
6
#CZDismissesClaimsBinanceHackWasPredicted
36,360 නැරඹීම්
486 සාකච්ඡා කරමින්
7
#B14gReportsUnauthorizedTransferOfAbout97MCORE
10,184 නැරඹීම්
213 සාකච්ඡා කරමින්
8
#USSpotETHETFsPost23StraightDaysOfNetOutflows
10,183 නැරඹීම්
182 සාකච්ඡා කරමින්
9
#IntelHasItsWorstDaySince1974
94,395 නැරඹීම්
792 සාකච්ඡා කරමින්
10
#TRMCambodianCasinosReceived$1.07BInCrypto
40,956 නැරඹීම්
74 සාකච්ඡා කරමින්