
#cryptotreding
cryptotreding
2,902 නැරඹීම්
52 සාකච්ඡා කරමින්
උණුසුම්
නවතම

Scalping and day trading in this current market setup require absolute discipline. Volume is key right now, and watching liquidity sweeps on the lower timeframes is giving the cleanest entries.
Remember, trading isn't about being in every move; it's about waiting for your specific setup to hit the strike zone. Protect your capital first, profits will follow.
What pairs are you guys actively charting today? 👇 #CryptoTrading #DayTrader #TechnicalAnalysis #BinanceSquare
#Binance #cryptotreding
Scalping and day trading in this current market setup require absolute discipline. Volume is key right now, and watching liquidity sweeps on the lower timeframes is giving the cleanest entries.
Remember, trading isn't about being in every move; it's about waiting for your specific setup to hit the strike zone. Protect your capital first, profits will follow.
What pairs are you guys actively charting today? 👇 #CryptoTrading #DayTrader #TechnicalAnalysis #BinanceSquare
#Binance #cryptotreding
Remember, trading isn't about being in every move; it's about waiting for your specific setup to hit the strike zone. Protect your capital first, profits will follow.
What pairs are you guys actively charting today? 👇 #CryptoTrading #DayTrader #TechnicalAnalysis #BinanceSquare
#Binance #cryptotreding
149

·
--

ලිපිය
How to Find the Next Binance Top Gainer Before the Big Move🚀Have you ever opened $BNB and noticed that a coin has suddenly jumped 30%, 50%, or even 100%?
By the time you notice it, the big move has already happened.
That naturally raises the question: Can you spot a coin before it becomes one of Binance’s top gainers?
There is no magic indicator that can predict the next crypto pump with 100% certainty. However, there are several signs that can help you identify coins that are starting to build momentum before a larger move takes place
Rising volume, higher highs and higher lows, breakout and retest patterns, whale activity, and overall market momentum can all provide useful clues.
The goal isn't to predict the market perfectly. It's to find promising setups early, wait for confirmation, and manage your risk if the trade doesn't go as planned.
Let's break it down.
1. Watch for a Sudden Increase in Volume 📊
One of the first things to check when looking for a potential mover is trading volume.
Price tells you where the market is moving, while volume gives you an idea of how much trading activity is behind that move.
Imagine a coin has been trading sideways for several days. The price isn't doing much, and there isn't much interest in the coin.
Then, suddenly, trading volume starts to increase.
If the price starts moving higher at the same time, it's worth taking a closer look.
You might see:
The coin trading within a relatively tight range.Volume starting to increaseMore buyers entering the marketPrice moving toward an important resistance level
When several of these thngs happen together, it can be a sign that interest in the coin is growing.
But don't treat a volume spike as a guaranteed buy signal. Volume can increase during both buying and selling.
Always look at volume together with price action and market structure.
2. Look for Higher Highs and Higher Lows 📈
Another simple way to understand a coin's momentum is to look at its price structure.
A healthy bullish trend often looks like this:
Higher Low → Higher High → Higher Low → Higher High
In simple terms, buyers push the price to a new high, the price pulls back, and buyers step in again before the previous low is broken.
When this pattern continues, it can suggest that buyers are still in control.
Resistance levels are also important.
If a coin repeatedly tests the same resistance level without experiencing a major sell-off, traders may start watching that level more closely.
However, repeated tests don't guarantee that a breakout is coming.
Crypto markets can change direction quickly, especially when the broader market becomes volatile.
3. Look for a Breakout + Retest 🎯
The breakout and retest is one of the most popular setups traders watch for a possible continuation.
Let's say a coin has been struggling to break resistance around $1.00.
After several attempts, it finally moves above $1.00 with strong volume.
Many traders may jump in at this point because they don't want to miss the move.
But there is another approach: wait for the retest.
If the price pulls back toward $1.00 and holds above that level, it can provide additional confirmation that the breakout is holding.
The basic setup looks like this:
Resistance → Breakout → Retest → Possible Continuation
For example, imagine a coin breaks resistance at $1.00, moves to $1.15, and then pulls back toward $1.00.
If buyers step in and the price holds around that area, the retest may suggest that the old resistance is turning into new support.
But there is no guarantee.
If the price falls sharply back below the breakout level, the move could turn into a fakeout.
That's why patience can sometimes be more valuable than chasing the first big green candle.
4. How to Observe Whale Activity 🐋
Whales — large holders or traders — can sometimes have a noticeable impact on liquidity and market sentiment.
That's why some traders monitor large transactions and unusual wallet activity when looking for coins that could attract more attention.
Things worth watching include:
Large wallet transfersUnusual buying or selling activityExchange deposits and withdrawalsSudden changes in trading volumeLarge orders appearing in the order book
Blockchain explorers and on-chain analytics platforms can help you investigate these movements.
But here's something important to remember:
A large transaction doesn't automatically mean a whale is buying.
A large wallet could be moving funds between its own wallets, depositing tokens to an exchange, withdrawing them, or transferring assets for another reason.
So don't use whale activity as a standalone trading signal.
Instead, treat it as another piece of information alongside price action, volume, liquidity, and market structure.
5. How to Filter Trending Coins on Binance 🔎
You don't need to analyze hundreds of coins every day to find potential opportunities.
A simple filtering process can help you narrow down the list and focus on coins that are showing real momentum.
Start With Price Change
Look for coins that are beginning to show momentum.
But be careful about chasing coins that have already made a massive move.
If a coin is already up 50% or 100%, that doesn't mean another 50% move is coming. You may simply be arriving after the biggest part of the move has already happened.
Check Trading Volume
Next, compare the current volume with the coin's recent activity.
A noticeable increase in volume can indicate that more traders are starting to pay attention.
A breakout supported by strong volume is generally more convincing than one that happens with very little trading activity.
Check Liquidity
Liquidity becomes especially important when you're looking at smaller-cap coins.
Low-liquidity markets can experience sharp price swings, wider spreads, and more slippage.
Before entering a trade, make sure there is enough market activity to enter and exit without excessive slippage.
Check the Chart Structure
Don't rely only on the percentage gain shown on $BNB
Open the chart and ask yourself:
Is the coin making higher highs?Are pullbacks forming higher lows?Is the price approaching an important resistance level?Has resistance already been broken?Is there a possible retest?Is volume supporting the move?Is the broader crypto market moving in the same direction?
This simple checklist can help you avoid chasing random pumps and focus on coins with a more structured setup.
6. Risk Management — Not Every Breakout Works ⚠️
This is arguably the most important part of the strategy.
Not every breakout turns into a big move.
Sometimes everything looks perfect.
Resistance breaks.
Volume increases.
Buyers enter.
And then, suddenly, the price drops back below the breakout level.
That's a fakeout
One of the biggest mistakes traders make is taking a large position simply because they're afraid of missing the opportunity.
Before entering a trade, ask yourself:
Where will I exit if the setup fails?How much am I actually willing to lose?Is my position size reasonable?Am I following a plan or reacting to FOMO?Has the coin already moved too far?What happens if the broader market suddenly turns bearish?
A good trader doesn't need every trade to be a winner.
The goal is to keep losses manageable and give strong setups enough room to work.
Think about it this way:
Finding a potential 50% move doesn't matter if one bad trade wipes out several previous gains.
Protecting your capital should always come first.
A Simple Checklist Before You Enter 🚦
Before jumping into a potential breakout, take a moment and run through this checklist:
1. Volume: Is trading activity increasing?
2. Price Structure: Is the coin making higher highs and higher lows?
3. Resistance: Is the price testing or breaking an important level?
4. Retest: Has the breakout level been successfully retested?
5. Liquidity: Can you enter and exit without excessive slippage?
6. Market Conditions: Is the broader crypto market supporting the move?
7. Risk: Do you know exactly where you'll exit if you're wrong?
If several of these signals line up, you may have a setup worth watching.
If the setup isn't there, there's no reason to force a trade.
Sometimes no trade is the best trade.
Final Thoughts 🚀
Finding the next $BNB top gainer before the big move isn't about discovering a secret indicator or predicting exactly what the market will do.
It's about recognizing the early signs of momentum and putting several pieces of the puzzle together.
Keep an eye on:
📊 Increasing Volume
📈 Higher Highs & Higher Lows
🎯 Breakout + Retest
🐋 Whale Activity
🔎 Market Momentum
⚠️ Risk Management
Most importantly, don't chase the pump. Look for the setup before the pump.
Even a setup that looks perfect can fail. Crypto is a highly volatile market, so always do your own research, have a clear risk-management plan, and never risk money you can't afford to lose.
The goal isn't to catch every big move.
It's to recognize good opportunities, stay patient, and protect your capital along the way.
Which coin do you think could be the next big mover? 👇
#Binance #cryptotreding #Technology
How to Find the Next Binance Top Gainer Before the Big Move🚀
Have you ever opened $BNB and noticed that a coin has suddenly jumped 30%, 50%, or even 100%?
By the time you notice it, the big move has already happened.
That naturally raises the question: Can you spot a coin before it becomes one of Binance’s top gainers?
There is no magic indicator that can predict the next crypto pump with 100% certainty. However, there are several signs that can help you identify coins that are starting to build momentum before a larger move takes place
Rising volume, higher highs and higher lows, breakout and retest patterns, whale activity, and overall market momentum can all provide useful clues.
The goal isn't to predict the market perfectly. It's to find promising setups early, wait for confirmation, and manage your risk if the trade doesn't go as planned.
Let's break it down.
1. Watch for a Sudden Increase in Volume 📊
One of the first things to check when looking for a potential mover is trading volume.
Price tells you where the market is moving, while volume gives you an idea of how much trading activity is behind that move.
Imagine a coin has been trading sideways for several days. The price isn't doing much, and there isn't much interest in the coin.
Then, suddenly, trading volume starts to increase.
If the price starts moving higher at the same time, it's worth taking a closer look.
You might see:
The coin trading within a relatively tight range.Volume starting to increaseMore buyers entering the marketPrice moving toward an important resistance level
When several of these thngs happen together, it can be a sign that interest in the coin is growing.
But don't treat a volume spike as a guaranteed buy signal. Volume can increase during both buying and selling.
Always look at volume together with price action and market structure.
2. Look for Higher Highs and Higher Lows 📈
Another simple way to understand a coin's momentum is to look at its price structure.
A healthy bullish trend often looks like this:
Higher Low → Higher High → Higher Low → Higher High
In simple terms, buyers push the price to a new high, the price pulls back, and buyers step in again before the previous low is broken.
When this pattern continues, it can suggest that buyers are still in control.
Resistance levels are also important.
If a coin repeatedly tests the same resistance level without experiencing a major sell-off, traders may start watching that level more closely.
However, repeated tests don't guarantee that a breakout is coming.
Crypto markets can change direction quickly, especially when the broader market becomes volatile.
3. Look for a Breakout + Retest 🎯
The breakout and retest is one of the most popular setups traders watch for a possible continuation.
Let's say a coin has been struggling to break resistance around $1.00.
After several attempts, it finally moves above $1.00 with strong volume.
Many traders may jump in at this point because they don't want to miss the move.
But there is another approach: wait for the retest.
If the price pulls back toward $1.00 and holds above that level, it can provide additional confirmation that the breakout is holding.
The basic setup looks like this:
Resistance → Breakout → Retest → Possible Continuation
For example, imagine a coin breaks resistance at $1.00, moves to $1.15, and then pulls back toward $1.00.
If buyers step in and the price holds around that area, the retest may suggest that the old resistance is turning into new support.
But there is no guarantee.
If the price falls sharply back below the breakout level, the move could turn into a fakeout.
That's why patience can sometimes be more valuable than chasing the first big green candle.
4. How to Observe Whale Activity 🐋
Whales — large holders or traders — can sometimes have a noticeable impact on liquidity and market sentiment.
That's why some traders monitor large transactions and unusual wallet activity when looking for coins that could attract more attention.
Things worth watching include:
Large wallet transfersUnusual buying or selling activityExchange deposits and withdrawalsSudden changes in trading volumeLarge orders appearing in the order book
Blockchain explorers and on-chain analytics platforms can help you investigate these movements.
But here's something important to remember:
A large transaction doesn't automatically mean a whale is buying.
A large wallet could be moving funds between its own wallets, depositing tokens to an exchange, withdrawing them, or transferring assets for another reason.
So don't use whale activity as a standalone trading signal.
Instead, treat it as another piece of information alongside price action, volume, liquidity, and market structure.
5. How to Filter Trending Coins on Binance 🔎
You don't need to analyze hundreds of coins every day to find potential opportunities.
A simple filtering process can help you narrow down the list and focus on coins that are showing real momentum.
Start With Price Change
Look for coins that are beginning to show momentum.
But be careful about chasing coins that have already made a massive move.
If a coin is already up 50% or 100%, that doesn't mean another 50% move is coming. You may simply be arriving after the biggest part of the move has already happened.
Check Trading Volume
Next, compare the current volume with the coin's recent activity.
A noticeable increase in volume can indicate that more traders are starting to pay attention.
A breakout supported by strong volume is generally more convincing than one that happens with very little trading activity.
Check Liquidity
Liquidity becomes especially important when you're looking at smaller-cap coins.
Low-liquidity markets can experience sharp price swings, wider spreads, and more slippage.
Before entering a trade, make sure there is enough market activity to enter and exit without excessive slippage.
Check the Chart Structure
Don't rely only on the percentage gain shown on $BNB
Open the chart and ask yourself:
Is the coin making higher highs?Are pullbacks forming higher lows?Is the price approaching an important resistance level?Has resistance already been broken?Is there a possible retest?Is volume supporting the move?Is the broader crypto market moving in the same direction?
This simple checklist can help you avoid chasing random pumps and focus on coins with a more structured setup.
6. Risk Management — Not Every Breakout Works ⚠️
This is arguably the most important part of the strategy.
Not every breakout turns into a big move.
Sometimes everything looks perfect.
Resistance breaks.
Volume increases.
Buyers enter.
And then, suddenly, the price drops back below the breakout level.
That's a fakeout
One of the biggest mistakes traders make is taking a large position simply because they're afraid of missing the opportunity.
Before entering a trade, ask yourself:
Where will I exit if the setup fails?How much am I actually willing to lose?Is my position size reasonable?Am I following a plan or reacting to FOMO?Has the coin already moved too far?What happens if the broader market suddenly turns bearish?
A good trader doesn't need every trade to be a winner.
The goal is to keep losses manageable and give strong setups enough room to work.
Think about it this way:
Finding a potential 50% move doesn't matter if one bad trade wipes out several previous gains.
Protecting your capital should always come first.
A Simple Checklist Before You Enter 🚦
Before jumping into a potential breakout, take a moment and run through this checklist:
1. Volume: Is trading activity increasing?
2. Price Structure: Is the coin making higher highs and higher lows?
3. Resistance: Is the price testing or breaking an important level?
4. Retest: Has the breakout level been successfully retested?
5. Liquidity: Can you enter and exit without excessive slippage?
6. Market Conditions: Is the broader crypto market supporting the move?
7. Risk: Do you know exactly where you'll exit if you're wrong?
If several of these signals line up, you may have a setup worth watching.
If the setup isn't there, there's no reason to force a trade.
Sometimes no trade is the best trade.
Final Thoughts 🚀
Finding the next $BNB top gainer before the big move isn't about discovering a secret indicator or predicting exactly what the market will do.
It's about recognizing the early signs of momentum and putting several pieces of the puzzle together.
Keep an eye on:
📊 Increasing Volume
📈 Higher Highs & Higher Lows
🎯 Breakout + Retest
🐋 Whale Activity
🔎 Market Momentum
⚠️ Risk Management
Most importantly, don't chase the pump. Look for the setup before the pump.
Even a setup that looks perfect can fail. Crypto is a highly volatile market, so always do your own research, have a clear risk-management plan, and never risk money you can't afford to lose.
The goal isn't to catch every big move.
It's to recognize good opportunities, stay patient, and protect your capital along the way.
Which coin do you think could be the next big mover? 👇
#Binance #cryptotreding #Technology
By the time you notice it, the big move has already happened.
That naturally raises the question: Can you spot a coin before it becomes one of Binance’s top gainers?
There is no magic indicator that can predict the next crypto pump with 100% certainty. However, there are several signs that can help you identify coins that are starting to build momentum before a larger move takes place
Rising volume, higher highs and higher lows, breakout and retest patterns, whale activity, and overall market momentum can all provide useful clues.
The goal isn't to predict the market perfectly. It's to find promising setups early, wait for confirmation, and manage your risk if the trade doesn't go as planned.
Let's break it down.
1. Watch for a Sudden Increase in Volume 📊
One of the first things to check when looking for a potential mover is trading volume.
Price tells you where the market is moving, while volume gives you an idea of how much trading activity is behind that move.
Imagine a coin has been trading sideways for several days. The price isn't doing much, and there isn't much interest in the coin.
Then, suddenly, trading volume starts to increase.
If the price starts moving higher at the same time, it's worth taking a closer look.
You might see:
The coin trading within a relatively tight range.Volume starting to increaseMore buyers entering the marketPrice moving toward an important resistance level
When several of these thngs happen together, it can be a sign that interest in the coin is growing.
But don't treat a volume spike as a guaranteed buy signal. Volume can increase during both buying and selling.
Always look at volume together with price action and market structure.
2. Look for Higher Highs and Higher Lows 📈
Another simple way to understand a coin's momentum is to look at its price structure.
A healthy bullish trend often looks like this:
Higher Low → Higher High → Higher Low → Higher High
In simple terms, buyers push the price to a new high, the price pulls back, and buyers step in again before the previous low is broken.
When this pattern continues, it can suggest that buyers are still in control.
Resistance levels are also important.
If a coin repeatedly tests the same resistance level without experiencing a major sell-off, traders may start watching that level more closely.
However, repeated tests don't guarantee that a breakout is coming.
Crypto markets can change direction quickly, especially when the broader market becomes volatile.
3. Look for a Breakout + Retest 🎯
The breakout and retest is one of the most popular setups traders watch for a possible continuation.
Let's say a coin has been struggling to break resistance around $1.00.
After several attempts, it finally moves above $1.00 with strong volume.
Many traders may jump in at this point because they don't want to miss the move.
But there is another approach: wait for the retest.
If the price pulls back toward $1.00 and holds above that level, it can provide additional confirmation that the breakout is holding.
The basic setup looks like this:
Resistance → Breakout → Retest → Possible Continuation
For example, imagine a coin breaks resistance at $1.00, moves to $1.15, and then pulls back toward $1.00.
If buyers step in and the price holds around that area, the retest may suggest that the old resistance is turning into new support.
But there is no guarantee.
If the price falls sharply back below the breakout level, the move could turn into a fakeout.
That's why patience can sometimes be more valuable than chasing the first big green candle.
4. How to Observe Whale Activity 🐋
Whales — large holders or traders — can sometimes have a noticeable impact on liquidity and market sentiment.
That's why some traders monitor large transactions and unusual wallet activity when looking for coins that could attract more attention.
Things worth watching include:
Large wallet transfersUnusual buying or selling activityExchange deposits and withdrawalsSudden changes in trading volumeLarge orders appearing in the order book
Blockchain explorers and on-chain analytics platforms can help you investigate these movements.
But here's something important to remember:
A large transaction doesn't automatically mean a whale is buying.
A large wallet could be moving funds between its own wallets, depositing tokens to an exchange, withdrawing them, or transferring assets for another reason.
So don't use whale activity as a standalone trading signal.
Instead, treat it as another piece of information alongside price action, volume, liquidity, and market structure.
5. How to Filter Trending Coins on Binance 🔎
You don't need to analyze hundreds of coins every day to find potential opportunities.
A simple filtering process can help you narrow down the list and focus on coins that are showing real momentum.
Start With Price Change
Look for coins that are beginning to show momentum.
But be careful about chasing coins that have already made a massive move.
If a coin is already up 50% or 100%, that doesn't mean another 50% move is coming. You may simply be arriving after the biggest part of the move has already happened.
Check Trading Volume
Next, compare the current volume with the coin's recent activity.
A noticeable increase in volume can indicate that more traders are starting to pay attention.
A breakout supported by strong volume is generally more convincing than one that happens with very little trading activity.
Check Liquidity
Liquidity becomes especially important when you're looking at smaller-cap coins.
Low-liquidity markets can experience sharp price swings, wider spreads, and more slippage.
Before entering a trade, make sure there is enough market activity to enter and exit without excessive slippage.
Check the Chart Structure
Don't rely only on the percentage gain shown on $BNB
Open the chart and ask yourself:
Is the coin making higher highs?Are pullbacks forming higher lows?Is the price approaching an important resistance level?Has resistance already been broken?Is there a possible retest?Is volume supporting the move?Is the broader crypto market moving in the same direction?
This simple checklist can help you avoid chasing random pumps and focus on coins with a more structured setup.
6. Risk Management — Not Every Breakout Works ⚠️
This is arguably the most important part of the strategy.
Not every breakout turns into a big move.
Sometimes everything looks perfect.
Resistance breaks.
Volume increases.
Buyers enter.
And then, suddenly, the price drops back below the breakout level.
That's a fakeout
One of the biggest mistakes traders make is taking a large position simply because they're afraid of missing the opportunity.
Before entering a trade, ask yourself:
Where will I exit if the setup fails?How much am I actually willing to lose?Is my position size reasonable?Am I following a plan or reacting to FOMO?Has the coin already moved too far?What happens if the broader market suddenly turns bearish?
A good trader doesn't need every trade to be a winner.
The goal is to keep losses manageable and give strong setups enough room to work.
Think about it this way:
Finding a potential 50% move doesn't matter if one bad trade wipes out several previous gains.
Protecting your capital should always come first.
A Simple Checklist Before You Enter 🚦
Before jumping into a potential breakout, take a moment and run through this checklist:
1. Volume: Is trading activity increasing?
2. Price Structure: Is the coin making higher highs and higher lows?
3. Resistance: Is the price testing or breaking an important level?
4. Retest: Has the breakout level been successfully retested?
5. Liquidity: Can you enter and exit without excessive slippage?
6. Market Conditions: Is the broader crypto market supporting the move?
7. Risk: Do you know exactly where you'll exit if you're wrong?
If several of these signals line up, you may have a setup worth watching.
If the setup isn't there, there's no reason to force a trade.
Sometimes no trade is the best trade.
Final Thoughts 🚀
Finding the next $BNB top gainer before the big move isn't about discovering a secret indicator or predicting exactly what the market will do.
It's about recognizing the early signs of momentum and putting several pieces of the puzzle together.
Keep an eye on:
📊 Increasing Volume
📈 Higher Highs & Higher Lows
🎯 Breakout + Retest
🐋 Whale Activity
🔎 Market Momentum
⚠️ Risk Management
Most importantly, don't chase the pump. Look for the setup before the pump.
Even a setup that looks perfect can fail. Crypto is a highly volatile market, so always do your own research, have a clear risk-management plan, and never risk money you can't afford to lose.
The goal isn't to catch every big move.
It's to recognize good opportunities, stay patient, and protect your capital along the way.
Which coin do you think could be the next big mover? 👇
#Binance #cryptotreding #Technology
117
Watching the charts closely as volatility starts to compress. When price action consolidates into a tight range, it’s usually a sign that a major liquidity expansion is brewing.
Instead of guessing the direction, the smartest move is to wait for a clean structural break and trade the retest with proper invalidation levels. Discipline over anticipation, always.
What patterns are standing out on your charts right now? 📈🚀 #CryptoTrading #PriceAction #TechnicalAnalysis #BinanceSquare
#cryptotreding
Watching the charts closely as volatility starts to compress. When price action consolidates into a tight range, it’s usually a sign that a major liquidity expansion is brewing.
Instead of guessing the direction, the smartest move is to wait for a clean structural break and trade the retest with proper invalidation levels. Discipline over anticipation, always.
What patterns are standing out on your charts right now? 📈🚀 #CryptoTrading #PriceAction #TechnicalAnalysis #BinanceSquare
#cryptotreding
Instead of guessing the direction, the smartest move is to wait for a clean structural break and trade the retest with proper invalidation levels. Discipline over anticipation, always.
What patterns are standing out on your charts right now? 📈🚀 #CryptoTrading #PriceAction #TechnicalAnalysis #BinanceSquare
#cryptotreding
147
Weekend Market Update: As we approach the weekly candle close, liquidity is showing typical compressed patterns. While the major pairs are testing immediate moving averages on lower timeframes, a few key areas deserve attention:
1. Liquidity Sweeps: Watch out for early-week fakeouts near the weekend highs and lows before a sustained trend establishes.
2. Altcoin Rotation: Keep an eye on high-volume assets showing resilience against BTC pairs, as they might lead the bounce.
3. Risk Parameters: Maintain strict stop-losses since volatility usually spikes heavily directly after the new weekly open.
Patience is the ultimate edge right now. Stay sharp! #Crypto #TradingTips #MarketAnalysis #BinanceSquare
#Binance #cryptotreding #MarketUpdate
Weekend Market Update: As we approach the weekly candle close, liquidity is showing typical compressed patterns. While the major pairs are testing immediate moving averages on lower timeframes, a few key areas deserve attention:
1. Liquidity Sweeps: Watch out for early-week fakeouts near the weekend highs and lows before a sustained trend establishes.
2. Altcoin Rotation: Keep an eye on high-volume assets showing resilience against BTC pairs, as they might lead the bounce.
3. Risk Parameters: Maintain strict stop-losses since volatility usually spikes heavily directly after the new weekly open.
Patience is the ultimate edge right now. Stay sharp! #Crypto #TradingTips #MarketAnalysis #BinanceSquare
#Binance #cryptotreding #MarketUpdate
1. Liquidity Sweeps: Watch out for early-week fakeouts near the weekend highs and lows before a sustained trend establishes.
2. Altcoin Rotation: Keep an eye on high-volume assets showing resilience against BTC pairs, as they might lead the bounce.
3. Risk Parameters: Maintain strict stop-losses since volatility usually spikes heavily directly after the new weekly open.
Patience is the ultimate edge right now. Stay sharp! #Crypto #TradingTips #MarketAnalysis #BinanceSquare
#Binance #cryptotreding #MarketUpdate
83

Solana ($SOL ) is Primed for a Massive Breakout! Don't Miss the Next Move! 📈The crypto market is heating up, and Solana ($SOL ) is flashing some of the most bullish signals on the entire dashboard right now! If you are looking for momentum, this is the chart you need to be watching 24/7.Here is the breakdown of why $SOL could explode very soon:
The Technical Trigger: Massive Cup & Handle
Bullish Pattern: On the daily frame, Solana has perfectly formed a massive Cup & Handle pattern. This is historically one of the most reliable continuation patterns in crypto trading.
The Resistance Wall: The price is tightly consolidating right under the crucial psychological resistance. A clean daily candle close above this level will trigger aggressive buy orders
.
Ecosystem: Boom & Liquidity
DEX Volume Crushing It: Solana's decentralized exchange (DEX) volume is consistently outperforming other major chains. Meme coin trading and high-speed DeFi protocols are pumping millions of dollars into the ecosystem daily.
Network Stability: The network has been running incredibly smooth, boosting institutional confidence and driving massive capital inflows.
💡 My Trading Game PlanThe:
Long Entry: I am closely watching the breakout zone. Getting in on a confirmed daily close above the current resistance layer with high volume is the safest play.
Targets: If the breakout sustains, the macro target points directly toward a retest of its previous all-time highs!
Make sure your risk management is on point. Set your stop-losses and trade smart! (DYOR)
👇Are you holding SOL for the long term or trading the breakout? Drop your targets in the comments below!
#SOL #CRYPTOTREDING #SOLANA
Solana ($SOL ) is Primed for a Massive Breakout! Don't Miss the Next Move! 📈The crypto market is heating up, and Solana ($SOL ) is flashing some of the most bullish signals on the entire dashboard right now! If you are looking for momentum, this is the chart you need to be watching 24/7.Here is the breakdown of why $SOL could explode very soon:
The Technical Trigger: Massive Cup & Handle
Bullish Pattern: On the daily frame, Solana has perfectly formed a massive Cup & Handle pattern. This is historically one of the most reliable continuation patterns in crypto trading.
The Resistance Wall: The price is tightly consolidating right under the crucial psychological resistance. A clean daily candle close above this level will trigger aggressive buy orders
.
Ecosystem: Boom & Liquidity
DEX Volume Crushing It: Solana's decentralized exchange (DEX) volume is consistently outperforming other major chains. Meme coin trading and high-speed DeFi protocols are pumping millions of dollars into the ecosystem daily.
Network Stability: The network has been running incredibly smooth, boosting institutional confidence and driving massive capital inflows.
💡 My Trading Game PlanThe:
Long Entry: I am closely watching the breakout zone. Getting in on a confirmed daily close above the current resistance layer with high volume is the safest play.
Targets: If the breakout sustains, the macro target points directly toward a retest of its previous all-time highs!
Make sure your risk management is on point. Set your stop-losses and trade smart! (DYOR)
👇Are you holding SOL for the long term or trading the breakout? Drop your targets in the comments below!
#SOL #CRYPTOTREDING #SOLANA
The Technical Trigger: Massive Cup & Handle
Bullish Pattern: On the daily frame, Solana has perfectly formed a massive Cup & Handle pattern. This is historically one of the most reliable continuation patterns in crypto trading.
The Resistance Wall: The price is tightly consolidating right under the crucial psychological resistance. A clean daily candle close above this level will trigger aggressive buy orders
.
Ecosystem: Boom & Liquidity
DEX Volume Crushing It: Solana's decentralized exchange (DEX) volume is consistently outperforming other major chains. Meme coin trading and high-speed DeFi protocols are pumping millions of dollars into the ecosystem daily.
Network Stability: The network has been running incredibly smooth, boosting institutional confidence and driving massive capital inflows.
💡 My Trading Game PlanThe:
Long Entry: I am closely watching the breakout zone. Getting in on a confirmed daily close above the current resistance layer with high volume is the safest play.
Targets: If the breakout sustains, the macro target points directly toward a retest of its previous all-time highs!
Make sure your risk management is on point. Set your stop-losses and trade smart! (DYOR)
👇Are you holding SOL for the long term or trading the breakout? Drop your targets in the comments below!
#SOL #CRYPTOTREDING #SOLANA
1
628

🚨 $ONDS ALERT: LONG TRADERS CAUGHT IN THE DOWNSWING!
The pressure is building around Ondas! A notable $64.5K long liquidation at $5.618 shows that leveraged bullish positions have been forced out, putting the spotlight on whether sellers can extend their advantage.
📊 Liquidation Snapshot
- Asset: $ONDS
- Liquidated Position: Long
- Liquidation Volume: $64,500
- Liquidation Price: $5.618
- Immediate Market Bias: Cautiously bearish
🎯 Price Levels to Watch
- Pivot Zone: $5.60
- First Support: $5.50
- Deeper Support: $5.35
- Initial Resistance: $5.75
- Major Recovery Zone: $5.90–$6.00
⚡ What Could Happen Next?
🔴 Bearish Setup: If ONDS struggles to reclaim $5.70–$5.75, sellers may push the price toward $5.50, with $5.35 becoming the next downside area.
🟢 Bullish Reversal: A strong recovery above $5.75, supported by increasing volume, could trigger a relief move toward $5.90 and potentially $6.00.
📈 MY SIGNAL PROVIDER VIEW
My short-term bias remains cautious below $5.75. I would avoid aggressive dip-buying until buyers demonstrate real strength. A confirmed reclaim of resistance could provide a better long opportunity.
The key question now: Will ONDS attract fresh buyers, or will another wave of selling hit the market?
⚠️ Risk Management: These levels are technical observation zones, not verified live support or resistance. Wait for price confirmation and always protect your capital.
#ONDSUSDT #Ondas
#LiquidationAlert
#cryptotreding
#Binancesquare
{stock_us}(ONDS.US)
🚨 $ONDS ALERT: LONG TRADERS CAUGHT IN THE DOWNSWING!
The pressure is building around Ondas! A notable $64.5K long liquidation at $5.618 shows that leveraged bullish positions have been forced out, putting the spotlight on whether sellers can extend their advantage.
📊 Liquidation Snapshot
- Asset: $ONDS
- Liquidated Position: Long
- Liquidation Volume: $64,500
- Liquidation Price: $5.618
- Immediate Market Bias: Cautiously bearish
🎯 Price Levels to Watch
- Pivot Zone: $5.60
- First Support: $5.50
- Deeper Support: $5.35
- Initial Resistance: $5.75
- Major Recovery Zone: $5.90–$6.00
⚡ What Could Happen Next?
🔴 Bearish Setup: If ONDS struggles to reclaim $5.70–$5.75, sellers may push the price toward $5.50, with $5.35 becoming the next downside area.
🟢 Bullish Reversal: A strong recovery above $5.75, supported by increasing volume, could trigger a relief move toward $5.90 and potentially $6.00.
📈 MY SIGNAL PROVIDER VIEW
My short-term bias remains cautious below $5.75. I would avoid aggressive dip-buying until buyers demonstrate real strength. A confirmed reclaim of resistance could provide a better long opportunity.
The key question now: Will ONDS attract fresh buyers, or will another wave of selling hit the market?
⚠️ Risk Management: These levels are technical observation zones, not verified live support or resistance. Wait for price confirmation and always protect your capital.
#ONDSUSDT #Ondas
#LiquidationAlert
#cryptotreding
#Binancesquare
The pressure is building around Ondas! A notable $64.5K long liquidation at $5.618 shows that leveraged bullish positions have been forced out, putting the spotlight on whether sellers can extend their advantage.
📊 Liquidation Snapshot
- Asset: $ONDS
- Liquidated Position: Long
- Liquidation Volume: $64,500
- Liquidation Price: $5.618
- Immediate Market Bias: Cautiously bearish
🎯 Price Levels to Watch
- Pivot Zone: $5.60
- First Support: $5.50
- Deeper Support: $5.35
- Initial Resistance: $5.75
- Major Recovery Zone: $5.90–$6.00
⚡ What Could Happen Next?
🔴 Bearish Setup: If ONDS struggles to reclaim $5.70–$5.75, sellers may push the price toward $5.50, with $5.35 becoming the next downside area.
🟢 Bullish Reversal: A strong recovery above $5.75, supported by increasing volume, could trigger a relief move toward $5.90 and potentially $6.00.
📈 MY SIGNAL PROVIDER VIEW
My short-term bias remains cautious below $5.75. I would avoid aggressive dip-buying until buyers demonstrate real strength. A confirmed reclaim of resistance could provide a better long opportunity.
The key question now: Will ONDS attract fresh buyers, or will another wave of selling hit the market?
⚠️ Risk Management: These levels are technical observation zones, not verified live support or resistance. Wait for price confirmation and always protect your capital.
#ONDSUSDT #Ondas
#LiquidationAlert
#cryptotreding
#Binancesquare
ONDS-6.67%
ONDSUS-6.85%
15
🔴 $ETH BEARS TAKE CONTROL — LONG POSITIONS WIPED OUT! ⚠️
Ethereum just delivered another warning to leveraged bulls! A fresh $112K long liquidation at $2,039.42 highlights the selling pressure hitting ETH and puts downside liquidity firmly in focus.
📉 ETH Liquidation Breakdown
- Liquidated Side: Long
- Total Value: $112,000
- Liquidation Price: $2,039.42
- Market Bias: Short-term bearish
🎯 Critical Price Levels
- Immediate Resistance: $2,060–$2,080
- Key Support: $2,020
- Lower Support: $2,000–$1,980
- Bullish Recovery Trigger: Strong reclaim above $2,080
🔥 My Next-Move Outlook
ETH is showing signs of vulnerability after this long liquidation. If sellers maintain pressure below $2,040, another downward test toward $2,020 and potentially $2,000 could develop.
However, if buyers reclaim $2,080 with convincing volume, a short-term recovery toward $2,100–$2,120 becomes possible.
SIGNAL STRATEGY:
Bearish bias while ETH remains below $2,080. Avoid chasing breakdowns; wait for confirmation before entering. A decisive reclaim of resistance would invalidate the immediate bearish setup.
💡 Remember: Liquidations can accelerate volatility, but they do not guarantee the next direction. Protect your capital and manage leverage carefully.
⚠️ Risk Disclaimer: This is a market observation, not guaranteed financial advice. Always use stop-loss protection.
#ETHUSDT
#Ethereum #LiquidationAlert
#Cryptotreding
#Binancesquare
{spot}(ETHUSDT)
🔴 $ETH BEARS TAKE CONTROL — LONG POSITIONS WIPED OUT! ⚠️
Ethereum just delivered another warning to leveraged bulls! A fresh $112K long liquidation at $2,039.42 highlights the selling pressure hitting ETH and puts downside liquidity firmly in focus.
📉 ETH Liquidation Breakdown
- Liquidated Side: Long
- Total Value: $112,000
- Liquidation Price: $2,039.42
- Market Bias: Short-term bearish
🎯 Critical Price Levels
- Immediate Resistance: $2,060–$2,080
- Key Support: $2,020
- Lower Support: $2,000–$1,980
- Bullish Recovery Trigger: Strong reclaim above $2,080
🔥 My Next-Move Outlook
ETH is showing signs of vulnerability after this long liquidation. If sellers maintain pressure below $2,040, another downward test toward $2,020 and potentially $2,000 could develop.
However, if buyers reclaim $2,080 with convincing volume, a short-term recovery toward $2,100–$2,120 becomes possible.
SIGNAL STRATEGY:
Bearish bias while ETH remains below $2,080. Avoid chasing breakdowns; wait for confirmation before entering. A decisive reclaim of resistance would invalidate the immediate bearish setup.
💡 Remember: Liquidations can accelerate volatility, but they do not guarantee the next direction. Protect your capital and manage leverage carefully.
⚠️ Risk Disclaimer: This is a market observation, not guaranteed financial advice. Always use stop-loss protection.
#ETHUSDT
#Ethereum #LiquidationAlert
#Cryptotreding
#Binancesquare
Ethereum just delivered another warning to leveraged bulls! A fresh $112K long liquidation at $2,039.42 highlights the selling pressure hitting ETH and puts downside liquidity firmly in focus.
📉 ETH Liquidation Breakdown
- Liquidated Side: Long
- Total Value: $112,000
- Liquidation Price: $2,039.42
- Market Bias: Short-term bearish
🎯 Critical Price Levels
- Immediate Resistance: $2,060–$2,080
- Key Support: $2,020
- Lower Support: $2,000–$1,980
- Bullish Recovery Trigger: Strong reclaim above $2,080
🔥 My Next-Move Outlook
ETH is showing signs of vulnerability after this long liquidation. If sellers maintain pressure below $2,040, another downward test toward $2,020 and potentially $2,000 could develop.
However, if buyers reclaim $2,080 with convincing volume, a short-term recovery toward $2,100–$2,120 becomes possible.
SIGNAL STRATEGY:
Bearish bias while ETH remains below $2,080. Avoid chasing breakdowns; wait for confirmation before entering. A decisive reclaim of resistance would invalidate the immediate bearish setup.
💡 Remember: Liquidations can accelerate volatility, but they do not guarantee the next direction. Protect your capital and manage leverage carefully.
⚠️ Risk Disclaimer: This is a market observation, not guaranteed financial advice. Always use stop-loss protection.
#ETHUSDT
#Ethereum #LiquidationAlert
#Cryptotreding
#Binancesquare
30

·
--
උසබ තත්ත්වය
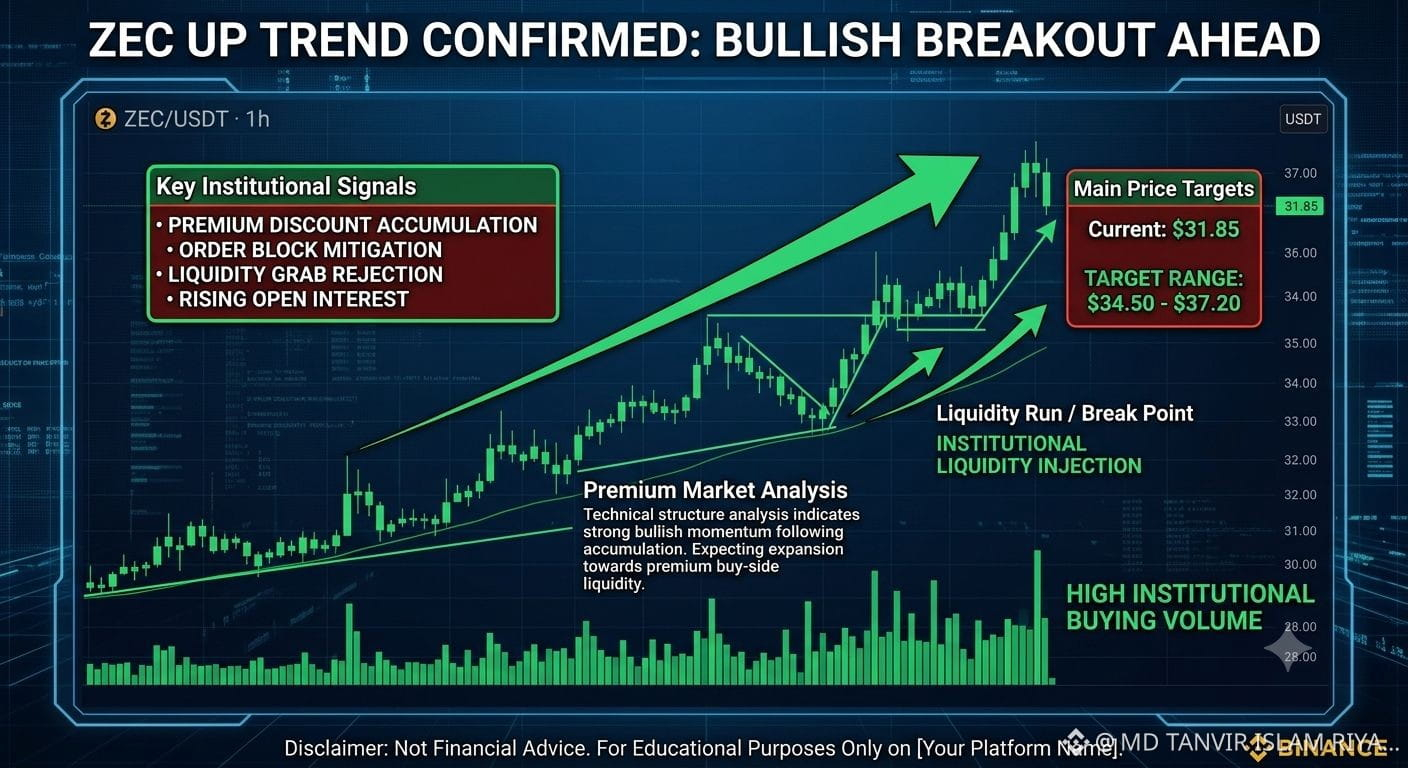
**$ZEC : Bullish Expansion Expected (Premium ICT Order Flow)**
Based on institutional order flow and ICT concepts, ZEC is currently trading in a premium discount array after tapping into a daily bullish order block. Large-scale market makers are accumulating liquidity below the recent swing lows. Expect an upward expansion over the next 3 days as the market seeks premium buy-side liquidity.
**Target Price:** $48.50
$ZEC
#Write2Earn #ZEC #Cryptotreding #Altcoins
{spot}(ZECUSDT)
**$ZEC : Bullish Expansion Expected (Premium ICT Order Flow)**
Based on institutional order flow and ICT concepts, ZEC is currently trading in a premium discount array after tapping into a daily bullish order block. Large-scale market makers are accumulating liquidity below the recent swing lows. Expect an upward expansion over the next 3 days as the market seeks premium buy-side liquidity.
**Target Price:** $48.50
$ZEC
#Write2Earn #ZEC #Cryptotreding #Altcoins
Based on institutional order flow and ICT concepts, ZEC is currently trading in a premium discount array after tapping into a daily bullish order block. Large-scale market makers are accumulating liquidity below the recent swing lows. Expect an upward expansion over the next 3 days as the market seeks premium buy-side liquidity.
**Target Price:** $48.50
$ZEC
#Write2Earn #ZEC #Cryptotreding #Altcoins
108
⚠️ $ETH SELLING PRESSURE RETURNS! ANOTHER $66.1K IN LONGS WIPED OUT!
Ethereum bulls are facing another challenge! A fresh $66,100 long liquidation at $2,040.93 indicates that leveraged buyers are getting squeezed as downside pressure keeps the market on alert.
The important question is whether ETH is preparing for another liquidity sweep or approaching a potential reversal zone.
📍 ETH MARKET WATCH
- Liquidation Side: Long
- Liquidated Amount: $66,100
- Liquidation Price: $2,040.93
- Immediate Sentiment: Bearish pressure
- Critical Pivot: $2,040
🎯 THE LEVELS THAT MATTER
- Resistance 1: $2,060
- Resistance 2: $2,080
- Support 1: $2,020
- Support 2: $2,000
- Extended Downside Zone: $1,980
🔍 NEXT MOVE — MY MARKET PROJECTION
🔴 Bearish Continuation: If ETH fails to recover above $2,060, sellers could attempt another push toward $2,020. A decisive breakdown may expose the psychological $2,000 level.
🟢 Recovery Opportunity: If buyers defend $2,020 and reclaim $2,060 with convincing volume, ETH could challenge $2,080–$2,100.
🔥 TRADING DESK VERDICT
My preference is to remain defensive while ETH trades below $2,060. I would look for a failed retest of resistance before considering a short setup. A strong reclaim would force a reassessment of the bearish bias.
Watch the $2,040 zone closely. The next reaction could reveal whether bears still have control!
⚠️ Risk Warning: These are conditional price scenarios, not confirmed live support or resistance. Always wait for confirmation, manage position size, and use stop-loss protection.
#ETHUSDt #Ethereum #Cryptotreding #LiquidationAlert #Binancesquare
{spot}(ETHUSDT)
⚠️ $ETH SELLING PRESSURE RETURNS! ANOTHER $66.1K IN LONGS WIPED OUT!
Ethereum bulls are facing another challenge! A fresh $66,100 long liquidation at $2,040.93 indicates that leveraged buyers are getting squeezed as downside pressure keeps the market on alert.
The important question is whether ETH is preparing for another liquidity sweep or approaching a potential reversal zone.
📍 ETH MARKET WATCH
- Liquidation Side: Long
- Liquidated Amount: $66,100
- Liquidation Price: $2,040.93
- Immediate Sentiment: Bearish pressure
- Critical Pivot: $2,040
🎯 THE LEVELS THAT MATTER
- Resistance 1: $2,060
- Resistance 2: $2,080
- Support 1: $2,020
- Support 2: $2,000
- Extended Downside Zone: $1,980
🔍 NEXT MOVE — MY MARKET PROJECTION
🔴 Bearish Continuation: If ETH fails to recover above $2,060, sellers could attempt another push toward $2,020. A decisive breakdown may expose the psychological $2,000 level.
🟢 Recovery Opportunity: If buyers defend $2,020 and reclaim $2,060 with convincing volume, ETH could challenge $2,080–$2,100.
🔥 TRADING DESK VERDICT
My preference is to remain defensive while ETH trades below $2,060. I would look for a failed retest of resistance before considering a short setup. A strong reclaim would force a reassessment of the bearish bias.
Watch the $2,040 zone closely. The next reaction could reveal whether bears still have control!
⚠️ Risk Warning: These are conditional price scenarios, not confirmed live support or resistance. Always wait for confirmation, manage position size, and use stop-loss protection.
#ETHUSDt #Ethereum #Cryptotreding #LiquidationAlert #Binancesquare
Ethereum bulls are facing another challenge! A fresh $66,100 long liquidation at $2,040.93 indicates that leveraged buyers are getting squeezed as downside pressure keeps the market on alert.
The important question is whether ETH is preparing for another liquidity sweep or approaching a potential reversal zone.
📍 ETH MARKET WATCH
- Liquidation Side: Long
- Liquidated Amount: $66,100
- Liquidation Price: $2,040.93
- Immediate Sentiment: Bearish pressure
- Critical Pivot: $2,040
🎯 THE LEVELS THAT MATTER
- Resistance 1: $2,060
- Resistance 2: $2,080
- Support 1: $2,020
- Support 2: $2,000
- Extended Downside Zone: $1,980
🔍 NEXT MOVE — MY MARKET PROJECTION
🔴 Bearish Continuation: If ETH fails to recover above $2,060, sellers could attempt another push toward $2,020. A decisive breakdown may expose the psychological $2,000 level.
🟢 Recovery Opportunity: If buyers defend $2,020 and reclaim $2,060 with convincing volume, ETH could challenge $2,080–$2,100.
🔥 TRADING DESK VERDICT
My preference is to remain defensive while ETH trades below $2,060. I would look for a failed retest of resistance before considering a short setup. A strong reclaim would force a reassessment of the bearish bias.
Watch the $2,040 zone closely. The next reaction could reveal whether bears still have control!
⚠️ Risk Warning: These are conditional price scenarios, not confirmed live support or resistance. Always wait for confirmation, manage position size, and use stop-loss protection.
#ETHUSDt #Ethereum #Cryptotreding #LiquidationAlert #Binancesquare
6
🔴 $SOL BEARS STRIKE AGAIN! $114K IN LONGS ERASED! ⚠️**
Solana just witnessed another painful liquidation event. Approximately **$114,000 worth of leveraged long positions** were wiped out at **$82.44**, putting short-term bullish traders under pressure.
📉 **SOL LIQUIDATION BREAKDOWN**
- Liquidated Side: Longs 🔴
- Total Value: $114,000
- Liquidation Price: $82.44
- Immediate Pressure: Bearish
- Market Focus: Buyers' ability to defend lower levels.
🎯 **SOL NEXT MOVE — TRADER'S OUTLOOK**
The $82.44 liquidation zone is now an important reference point.
🐻 **Bearish Scenario:** If SOL remains below $82.44 and selling pressure accelerates, another downside liquidity sweep could develop.
🐂 **Bullish Scenario:** A strong reclaim of $82.44, followed by sustained buying volume, could signal a recovery attempt and squeeze late short sellers.
⚡ **MY SIGNAL VIEW:**
SOL needs to prove that buyers are still in control. I would avoid aggressive long entries until a convincing recovery appears. Watch the reaction around $82.44 for the next directional clue.
💡 Remember: Liquidation pressure can create opportunities, but confirmation matters more than excitement.
⚠️ Always manage leverage and protect your capital. This is a market outlook, not a guaranteed prediction.
#SOLUSDT #Solana #Cryptotreding
#Liquidationalert #Binancesquare
{spot}(SOLUSDT)
🔴 $SOL BEARS STRIKE AGAIN! $114K IN LONGS ERASED! ⚠️**
Solana just witnessed another painful liquidation event. Approximately **$114,000 worth of leveraged long positions** were wiped out at **$82.44**, putting short-term bullish traders under pressure.
📉 **SOL LIQUIDATION BREAKDOWN**
- Liquidated Side: Longs 🔴
- Total Value: $114,000
- Liquidation Price: $82.44
- Immediate Pressure: Bearish
- Market Focus: Buyers' ability to defend lower levels.
🎯 **SOL NEXT MOVE — TRADER'S OUTLOOK**
The $82.44 liquidation zone is now an important reference point.
🐻 **Bearish Scenario:** If SOL remains below $82.44 and selling pressure accelerates, another downside liquidity sweep could develop.
🐂 **Bullish Scenario:** A strong reclaim of $82.44, followed by sustained buying volume, could signal a recovery attempt and squeeze late short sellers.
⚡ **MY SIGNAL VIEW:**
SOL needs to prove that buyers are still in control. I would avoid aggressive long entries until a convincing recovery appears. Watch the reaction around $82.44 for the next directional clue.
💡 Remember: Liquidation pressure can create opportunities, but confirmation matters more than excitement.
⚠️ Always manage leverage and protect your capital. This is a market outlook, not a guaranteed prediction.
#SOLUSDT #Solana #Cryptotreding
#Liquidationalert #Binancesquare
Solana just witnessed another painful liquidation event. Approximately **$114,000 worth of leveraged long positions** were wiped out at **$82.44**, putting short-term bullish traders under pressure.
📉 **SOL LIQUIDATION BREAKDOWN**
- Liquidated Side: Longs 🔴
- Total Value: $114,000
- Liquidation Price: $82.44
- Immediate Pressure: Bearish
- Market Focus: Buyers' ability to defend lower levels.
🎯 **SOL NEXT MOVE — TRADER'S OUTLOOK**
The $82.44 liquidation zone is now an important reference point.
🐻 **Bearish Scenario:** If SOL remains below $82.44 and selling pressure accelerates, another downside liquidity sweep could develop.
🐂 **Bullish Scenario:** A strong reclaim of $82.44, followed by sustained buying volume, could signal a recovery attempt and squeeze late short sellers.
⚡ **MY SIGNAL VIEW:**
SOL needs to prove that buyers are still in control. I would avoid aggressive long entries until a convincing recovery appears. Watch the reaction around $82.44 for the next directional clue.
💡 Remember: Liquidation pressure can create opportunities, but confirmation matters more than excitement.
⚠️ Always manage leverage and protect your capital. This is a market outlook, not a guaranteed prediction.
#SOLUSDT #Solana #Cryptotreding
#Liquidationalert #Binancesquare
65

·
--
⚡$ BZ BULLS STRIKE BACK! SHORT SELLERS TAKE A HIT! 🟢
The pressure is shifting! BZ has triggered a $50,200 short liquidation at $91.73, forcing bearish traders out of their positions.
This liquidation event puts the spotlight on buyer strength. If bullish momentum continues, additional short covering could potentially fuel a stronger upside move.
📌 Market Intelligence
- Asset: $BZ
- Event: 🟢 Short Liquidation
- Liquidated Value: $50.2K
- Trigger Price: $91.73
- Immediate Implication: Bearish positions are facing pressure.
🎯 NEXT MOVE — WHAT I'M WATCHING
My focus is on whether BZ can hold above the $91.73 liquidation zone.
- Bullish Scenario: Sustained buying pressure and rising volume could open the door to further upside.
- Bearish Scenario: A rejection near this area could trigger a retracement as the market absorbs the liquidation activity.
🔥 PRO TRADER TAKE: Short sellers have taken a hit, but the real confirmation comes from what happens next. Watch volume, momentum, and price structure before entering a position.
⚠️ Liquidations are not guaranteed reversal signals. Manage risk and DYOR.
#BZUSDT
#cryptotreding
#LiquidationAlert
#BinanceSquare
#TradFiForBeginners
{stock_us}(BZ.US)
⚡$ BZ BULLS STRIKE BACK! SHORT SELLERS TAKE A HIT! 🟢
The pressure is shifting! BZ has triggered a $50,200 short liquidation at $91.73, forcing bearish traders out of their positions.
This liquidation event puts the spotlight on buyer strength. If bullish momentum continues, additional short covering could potentially fuel a stronger upside move.
📌 Market Intelligence
- Asset: $BZ
- Event: 🟢 Short Liquidation
- Liquidated Value: $50.2K
- Trigger Price: $91.73
- Immediate Implication: Bearish positions are facing pressure.
🎯 NEXT MOVE — WHAT I'M WATCHING
My focus is on whether BZ can hold above the $91.73 liquidation zone.
- Bullish Scenario: Sustained buying pressure and rising volume could open the door to further upside.
- Bearish Scenario: A rejection near this area could trigger a retracement as the market absorbs the liquidation activity.
🔥 PRO TRADER TAKE: Short sellers have taken a hit, but the real confirmation comes from what happens next. Watch volume, momentum, and price structure before entering a position.
⚠️ Liquidations are not guaranteed reversal signals. Manage risk and DYOR.
#BZUSDT
#cryptotreding
#LiquidationAlert
#BinanceSquare
#TradFiForBeginners
The pressure is shifting! BZ has triggered a $50,200 short liquidation at $91.73, forcing bearish traders out of their positions.
This liquidation event puts the spotlight on buyer strength. If bullish momentum continues, additional short covering could potentially fuel a stronger upside move.
📌 Market Intelligence
- Asset: $BZ
- Event: 🟢 Short Liquidation
- Liquidated Value: $50.2K
- Trigger Price: $91.73
- Immediate Implication: Bearish positions are facing pressure.
🎯 NEXT MOVE — WHAT I'M WATCHING
My focus is on whether BZ can hold above the $91.73 liquidation zone.
- Bullish Scenario: Sustained buying pressure and rising volume could open the door to further upside.
- Bearish Scenario: A rejection near this area could trigger a retracement as the market absorbs the liquidation activity.
🔥 PRO TRADER TAKE: Short sellers have taken a hit, but the real confirmation comes from what happens next. Watch volume, momentum, and price structure before entering a position.
⚠️ Liquidations are not guaranteed reversal signals. Manage risk and DYOR.
#BZUSDT
#cryptotreding
#LiquidationAlert
#BinanceSquare
#TradFiForBeginners
33
·
--
🟢$ SOXL SHORT SQUEEZE ALERT! $50.5K LIQUIDATED AT $54.17 🚀
The bears just took a hit! A $50,500 short liquidation was recorded in $SOXL at $54.17, signaling that bearish positions are facing pressure as price moves against short sellers.
📊 What This Signals:
- Short sellers are being forced out of positions.
- Buying pressure could intensify if bullish momentum continues.
- Further short liquidations may fuel a potential upside extension.
🎯 My Market Outlook:
Watch the $54.17 zone closely. If SOXL holds above this level and buyers maintain control, a bullish continuation could develop. However, failure to sustain momentum may trigger a pullback or consolidation.
⚡ Key Strategy: Watch price action, volume, and confirmation before considering an entry. Don't chase the move blindly
⚠️ Not financial advice. Leverage increases risk. Always DYOR
#SOXLUSDT
#cryptotreding
#LiquidationAlert
#BinanceSquare
{etf_us}(SOXL.ETF)
🟢$ SOXL SHORT SQUEEZE ALERT! $50.5K LIQUIDATED AT $54.17 🚀
The bears just took a hit! A $50,500 short liquidation was recorded in $SOXL at $54.17, signaling that bearish positions are facing pressure as price moves against short sellers.
📊 What This Signals:
- Short sellers are being forced out of positions.
- Buying pressure could intensify if bullish momentum continues.
- Further short liquidations may fuel a potential upside extension.
🎯 My Market Outlook:
Watch the $54.17 zone closely. If SOXL holds above this level and buyers maintain control, a bullish continuation could develop. However, failure to sustain momentum may trigger a pullback or consolidation.
⚡ Key Strategy: Watch price action, volume, and confirmation before considering an entry. Don't chase the move blindly
⚠️ Not financial advice. Leverage increases risk. Always DYOR
#SOXLUSDT
#cryptotreding
#LiquidationAlert
#BinanceSquare
The bears just took a hit! A $50,500 short liquidation was recorded in $SOXL at $54.17, signaling that bearish positions are facing pressure as price moves against short sellers.
📊 What This Signals:
- Short sellers are being forced out of positions.
- Buying pressure could intensify if bullish momentum continues.
- Further short liquidations may fuel a potential upside extension.
🎯 My Market Outlook:
Watch the $54.17 zone closely. If SOXL holds above this level and buyers maintain control, a bullish continuation could develop. However, failure to sustain momentum may trigger a pullback or consolidation.
⚡ Key Strategy: Watch price action, volume, and confirmation before considering an entry. Don't chase the move blindly
⚠️ Not financial advice. Leverage increases risk. Always DYOR
#SOXLUSDT
#cryptotreding
#LiquidationAlert
#BinanceSquare
SOXL-2.56%
SOXLETF-0.52%
27
🟢 $KORU SHORT SQUEEZE ALERT — $116K LIQUIDATED! 🚀
⚡ The Bears Just Took a Serious Hit!
A $116K KORU short position was wiped out at $7.780, highlighting aggressive buying pressure and a potential shift in short-term market sentiment.
📊 Liquidation Breakdown
- Asset: $KORU
- Event: Short Liquidation 🟢
- Liquidated Value: $116,000
- Liquidation Price: $7.780
🔥 What Does This Signal?
Short liquidations can accelerate upward momentum as forced buyers rush to close their positions. If bullish demand continues, KORU could attract additional buyers and trigger another short squeeze.
🎯 Professional Market Outlook
- Bullish Trigger: Sustained trading above $7.780 could strengthen the upside case.
- Upside Targets: $7.90 → $8.05 → $8.20.
- Support Zone: $7.65–$7.55.
- Risk Level: A breakdown below $7.55 could weaken the bullish setup.
💡 My Trading View:
KORU has a potentially bullish short-term setup following this liquidation event. I would favor buyers if price holds above $7.780 and confirms strength with volume. Avoid chasing an immediate spike; wait for confirmation.
⚠️ Trade Smart: Liquidation data alone does not confirm a trend reversal. Always manage leverage and protect your capital.
#KORUUSDT
#Cryptotreding
#LiquidationAlert
#BinanceSquare
{etf_us}(KORU.ETF)
🟢 $KORU SHORT SQUEEZE ALERT — $116K LIQUIDATED! 🚀
⚡ The Bears Just Took a Serious Hit!
A $116K KORU short position was wiped out at $7.780, highlighting aggressive buying pressure and a potential shift in short-term market sentiment.
📊 Liquidation Breakdown
- Asset: $KORU
- Event: Short Liquidation 🟢
- Liquidated Value: $116,000
- Liquidation Price: $7.780
🔥 What Does This Signal?
Short liquidations can accelerate upward momentum as forced buyers rush to close their positions. If bullish demand continues, KORU could attract additional buyers and trigger another short squeeze.
🎯 Professional Market Outlook
- Bullish Trigger: Sustained trading above $7.780 could strengthen the upside case.
- Upside Targets: $7.90 → $8.05 → $8.20.
- Support Zone: $7.65–$7.55.
- Risk Level: A breakdown below $7.55 could weaken the bullish setup.
💡 My Trading View:
KORU has a potentially bullish short-term setup following this liquidation event. I would favor buyers if price holds above $7.780 and confirms strength with volume. Avoid chasing an immediate spike; wait for confirmation.
⚠️ Trade Smart: Liquidation data alone does not confirm a trend reversal. Always manage leverage and protect your capital.
#KORUUSDT
#Cryptotreding
#LiquidationAlert
#BinanceSquare
⚡ The Bears Just Took a Serious Hit!
A $116K KORU short position was wiped out at $7.780, highlighting aggressive buying pressure and a potential shift in short-term market sentiment.
📊 Liquidation Breakdown
- Asset: $KORU
- Event: Short Liquidation 🟢
- Liquidated Value: $116,000
- Liquidation Price: $7.780
🔥 What Does This Signal?
Short liquidations can accelerate upward momentum as forced buyers rush to close their positions. If bullish demand continues, KORU could attract additional buyers and trigger another short squeeze.
🎯 Professional Market Outlook
- Bullish Trigger: Sustained trading above $7.780 could strengthen the upside case.
- Upside Targets: $7.90 → $8.05 → $8.20.
- Support Zone: $7.65–$7.55.
- Risk Level: A breakdown below $7.55 could weaken the bullish setup.
💡 My Trading View:
KORU has a potentially bullish short-term setup following this liquidation event. I would favor buyers if price holds above $7.780 and confirms strength with volume. Avoid chasing an immediate spike; wait for confirmation.
⚠️ Trade Smart: Liquidation data alone does not confirm a trend reversal. Always manage leverage and protect your capital.
#KORUUSDT
#Cryptotreding
#LiquidationAlert
#BinanceSquare
KORU-7.78%
KORUETF-5.95%
41
⚠️ $CRUDE OIL BUYERS UNDER PRESSURE — $98.1K WIPED OUT! 🛢️
🔴 #CL Liquidated Long: $98.1K at $85.05
A significant warning sign for crude oil bulls! Nearly $100K in leveraged long positions got liquidated around $85.05, highlighting the downside risk facing buyers.
📊 LIQUIDATION BREAKDOWN
- Asset: Crude Oil Futures (CL)
- Liquidated Side: Long
- Liquidation Value: $98,100
- Liquidation Price: $85.05
🔥 IMPORTANT PRICE ZONES
- Immediate Resistance: $85.50–$86.00
- Upside Target: $87.00
- Major Recovery Zone: $88.00
- Immediate Support: $84.50–$85.00
- Breakdown Watch: Below $84.50
A strong recovery above $86.00 would weaken the bearish setup.
Watch geopolitical headlines and oil supply developments for sudden volatility.
💥 THE BIG QUESTION: Will crude oil buyers defend $85, or are sellers preparing another liquidity sweep?
#CLUSDT
#Cryptotreding
#Liquidationalert
#Binancesquare
{stock_us}(CL.US)
⚠️ $CRUDE OIL BUYERS UNDER PRESSURE — $98.1K WIPED OUT! 🛢️
🔴 #CL Liquidated Long: $98.1K at $85.05
A significant warning sign for crude oil bulls! Nearly $100K in leveraged long positions got liquidated around $85.05, highlighting the downside risk facing buyers.
📊 LIQUIDATION BREAKDOWN
- Asset: Crude Oil Futures (CL)
- Liquidated Side: Long
- Liquidation Value: $98,100
- Liquidation Price: $85.05
🔥 IMPORTANT PRICE ZONES
- Immediate Resistance: $85.50–$86.00
- Upside Target: $87.00
- Major Recovery Zone: $88.00
- Immediate Support: $84.50–$85.00
- Breakdown Watch: Below $84.50
A strong recovery above $86.00 would weaken the bearish setup.
Watch geopolitical headlines and oil supply developments for sudden volatility.
💥 THE BIG QUESTION: Will crude oil buyers defend $85, or are sellers preparing another liquidity sweep?
#CLUSDT
#Cryptotreding
#Liquidationalert
#Binancesquare
🔴 #CL Liquidated Long: $98.1K at $85.05
A significant warning sign for crude oil bulls! Nearly $100K in leveraged long positions got liquidated around $85.05, highlighting the downside risk facing buyers.
📊 LIQUIDATION BREAKDOWN
- Asset: Crude Oil Futures (CL)
- Liquidated Side: Long
- Liquidation Value: $98,100
- Liquidation Price: $85.05
🔥 IMPORTANT PRICE ZONES
- Immediate Resistance: $85.50–$86.00
- Upside Target: $87.00
- Major Recovery Zone: $88.00
- Immediate Support: $84.50–$85.00
- Breakdown Watch: Below $84.50
A strong recovery above $86.00 would weaken the bearish setup.
Watch geopolitical headlines and oil supply developments for sudden volatility.
💥 THE BIG QUESTION: Will crude oil buyers defend $85, or are sellers preparing another liquidity sweep?
#CLUSDT
#Cryptotreding
#Liquidationalert
#Binancesquare
1
🚨 $BRENT OIL BULLS JUST TOOK A HEAVY HIT! 🔴
#BZ | Long Liquidation: $81.7K at $90.64
The latest liquidation event highlights serious pressure on leveraged buyers. A position worth $81.7K was forcibly closed around $90.64, showing how quickly downside volatility can punish overleveraged traders.
📊 MARKET BREAKDOWN
💰 Liquidation Level: $90.64
📉 Latest Market Price: Around $91.13
🔻 24H Performance: Approximately -6.62%
🎯 CRITICAL PRICE ZONES
🔴 Immediate Resistance: $92.00–$93.00
🚀 Upside Recovery Target: $95.00
🔥 Higher Resistance: $97.00
🟢 Immediate Support: $90.00–$90.60
⚠️ Breakdown Zone: Below $90.00
📈 MY TRADING OUTLOOK
BZ is showing considerable selling pressure after its recent decline.
My approach:
- If BZ holds above $90.00 and reclaims $92.00, a recovery toward $95.00 could develop.
- If sellers push below $90.00, further downside toward lower support zones becomes possible.
SIGNAL PROVIDER'S VERDICT: Cautious bearish bias until buyers reclaim resistance. Watch the $90.00 level closely because another breakdown could trigger additional long liquidations.
Will BZ bulls defend the $90 zone, or are sellers preparing another aggressive move? 👀
⚠️ Risk Disclaimer: These are technical scenarios, not guaranteed predictions. Use disciplined position sizing and stop-loss protection.
#BZUSDT#Cryptotreding #Liquidationalert #Binancesquare
{stock_us}(BZ.US)
🚨 $BRENT OIL BULLS JUST TOOK A HEAVY HIT! 🔴
#BZ | Long Liquidation: $81.7K at $90.64
The latest liquidation event highlights serious pressure on leveraged buyers. A position worth $81.7K was forcibly closed around $90.64, showing how quickly downside volatility can punish overleveraged traders.
📊 MARKET BREAKDOWN
💰 Liquidation Level: $90.64
📉 Latest Market Price: Around $91.13
🔻 24H Performance: Approximately -6.62%
🎯 CRITICAL PRICE ZONES
🔴 Immediate Resistance: $92.00–$93.00
🚀 Upside Recovery Target: $95.00
🔥 Higher Resistance: $97.00
🟢 Immediate Support: $90.00–$90.60
⚠️ Breakdown Zone: Below $90.00
📈 MY TRADING OUTLOOK
BZ is showing considerable selling pressure after its recent decline.
My approach:
- If BZ holds above $90.00 and reclaims $92.00, a recovery toward $95.00 could develop.
- If sellers push below $90.00, further downside toward lower support zones becomes possible.
SIGNAL PROVIDER'S VERDICT: Cautious bearish bias until buyers reclaim resistance. Watch the $90.00 level closely because another breakdown could trigger additional long liquidations.
Will BZ bulls defend the $90 zone, or are sellers preparing another aggressive move? 👀
⚠️ Risk Disclaimer: These are technical scenarios, not guaranteed predictions. Use disciplined position sizing and stop-loss protection.
#BZUSDT#Cryptotreding #Liquidationalert #Binancesquare
#BZ | Long Liquidation: $81.7K at $90.64
The latest liquidation event highlights serious pressure on leveraged buyers. A position worth $81.7K was forcibly closed around $90.64, showing how quickly downside volatility can punish overleveraged traders.
📊 MARKET BREAKDOWN
💰 Liquidation Level: $90.64
📉 Latest Market Price: Around $91.13
🔻 24H Performance: Approximately -6.62%
🎯 CRITICAL PRICE ZONES
🔴 Immediate Resistance: $92.00–$93.00
🚀 Upside Recovery Target: $95.00
🔥 Higher Resistance: $97.00
🟢 Immediate Support: $90.00–$90.60
⚠️ Breakdown Zone: Below $90.00
📈 MY TRADING OUTLOOK
BZ is showing considerable selling pressure after its recent decline.
My approach:
- If BZ holds above $90.00 and reclaims $92.00, a recovery toward $95.00 could develop.
- If sellers push below $90.00, further downside toward lower support zones becomes possible.
SIGNAL PROVIDER'S VERDICT: Cautious bearish bias until buyers reclaim resistance. Watch the $90.00 level closely because another breakdown could trigger additional long liquidations.
Will BZ bulls defend the $90 zone, or are sellers preparing another aggressive move? 👀
⚠️ Risk Disclaimer: These are technical scenarios, not guaranteed predictions. Use disciplined position sizing and stop-loss protection.
#BZUSDT#Cryptotreding #Liquidationalert #Binancesquare
6
🚀 $ENA SHORT SELLERS JUST GOT CAUGHT OFFSIDE! 🔥
🟢 #ENA Liquidated Short: $72.7K at $0.158
The pressure is building around Ethena! A $72.7K short liquidation indicates that bearish traders were forced out of their positions as price moved against them.
📊 KEY MARKET LEVELS
💰 Liquidation Price: $0.158
📍 Current Price: Around $0.1535
🟢 24H Change: Approximately +0.07%
🎯 TRADER'S WATCHLIST
🔥 Resistance 1: $0.1580–$0.1590
🚀 Upside Target 1: $0.1620
🚀 Upside Target 2: $0.1650
🛡️ Support 1: $0.1500
⚠️ Critical Support: $0.1460–$0.1470
MY NEXT MOVE OUTLOOK:
ENA could be preparing for another recovery attempt. However, bulls need to reclaim $0.158–$0.159 and hold above this zone to strengthen the bullish case.
A confirmed breakout could open the door toward $0.162–$0.165. Failure to reclaim resistance may invite another pullback toward $0.150.
📢 SIGNAL VIEW: Cautiously bullish above $0.158 after confirmation. Avoid chasing the move before a proper breakout.
The short sellers have taken a hit, but can ENA turn this momentum into a bigger rally? 👀
#ENAUSDT
#cryptotreding
#Liquidationalert
#Binancesquare
{spot}(ENAUSDT)
🚀 $ENA SHORT SELLERS JUST GOT CAUGHT OFFSIDE! 🔥
🟢 #ENA Liquidated Short: $72.7K at $0.158
The pressure is building around Ethena! A $72.7K short liquidation indicates that bearish traders were forced out of their positions as price moved against them.
📊 KEY MARKET LEVELS
💰 Liquidation Price: $0.158
📍 Current Price: Around $0.1535
🟢 24H Change: Approximately +0.07%
🎯 TRADER'S WATCHLIST
🔥 Resistance 1: $0.1580–$0.1590
🚀 Upside Target 1: $0.1620
🚀 Upside Target 2: $0.1650
🛡️ Support 1: $0.1500
⚠️ Critical Support: $0.1460–$0.1470
MY NEXT MOVE OUTLOOK:
ENA could be preparing for another recovery attempt. However, bulls need to reclaim $0.158–$0.159 and hold above this zone to strengthen the bullish case.
A confirmed breakout could open the door toward $0.162–$0.165. Failure to reclaim resistance may invite another pullback toward $0.150.
📢 SIGNAL VIEW: Cautiously bullish above $0.158 after confirmation. Avoid chasing the move before a proper breakout.
The short sellers have taken a hit, but can ENA turn this momentum into a bigger rally? 👀
#ENAUSDT
#cryptotreding
#Liquidationalert
#Binancesquare
🟢 #ENA Liquidated Short: $72.7K at $0.158
The pressure is building around Ethena! A $72.7K short liquidation indicates that bearish traders were forced out of their positions as price moved against them.
📊 KEY MARKET LEVELS
💰 Liquidation Price: $0.158
📍 Current Price: Around $0.1535
🟢 24H Change: Approximately +0.07%
🎯 TRADER'S WATCHLIST
🔥 Resistance 1: $0.1580–$0.1590
🚀 Upside Target 1: $0.1620
🚀 Upside Target 2: $0.1650
🛡️ Support 1: $0.1500
⚠️ Critical Support: $0.1460–$0.1470
MY NEXT MOVE OUTLOOK:
ENA could be preparing for another recovery attempt. However, bulls need to reclaim $0.158–$0.159 and hold above this zone to strengthen the bullish case.
A confirmed breakout could open the door toward $0.162–$0.165. Failure to reclaim resistance may invite another pullback toward $0.150.
📢 SIGNAL VIEW: Cautiously bullish above $0.158 after confirmation. Avoid chasing the move before a proper breakout.
The short sellers have taken a hit, but can ENA turn this momentum into a bigger rally? 👀
#ENAUSDT
#cryptotreding
#Liquidationalert
#Binancesquare
3
#TradFiForBeginners
🚨 $6 TRILLION CRYPTO MARKET? A MASSIVE DATA MISMATCH OR THE NEXT BIG OPPORTUNITY? 🔥
The crypto market is attracting attention, but there's one important detail investors shouldn't ignore!
A viral claim suggests that total crypto market capitalization has reached $6 TRILLION, with Bitcoin's dominance falling below 25%.
However, the latest available market data tells a different story. 👀
📊 MARKET SNAPSHOT – NOVEMBER 10, 2026
₿ Bitcoin (BTC)
💰 Price: $74,728
🔴 24H Change: -1.00%
📉 Market Dominance: Approximately 60.3%
💎 Ethereum (ETH)
💰 Price: $2,126
🔴 24H Change: -0.42%
🥇 Gold (XAU)
💰 Price: $4,112.51
🔴 Daily Change: -0.66%
🌍 TOTAL CRYPTO MARKET
💰 Market Cap: Approximately $2.50 TRILLION
🔴 24H Change: -1.37%
🔥 WHAT'S THE BIGGER PICTURE?
Bitcoin still controls the majority of the crypto market. A BTC dominance reading below 25% is NOT supported by the latest available figures.
But here's what traders should watch:
📈 If total crypto market capitalization starts expanding while BTC dominance declines, it could signal growing strength across altcoins.
🚀 If ETH begins outperforming BTC, it could add momentum to a broader altcoin rally.
⚠️ For now, the market needs stronger confirmation before calling this the beginning of another massive bull run.
MY MARKET VIEW:
Don't chase headlines. Watch BTC dominance, ETH strength, market capitalization, and trading volume. The next major opportunity could emerge when these indicators start moving together!
Are we preparing for the next ALTCOIN SEASON, or is the market still waiting for its next big move? 👇
#BTCUSDT #ETHUSDT #XAUUSDT
#Cryptotreding
#Liquadationalert
#Binancesquare
#TradFiForBeginners
🚨 $6 TRILLION CRYPTO MARKET? A MASSIVE DATA MISMATCH OR THE NEXT BIG OPPORTUNITY? 🔥
The crypto market is attracting attention, but there's one important detail investors shouldn't ignore!
A viral claim suggests that total crypto market capitalization has reached $6 TRILLION, with Bitcoin's dominance falling below 25%.
However, the latest available market data tells a different story. 👀
📊 MARKET SNAPSHOT – NOVEMBER 10, 2026
₿ Bitcoin (BTC)
💰 Price: $74,728
🔴 24H Change: -1.00%
📉 Market Dominance: Approximately 60.3%
💎 Ethereum (ETH)
💰 Price: $2,126
🔴 24H Change: -0.42%
🥇 Gold (XAU)
💰 Price: $4,112.51
🔴 Daily Change: -0.66%
🌍 TOTAL CRYPTO MARKET
💰 Market Cap: Approximately $2.50 TRILLION
🔴 24H Change: -1.37%
🔥 WHAT'S THE BIGGER PICTURE?
Bitcoin still controls the majority of the crypto market. A BTC dominance reading below 25% is NOT supported by the latest available figures.
But here's what traders should watch:
📈 If total crypto market capitalization starts expanding while BTC dominance declines, it could signal growing strength across altcoins.
🚀 If ETH begins outperforming BTC, it could add momentum to a broader altcoin rally.
⚠️ For now, the market needs stronger confirmation before calling this the beginning of another massive bull run.
MY MARKET VIEW:
Don't chase headlines. Watch BTC dominance, ETH strength, market capitalization, and trading volume. The next major opportunity could emerge when these indicators start moving together!
Are we preparing for the next ALTCOIN SEASON, or is the market still waiting for its next big move? 👇
#BTCUSDT #ETHUSDT #XAUUSDT
#Cryptotreding
#Liquadationalert
#Binancesquare
🚨 $6 TRILLION CRYPTO MARKET? A MASSIVE DATA MISMATCH OR THE NEXT BIG OPPORTUNITY? 🔥
The crypto market is attracting attention, but there's one important detail investors shouldn't ignore!
A viral claim suggests that total crypto market capitalization has reached $6 TRILLION, with Bitcoin's dominance falling below 25%.
However, the latest available market data tells a different story. 👀
📊 MARKET SNAPSHOT – NOVEMBER 10, 2026
₿ Bitcoin (BTC)
💰 Price: $74,728
🔴 24H Change: -1.00%
📉 Market Dominance: Approximately 60.3%
💎 Ethereum (ETH)
💰 Price: $2,126
🔴 24H Change: -0.42%
🥇 Gold (XAU)
💰 Price: $4,112.51
🔴 Daily Change: -0.66%
🌍 TOTAL CRYPTO MARKET
💰 Market Cap: Approximately $2.50 TRILLION
🔴 24H Change: -1.37%
🔥 WHAT'S THE BIGGER PICTURE?
Bitcoin still controls the majority of the crypto market. A BTC dominance reading below 25% is NOT supported by the latest available figures.
But here's what traders should watch:
📈 If total crypto market capitalization starts expanding while BTC dominance declines, it could signal growing strength across altcoins.
🚀 If ETH begins outperforming BTC, it could add momentum to a broader altcoin rally.
⚠️ For now, the market needs stronger confirmation before calling this the beginning of another massive bull run.
MY MARKET VIEW:
Don't chase headlines. Watch BTC dominance, ETH strength, market capitalization, and trading volume. The next major opportunity could emerge when these indicators start moving together!
Are we preparing for the next ALTCOIN SEASON, or is the market still waiting for its next big move? 👇
#BTCUSDT #ETHUSDT #XAUUSDT
#Cryptotreding
#Liquadationalert
#Binancesquare
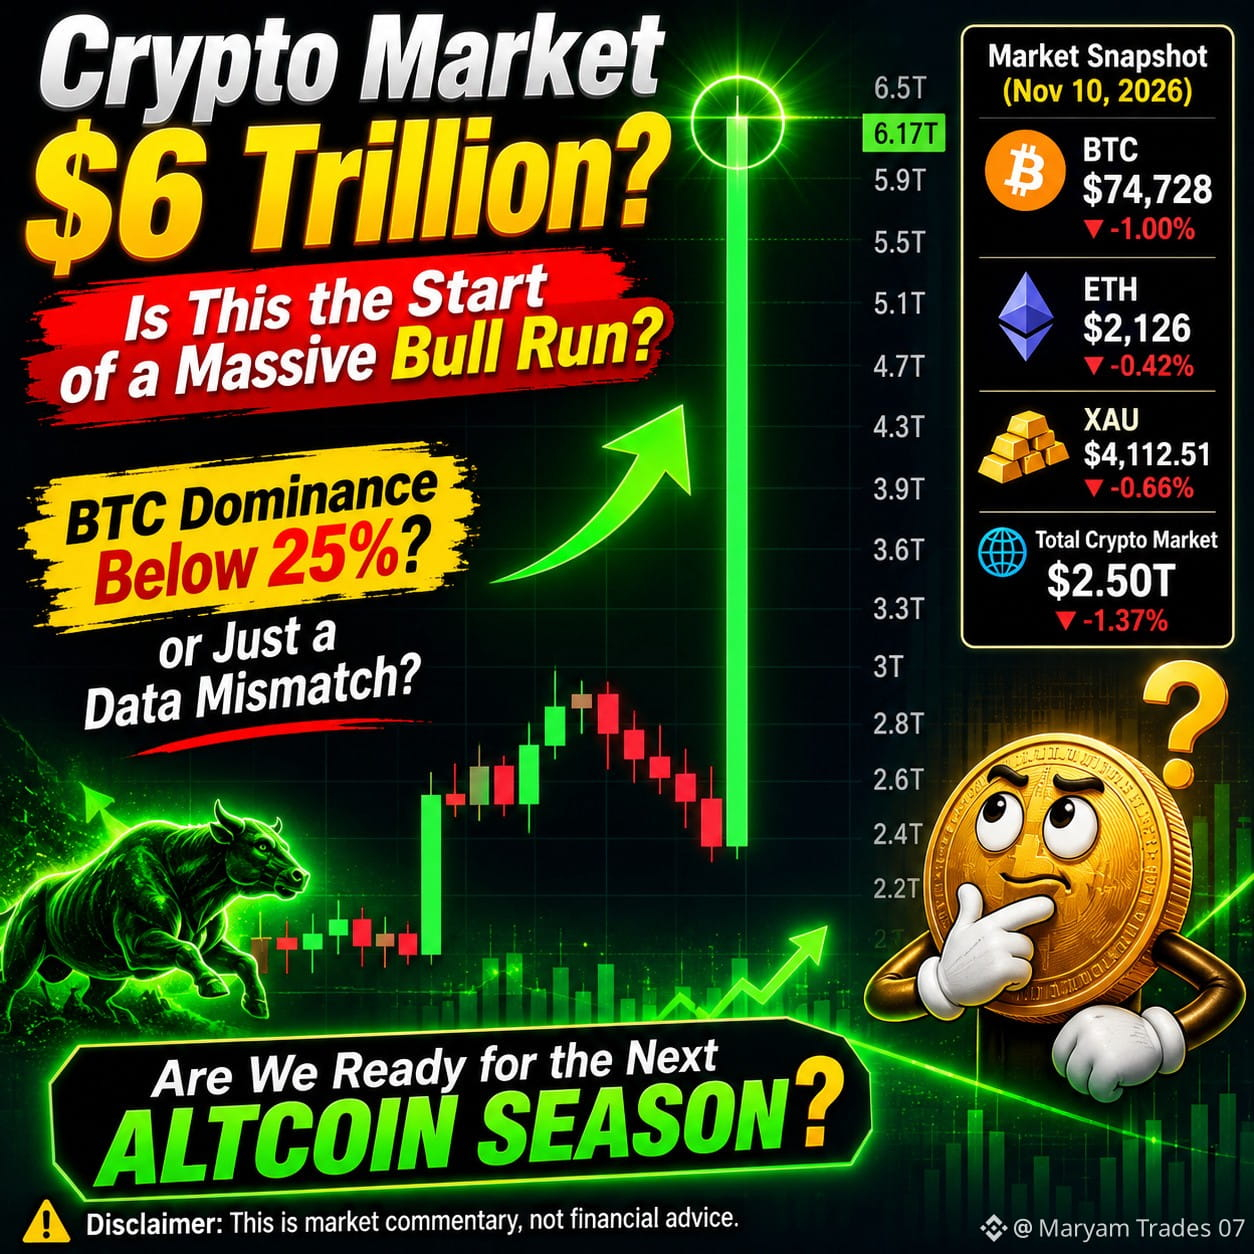
4
#TradFiForBeginners
🚀 $LUNA CLASSIC (LUNC): Is a Major Reversal Finally Coming?
🔥 LUNC is attracting attention as the broader Korean market experiences significant volatility. Despite BTC gaining 1.22% and ETH climbing 0.97%, the Kimchi premium on Upbit has barely reacted.
📊 LUNC Market Outlook
The daily chart remains in oversold territory, suggesting that selling pressure may be approaching exhaustion. However, bulls still need to prove their strength before a sustained recovery can begin.
🎯 Key Levels to Watch:
- Important recovery level: $0.00005358
- Bullish confirmation: A sustained move above this level.
- Major psychological target: $0.0001
- Long-term speculative target: $0.26
- Extremely ambitious target: $1.00
📈 Potential Price Growth:
- From $0.00005358 to $0.0001: +86.6%
- From $0.00005358 to $0.26: +484,990%
- From $0.00005358 to $1.00: +1,865,956%
These are hypothetical upside scenarios, not confirmed targets. A $1 valuation would require an extraordinary change in LUNC's market capitalization and supply dynamics.
💡 My Opinion: LUNC needs to establish support above $0.00005358 before bulls can claim a meaningful trend reversal. If buying volume returns, a recovery attempt could develop. Until then, patience is more important than chasing speculative targets.
🔥 Could LUNC surprise the market with another major comeback?
#LUNCUSDT
#Cryptotreding
#LiquidationAlert
#Binancesquare
#TradFiForBeginners
🚀 $LUNA CLASSIC (LUNC): Is a Major Reversal Finally Coming?
🔥 LUNC is attracting attention as the broader Korean market experiences significant volatility. Despite BTC gaining 1.22% and ETH climbing 0.97%, the Kimchi premium on Upbit has barely reacted.
📊 LUNC Market Outlook
The daily chart remains in oversold territory, suggesting that selling pressure may be approaching exhaustion. However, bulls still need to prove their strength before a sustained recovery can begin.
🎯 Key Levels to Watch:
- Important recovery level: $0.00005358
- Bullish confirmation: A sustained move above this level.
- Major psychological target: $0.0001
- Long-term speculative target: $0.26
- Extremely ambitious target: $1.00
📈 Potential Price Growth:
- From $0.00005358 to $0.0001: +86.6%
- From $0.00005358 to $0.26: +484,990%
- From $0.00005358 to $1.00: +1,865,956%
These are hypothetical upside scenarios, not confirmed targets. A $1 valuation would require an extraordinary change in LUNC's market capitalization and supply dynamics.
💡 My Opinion: LUNC needs to establish support above $0.00005358 before bulls can claim a meaningful trend reversal. If buying volume returns, a recovery attempt could develop. Until then, patience is more important than chasing speculative targets.
🔥 Could LUNC surprise the market with another major comeback?
#LUNCUSDT
#Cryptotreding
#LiquidationAlert
#Binancesquare
🚀 $LUNA CLASSIC (LUNC): Is a Major Reversal Finally Coming?
🔥 LUNC is attracting attention as the broader Korean market experiences significant volatility. Despite BTC gaining 1.22% and ETH climbing 0.97%, the Kimchi premium on Upbit has barely reacted.
📊 LUNC Market Outlook
The daily chart remains in oversold territory, suggesting that selling pressure may be approaching exhaustion. However, bulls still need to prove their strength before a sustained recovery can begin.
🎯 Key Levels to Watch:
- Important recovery level: $0.00005358
- Bullish confirmation: A sustained move above this level.
- Major psychological target: $0.0001
- Long-term speculative target: $0.26
- Extremely ambitious target: $1.00
📈 Potential Price Growth:
- From $0.00005358 to $0.0001: +86.6%
- From $0.00005358 to $0.26: +484,990%
- From $0.00005358 to $1.00: +1,865,956%
These are hypothetical upside scenarios, not confirmed targets. A $1 valuation would require an extraordinary change in LUNC's market capitalization and supply dynamics.
💡 My Opinion: LUNC needs to establish support above $0.00005358 before bulls can claim a meaningful trend reversal. If buying volume returns, a recovery attempt could develop. Until then, patience is more important than chasing speculative targets.
🔥 Could LUNC surprise the market with another major comeback?
#LUNCUSDT
#Cryptotreding
#LiquidationAlert
#Binancesquare

79
🟢 $SNDK SHORT SQUEEZE ALERT! Bulls Are Fighting Back! 🚀
A $62.7K short liquidation has hit SNDK at $901.04, signaling that bearish traders are facing pressure as the price moves against their positions.
🔥 Why This Matters:
- Liquidation value: $62.7K
- Trigger price: $901.04
- Market signal: Short-side pressure
- Key observation: Further upside could force additional short sellers to close their positions, potentially accelerating bullish momentum.
📊 What's Next for SNDK?
Bullish Scenario: If SNDK holds above $901 and attracts fresh buying volume, a push toward $910–$920 could develop.
Bearish Scenario: Failure to maintain $901 may invite selling pressure, with $890–$880 acting as potential downside zones.
🎯 Trading Strategy:
- Entry watch: Sustained move above $901.
- Upside targets: $910 / $920.
- Invalidation: A decisive drop below $890.
- Avoid chasing the move without volume confirmation.
⚡ My Signal View: Short liquidations are giving buyers an opportunity, but the real test is whether bulls can sustain the momentum. Another short squeeze is possible if buying pressure continues.
Stay alert — SNDK could be approaching its next decisive move!
⚠️ Risk management is essential. These levels are scenario-based, not guaranteed predictions.
#SNDKUSDT
#Cryptotreding
#Liquidationalart
#Binancesquare
{stock_us}(SNDK.US)
🟢 $SNDK SHORT SQUEEZE ALERT! Bulls Are Fighting Back! 🚀
A $62.7K short liquidation has hit SNDK at $901.04, signaling that bearish traders are facing pressure as the price moves against their positions.
🔥 Why This Matters:
- Liquidation value: $62.7K
- Trigger price: $901.04
- Market signal: Short-side pressure
- Key observation: Further upside could force additional short sellers to close their positions, potentially accelerating bullish momentum.
📊 What's Next for SNDK?
Bullish Scenario: If SNDK holds above $901 and attracts fresh buying volume, a push toward $910–$920 could develop.
Bearish Scenario: Failure to maintain $901 may invite selling pressure, with $890–$880 acting as potential downside zones.
🎯 Trading Strategy:
- Entry watch: Sustained move above $901.
- Upside targets: $910 / $920.
- Invalidation: A decisive drop below $890.
- Avoid chasing the move without volume confirmation.
⚡ My Signal View: Short liquidations are giving buyers an opportunity, but the real test is whether bulls can sustain the momentum. Another short squeeze is possible if buying pressure continues.
Stay alert — SNDK could be approaching its next decisive move!
⚠️ Risk management is essential. These levels are scenario-based, not guaranteed predictions.
#SNDKUSDT
#Cryptotreding
#Liquidationalart
#Binancesquare
A $62.7K short liquidation has hit SNDK at $901.04, signaling that bearish traders are facing pressure as the price moves against their positions.
🔥 Why This Matters:
- Liquidation value: $62.7K
- Trigger price: $901.04
- Market signal: Short-side pressure
- Key observation: Further upside could force additional short sellers to close their positions, potentially accelerating bullish momentum.
📊 What's Next for SNDK?
Bullish Scenario: If SNDK holds above $901 and attracts fresh buying volume, a push toward $910–$920 could develop.
Bearish Scenario: Failure to maintain $901 may invite selling pressure, with $890–$880 acting as potential downside zones.
🎯 Trading Strategy:
- Entry watch: Sustained move above $901.
- Upside targets: $910 / $920.
- Invalidation: A decisive drop below $890.
- Avoid chasing the move without volume confirmation.
⚡ My Signal View: Short liquidations are giving buyers an opportunity, but the real test is whether bulls can sustain the momentum. Another short squeeze is possible if buying pressure continues.
Stay alert — SNDK could be approaching its next decisive move!
⚠️ Risk management is essential. These levels are scenario-based, not guaranteed predictions.
#SNDKUSDT
#Cryptotreding
#Liquidationalart
#Binancesquare
SNDK-6.61%
SNDKUS-4.75%
127

·
--
උසබ තත්ත්වය
🚨 $TAO /USDT is holding the line at $234! 🚨
Bears pushed hard, but buyers keep defending the zone. 👀
A breakout above $242 could ignite the next rally, while $233 remains the key battlefield.
⚡ High tension.
⚡ Volume building.
⚡ Next move could be explosive.
#TAO #TAOUSDT #CryptoNewss #binnance #cryptotreding
🚨 $TAO /USDT is holding the line at $234! 🚨
Bears pushed hard, but buyers keep defending the zone. 👀
A breakout above $242 could ignite the next rally, while $233 remains the key battlefield.
⚡ High tension.
⚡ Volume building.
⚡ Next move could be explosive.
#TAO #TAOUSDT #CryptoNewss #binnance #cryptotreding
Bears pushed hard, but buyers keep defending the zone. 👀
A breakout above $242 could ignite the next rally, while $233 remains the key battlefield.
⚡ High tension.
⚡ Volume building.
⚡ Next move could be explosive.
#TAO #TAOUSDT #CryptoNewss #binnance #cryptotreding
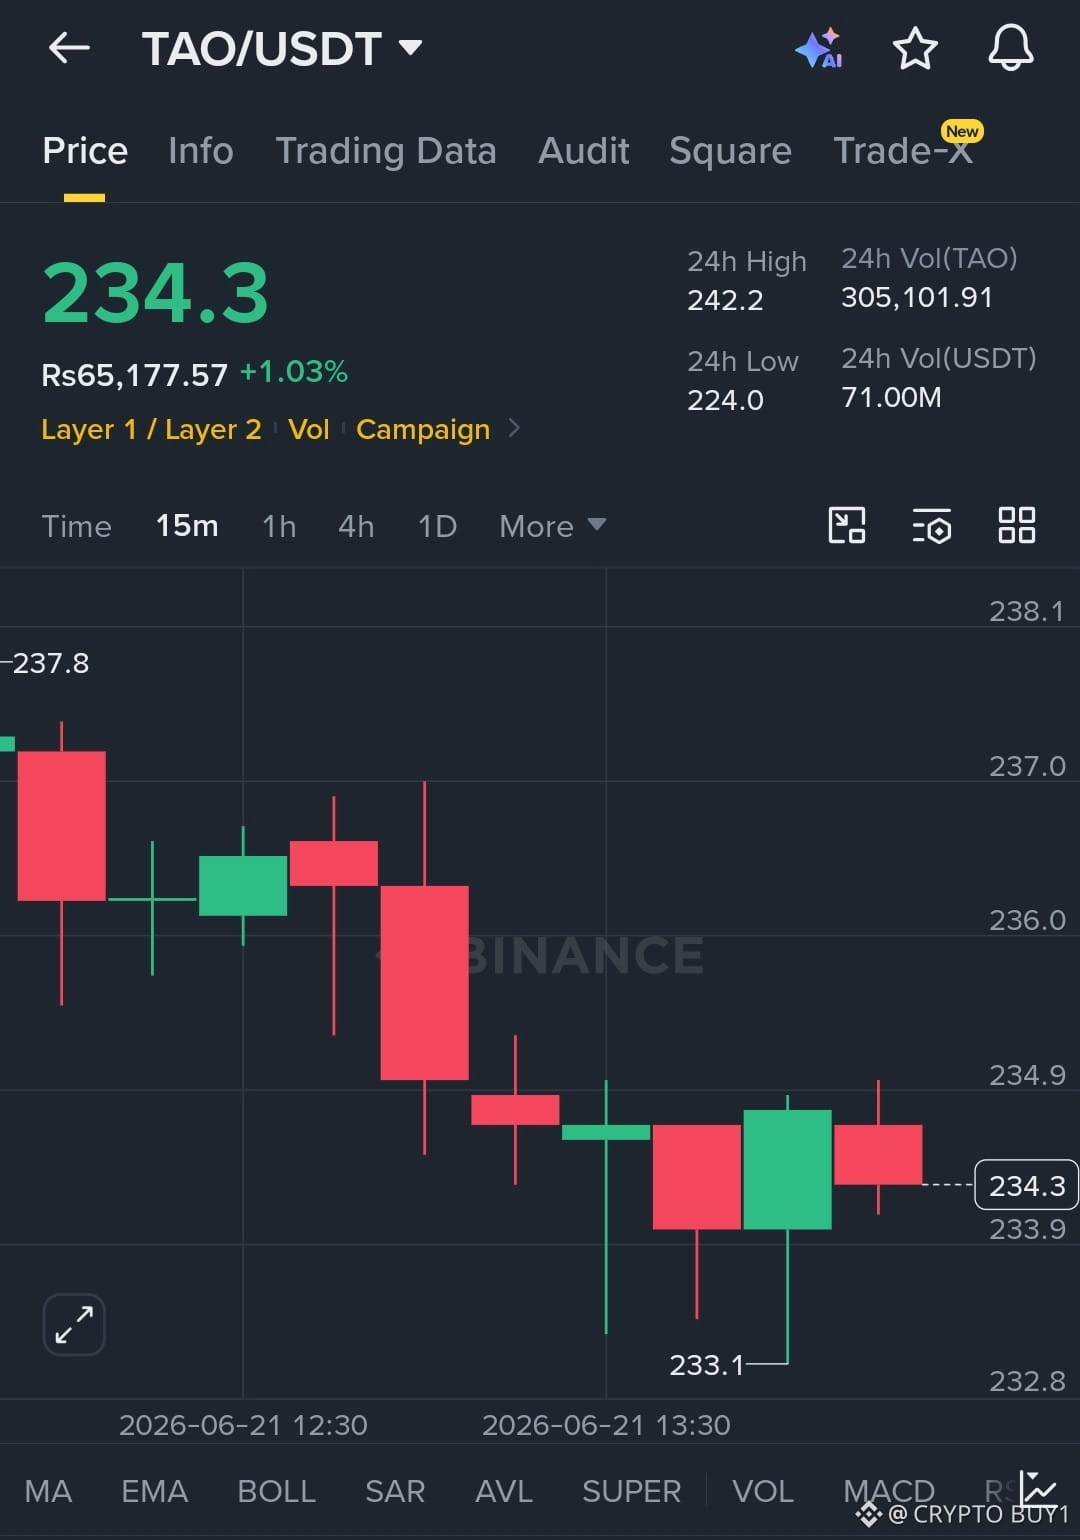
172
තවත් අන්තර්ගතයන් ගවේෂණය කිරීමට ඇතුල් වන්න
Binance චතුරශ්රය හි ගෝලීය ක්රිප්ටෝ පරිශීලකයින් හා එක්වන්න
⚡️ ක්රිප්ටෝ පිළිබඳ නවතම සහ ප්රයෝජනවත් තොරතුරු ලබා ගන්න.
💬 ලොව විශාලතම ක්රිප්ටෝ හුවමාරුව මගින් විශ්වාස කෙරේ.
👍 සත්යායනය කරන ලද නිර්මාණකරුවන්ගෙන් සැබෑ විදසුන් සොයා ගන්න.
විද්යුත් තැපෑල / දුරකථන අංකය
නැගී එන මාතෘකා
1
#HuangExitNvidiaStrategyInFocus
49,404 නැරඹීම්
723 සාකච්ඡා කරමින්
2
#AnthropicRejectsIPODelayValuationinQuestion
630,545 නැරඹීම්
5,026 සාකච්ඡා කරමින්
3
#BitMineReports$6.3BNetLossForFiscal2026
5,533 නැරඹීම්
88 සාකච්ඡා කරමින්
4
#ChipStocksExtendLossesAfterNvidiaCEOChange
18,285 නැරඹීම්
323 සාකච්ඡා කරමින්
5
#ThailandProposes$148KDailyStablecoinDepositWithdrawalCaps
1,458 නැරඹීම්
25 සාකච්ඡා කරමින්
6
#CoreWeaveJumps10%On168%RevenueGrowth
154,652 නැරඹීම්
1,562 සාකච්ඡා කරමින්
7
#ZcashFallsBelow$1000ForFirstTimeSinceSeptember
75,691 නැරඹීම්
255 සාකච්ඡා කරමින්
8
#MSCIRemovalMayCurbStrategy’sBitcoinBuying
38,043 නැරඹීම්
519 සාකච්ඡා කරමින්
9
#TradFiForBeginners
515,661 නැරඹීම්
3,614 සාකච්ඡා කරමින්
10
#USJoblessClaimsRise
19.1M නැරඹීම්
7,732 සාකච්ඡා කරමින්