
#cryptobearish
cryptobearish
314,941 නැරඹීම්
654 සාකච්ඡා කරමින්
උණුසුම්
නවතම

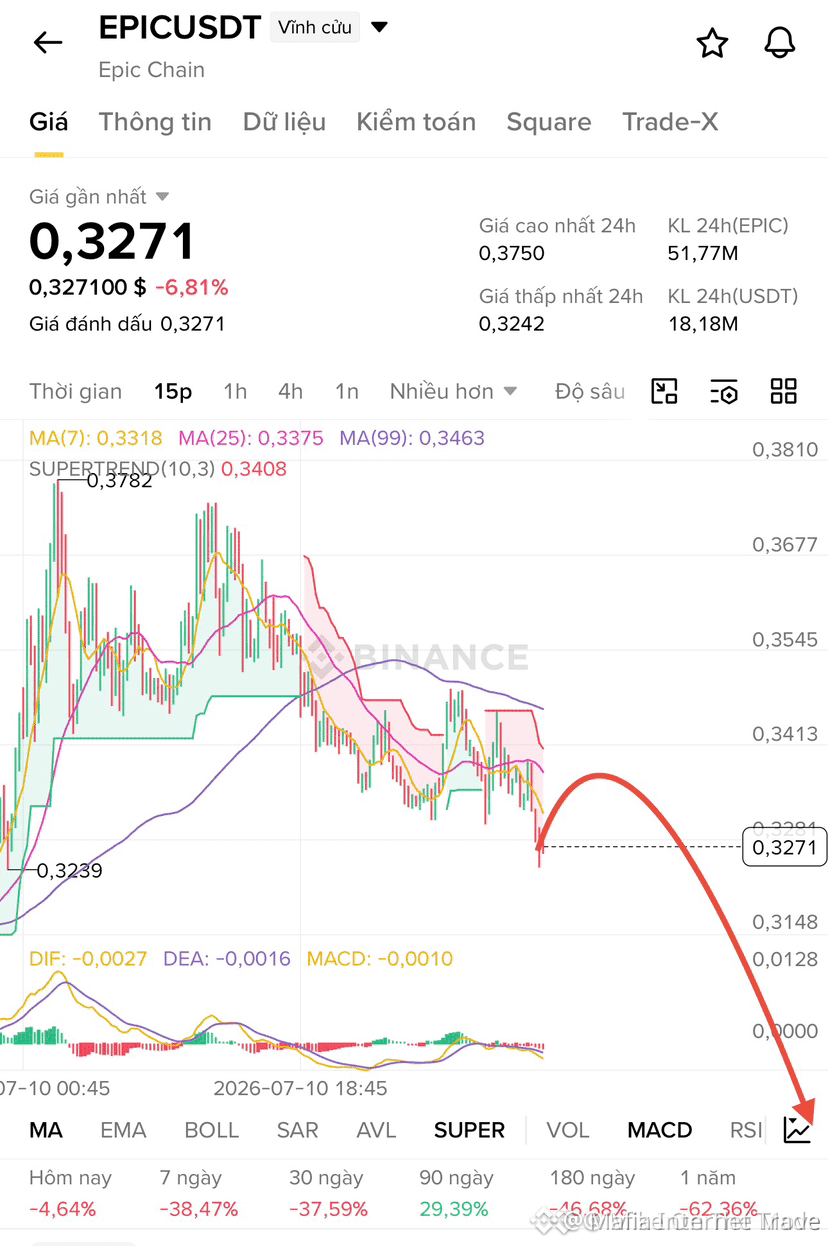
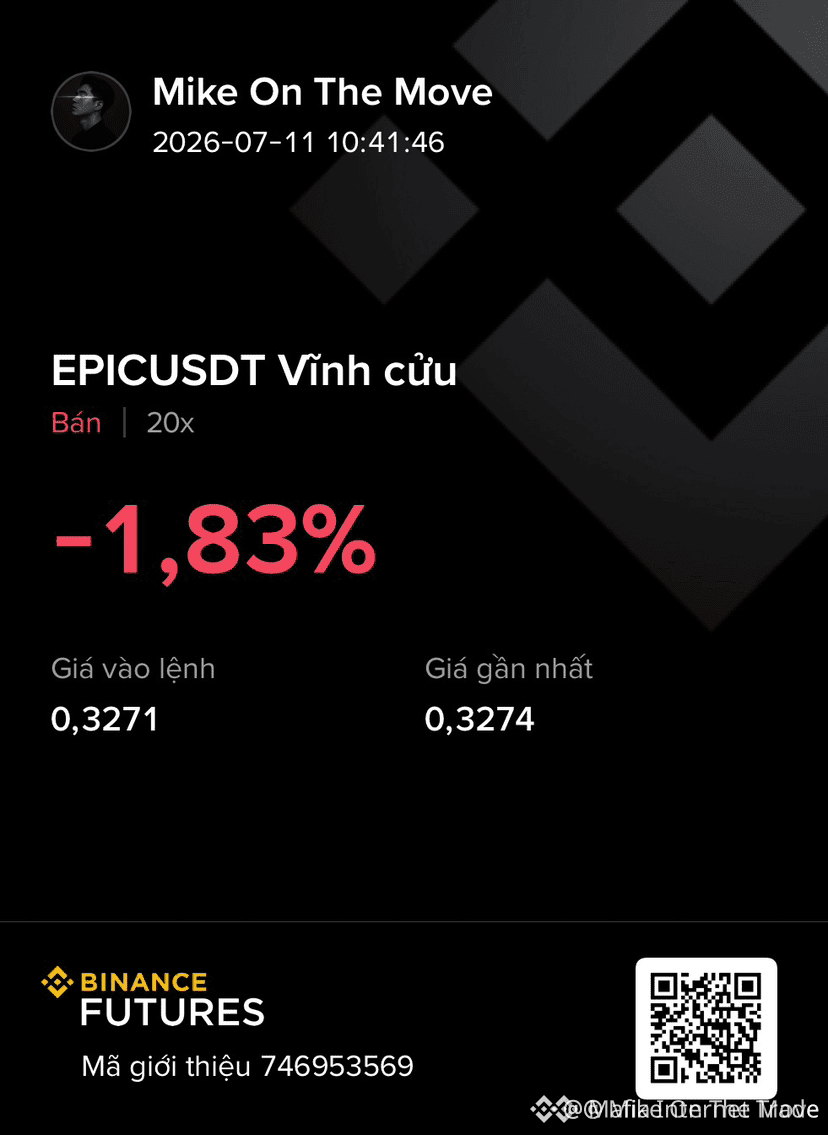
$EPIC IS LOSING UPSIDE MOMENTUM – SHORT SETUP ACTIVE ⚠️
Entry: 0.323 - 0.331 🔥
Target: 0.311 🚀
Stop Loss: 0.355 ⚠️
Price is returning to the exact supply zone where the last selloff originated. This area is stacked with unfilled sell orders from the impulsive breakdown last week. Buyers have pushed back but they can't establish acceptance above 0.331 — that tells me the structure is still vulnerable.
Volume on the bounce has been declining while short-term momentum is stalling. If we see a rejection here, the path of least resistance points straight down toward the 0.296 liquidity pool. Are you pressing the short or waiting for a clean rejection candle?
Not financial advice. Always manage your risk.
#EPIC #ShortSetup #SupplyZone #CryptoBearish
⚡
$EPIC IS LOSING UPSIDE MOMENTUM – SHORT SETUP ACTIVE ⚠️
Entry: 0.323 - 0.331 🔥
Target: 0.311 🚀
Stop Loss: 0.355 ⚠️
Price is returning to the exact supply zone where the last selloff originated. This area is stacked with unfilled sell orders from the impulsive breakdown last week. Buyers have pushed back but they can't establish acceptance above 0.331 — that tells me the structure is still vulnerable.
Volume on the bounce has been declining while short-term momentum is stalling. If we see a rejection here, the path of least resistance points straight down toward the 0.296 liquidity pool. Are you pressing the short or waiting for a clean rejection candle?
Not financial advice. Always manage your risk.
#EPIC #ShortSetup #SupplyZone #CryptoBearish
⚡
Entry: 0.323 - 0.331 🔥
Target: 0.311 🚀
Stop Loss: 0.355 ⚠️
Price is returning to the exact supply zone where the last selloff originated. This area is stacked with unfilled sell orders from the impulsive breakdown last week. Buyers have pushed back but they can't establish acceptance above 0.331 — that tells me the structure is still vulnerable.
Volume on the bounce has been declining while short-term momentum is stalling. If we see a rejection here, the path of least resistance points straight down toward the 0.296 liquidity pool. Are you pressing the short or waiting for a clean rejection candle?
Not financial advice. Always manage your risk.
#EPIC #ShortSetup #SupplyZone #CryptoBearish
⚡
121

·
--
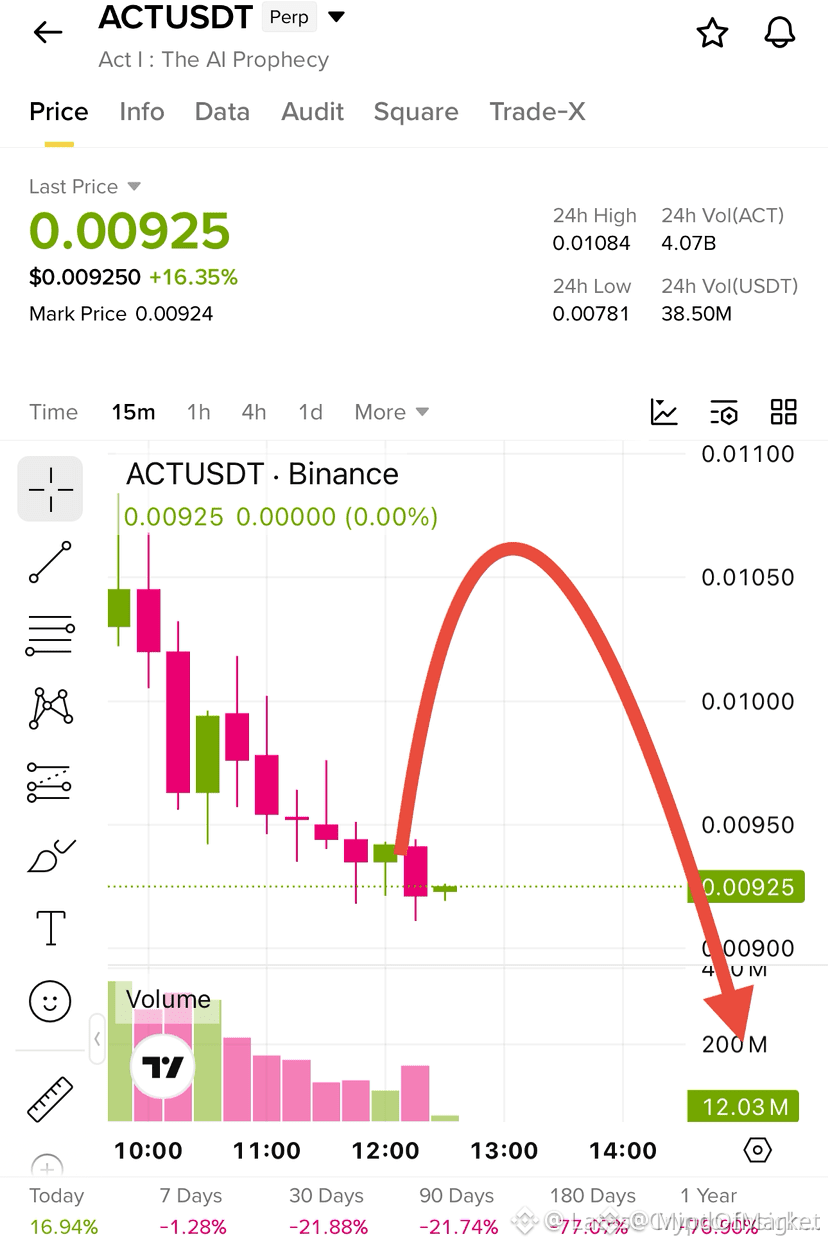
$ACT BEARS ARE IN CONTROL — RESISTANCE IS HOLDING STRONG 🔥
Entry: 0.00923 - 0.00951 🔥
Target: 0.00887 🚀
Stop Loss: 0.0102 ⚠️
Price has rejected the 0.0096 zone twice on the 1H, leaving a clear liquidity pool above. Volume is declining on each retest, signaling absorption. The daily structure shows lower highs since the August peak — this break below 0.0095 could accelerate into the next demand zone at 0.00887.
The risk-to-reward on this setup favors the short side by nearly 2:1 on the first leg. Are you fading this resistance or waiting for a sweep of the 0.01 level first?
Not financial advice. Always manage your risk.
#ACT #ShortSetup #Resistance #CryptoBearish
🔥
$ACT BEARS ARE IN CONTROL — RESISTANCE IS HOLDING STRONG 🔥
Entry: 0.00923 - 0.00951 🔥
Target: 0.00887 🚀
Stop Loss: 0.0102 ⚠️
Price has rejected the 0.0096 zone twice on the 1H, leaving a clear liquidity pool above. Volume is declining on each retest, signaling absorption. The daily structure shows lower highs since the August peak — this break below 0.0095 could accelerate into the next demand zone at 0.00887.
The risk-to-reward on this setup favors the short side by nearly 2:1 on the first leg. Are you fading this resistance or waiting for a sweep of the 0.01 level first?
Not financial advice. Always manage your risk.
#ACT #ShortSetup #Resistance #CryptoBearish
🔥
Entry: 0.00923 - 0.00951 🔥
Target: 0.00887 🚀
Stop Loss: 0.0102 ⚠️
Price has rejected the 0.0096 zone twice on the 1H, leaving a clear liquidity pool above. Volume is declining on each retest, signaling absorption. The daily structure shows lower highs since the August peak — this break below 0.0095 could accelerate into the next demand zone at 0.00887.
The risk-to-reward on this setup favors the short side by nearly 2:1 on the first leg. Are you fading this resistance or waiting for a sweep of the 0.01 level first?
Not financial advice. Always manage your risk.
#ACT #ShortSetup #Resistance #CryptoBearish
🔥
63

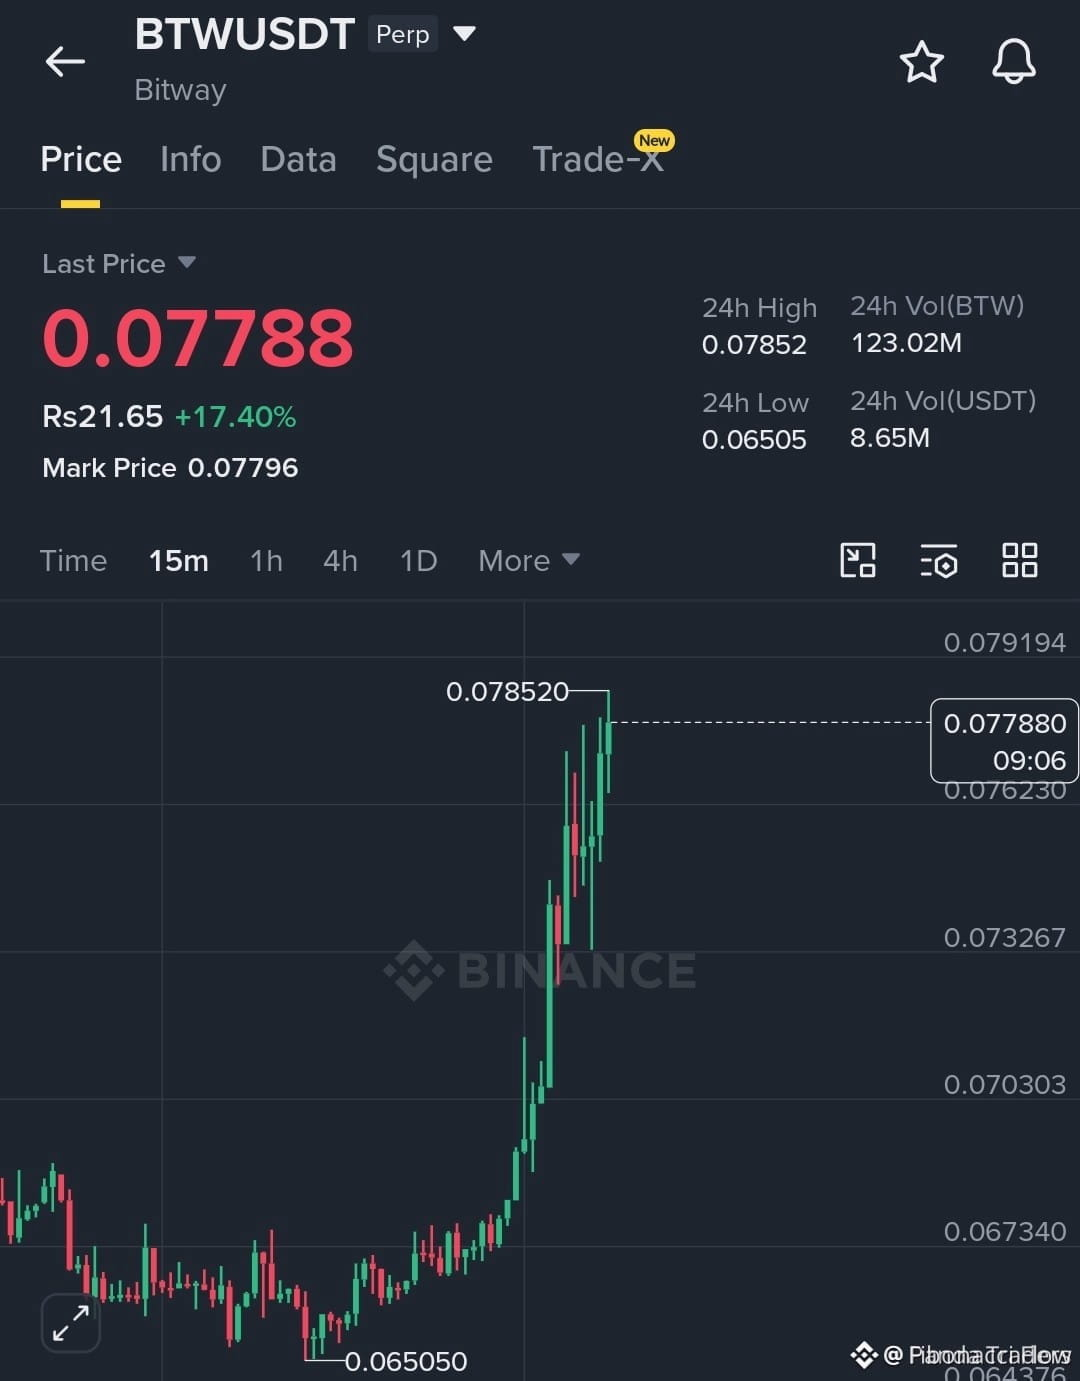
$BTW DENSELY CROWDED — SWING SHORT WINDOW WIDE OPEN! 🔴💣
Entry: 0.0780–0.0815 (scale in) ⚡
Target 1: 0.0730 🚀
Target 2: 0.0695 🚀
Target 3: 0.0655 🚀
Stop Loss: 0.09100 ⚠️
📉 Retail euphoria is hitting extreme levels on this memecoin — the same setup that’s triggered 20%+ slides in past cycles. Order flow shows heavy sell-side liquidity clustered below 0.0730, with shorts piling into a crowded long zone above 0.085. 📊 Cumulative volume delta is already flipping negative on the 1H, and the RSI on daily is rejecting 70 zone hard. 💡 I’m scaling entries across this overbought exhaustion zone to capture the mean reversion cascade. Risk-to-reward tight with stop above recent swing high. 💬 Are you fading this FOMO with me or waiting for a deeper liquidity grab before pulling the trigger? 👇
⚠️ Not financial advice. Always manage your risk. 🛡️
🏷️ #BTW #ShortSetup #SwingTrade #CryptoBearish
🔴💣
$BTW DENSELY CROWDED — SWING SHORT WINDOW WIDE OPEN! 🔴💣
Entry: 0.0780–0.0815 (scale in) ⚡
Target 1: 0.0730 🚀
Target 2: 0.0695 🚀
Target 3: 0.0655 🚀
Stop Loss: 0.09100 ⚠️
📉 Retail euphoria is hitting extreme levels on this memecoin — the same setup that’s triggered 20%+ slides in past cycles. Order flow shows heavy sell-side liquidity clustered below 0.0730, with shorts piling into a crowded long zone above 0.085. 📊 Cumulative volume delta is already flipping negative on the 1H, and the RSI on daily is rejecting 70 zone hard. 💡 I’m scaling entries across this overbought exhaustion zone to capture the mean reversion cascade. Risk-to-reward tight with stop above recent swing high. 💬 Are you fading this FOMO with me or waiting for a deeper liquidity grab before pulling the trigger? 👇
⚠️ Not financial advice. Always manage your risk. 🛡️
🏷️ #BTW #ShortSetup #SwingTrade #CryptoBearish
🔴💣
Entry: 0.0780–0.0815 (scale in) ⚡
Target 1: 0.0730 🚀
Target 2: 0.0695 🚀
Target 3: 0.0655 🚀
Stop Loss: 0.09100 ⚠️
📉 Retail euphoria is hitting extreme levels on this memecoin — the same setup that’s triggered 20%+ slides in past cycles. Order flow shows heavy sell-side liquidity clustered below 0.0730, with shorts piling into a crowded long zone above 0.085. 📊 Cumulative volume delta is already flipping negative on the 1H, and the RSI on daily is rejecting 70 zone hard. 💡 I’m scaling entries across this overbought exhaustion zone to capture the mean reversion cascade. Risk-to-reward tight with stop above recent swing high. 💬 Are you fading this FOMO with me or waiting for a deeper liquidity grab before pulling the trigger? 👇
⚠️ Not financial advice. Always manage your risk. 🛡️
🏷️ #BTW #ShortSetup #SwingTrade #CryptoBearish
🔴💣
105

·
--
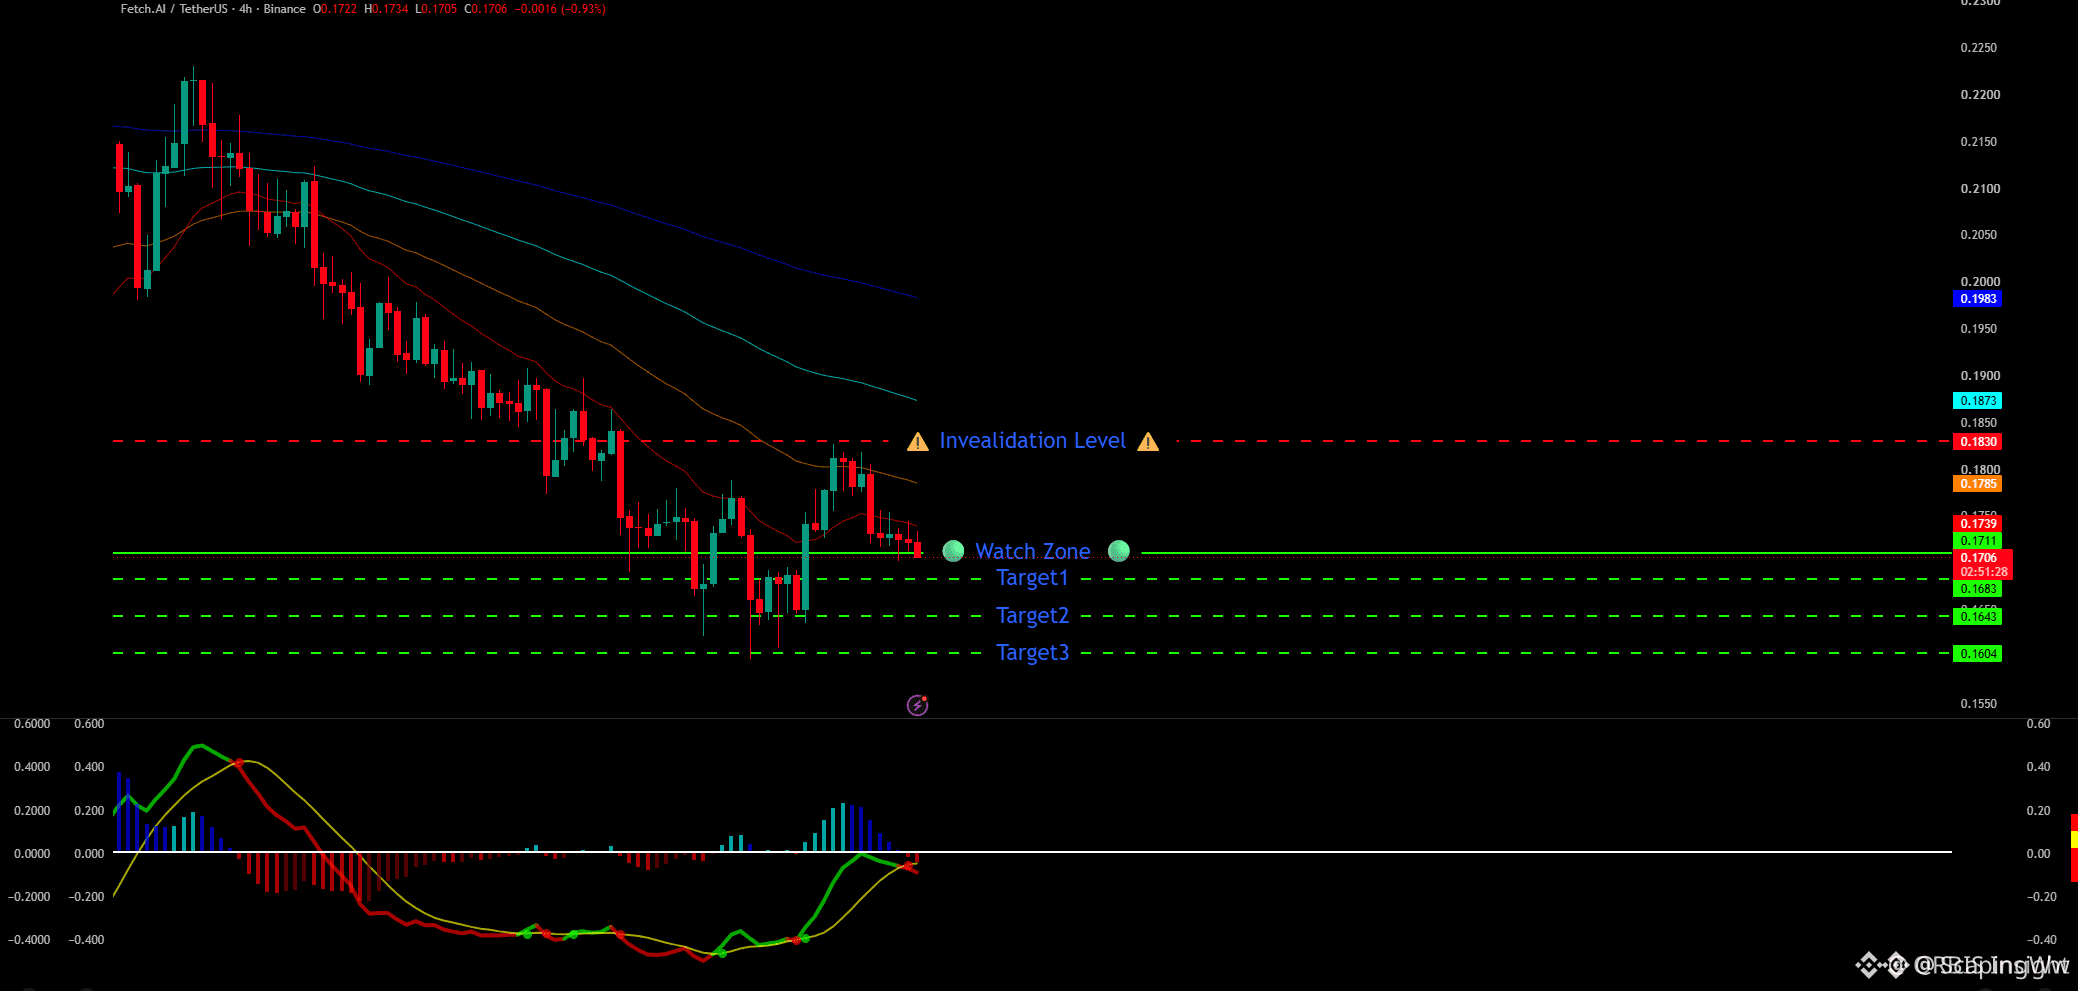
$FET IS MAKING LOWER HIGHS – SHORT SETUP IS LOADED 🔥
Entry: 0.1706 🔥
Target: 0.1683 / 0.1643 / 0.1604 🚀
Stop Loss: 0.1830 ⚠️
Each rally since the last dump has printed a lower high — textbook distribution pattern. Volume is declining on bounces while sellers keep stacking bids below support. The structure screams that whales are trapping late longs, and once 0.1706 cracks, the next drop should hit hard.
Risk is tight at 0.1830, giving a solid 1:3+ reward on the first target alone. Are you shorting at the current level or waiting for a retest of the breakdown?
Not financial advice. Always manage your risk.
#FET #ShortSetup #Breakdown #CryptoBearish
⚡
$FET IS MAKING LOWER HIGHS – SHORT SETUP IS LOADED 🔥
Entry: 0.1706 🔥
Target: 0.1683 / 0.1643 / 0.1604 🚀
Stop Loss: 0.1830 ⚠️
Each rally since the last dump has printed a lower high — textbook distribution pattern. Volume is declining on bounces while sellers keep stacking bids below support. The structure screams that whales are trapping late longs, and once 0.1706 cracks, the next drop should hit hard.
Risk is tight at 0.1830, giving a solid 1:3+ reward on the first target alone. Are you shorting at the current level or waiting for a retest of the breakdown?
Not financial advice. Always manage your risk.
#FET #ShortSetup #Breakdown #CryptoBearish
⚡
Entry: 0.1706 🔥
Target: 0.1683 / 0.1643 / 0.1604 🚀
Stop Loss: 0.1830 ⚠️
Each rally since the last dump has printed a lower high — textbook distribution pattern. Volume is declining on bounces while sellers keep stacking bids below support. The structure screams that whales are trapping late longs, and once 0.1706 cracks, the next drop should hit hard.
Risk is tight at 0.1830, giving a solid 1:3+ reward on the first target alone. Are you shorting at the current level or waiting for a retest of the breakdown?
Not financial advice. Always manage your risk.
#FET #ShortSetup #Breakdown #CryptoBearish
⚡
98

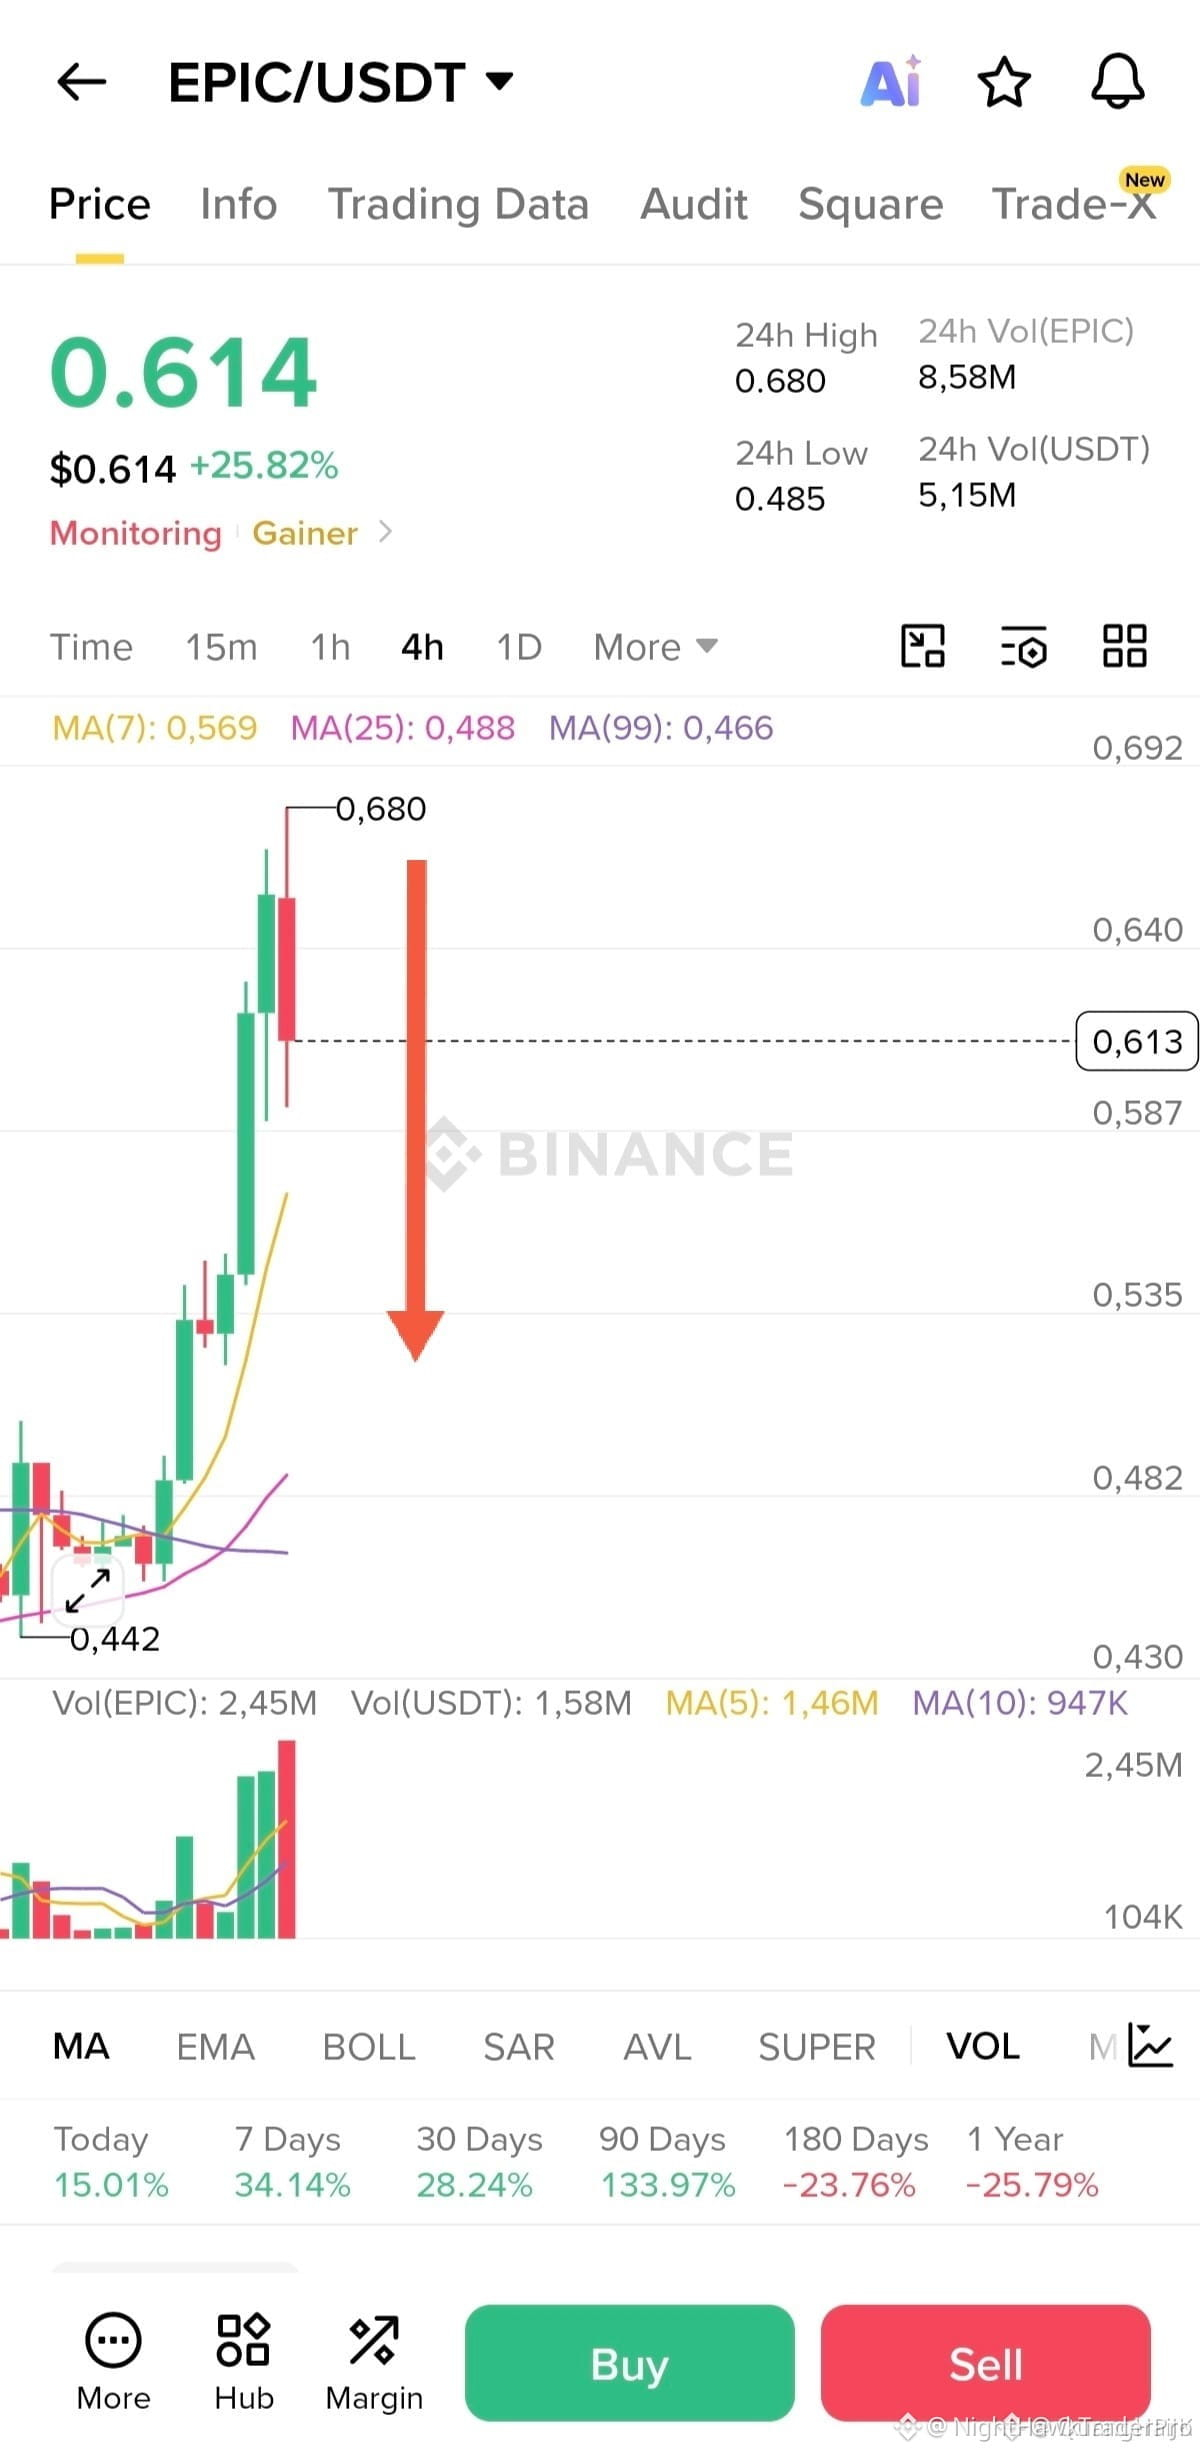
$EPIC SHORT SETUP WITH CLEAR TARGETS AND TIGHT STOP 🔥
Entry: 0.6388 - 0.7244 🔥
Target: 0.6088 🚀
Stop Loss: 0.7566 ⚠️
The entry zone here is a critical resistance cluster that has rejected price twice this week. Targeting the first support at 0.6088, with further upside potential to 0.5266 and 0.3862 if momentum continues. Stop loss just above the recent swing high at 0.7566 keeps the risk defined.
The R:R on the first target alone is nearly 2:1. Are you taking the short here or waiting for a better entry?
Not financial advice. Always manage your risk.
#EPIC #ShortSetup #CryptoBearish #Trading
🎯
$EPIC SHORT SETUP WITH CLEAR TARGETS AND TIGHT STOP 🔥
Entry: 0.6388 - 0.7244 🔥
Target: 0.6088 🚀
Stop Loss: 0.7566 ⚠️
The entry zone here is a critical resistance cluster that has rejected price twice this week. Targeting the first support at 0.6088, with further upside potential to 0.5266 and 0.3862 if momentum continues. Stop loss just above the recent swing high at 0.7566 keeps the risk defined.
The R:R on the first target alone is nearly 2:1. Are you taking the short here or waiting for a better entry?
Not financial advice. Always manage your risk.
#EPIC #ShortSetup #CryptoBearish #Trading
🎯
Entry: 0.6388 - 0.7244 🔥
Target: 0.6088 🚀
Stop Loss: 0.7566 ⚠️
The entry zone here is a critical resistance cluster that has rejected price twice this week. Targeting the first support at 0.6088, with further upside potential to 0.5266 and 0.3862 if momentum continues. Stop loss just above the recent swing high at 0.7566 keeps the risk defined.
The R:R on the first target alone is nearly 2:1. Are you taking the short here or waiting for a better entry?
Not financial advice. Always manage your risk.
#EPIC #ShortSetup #CryptoBearish #Trading
🎯
111

·
--
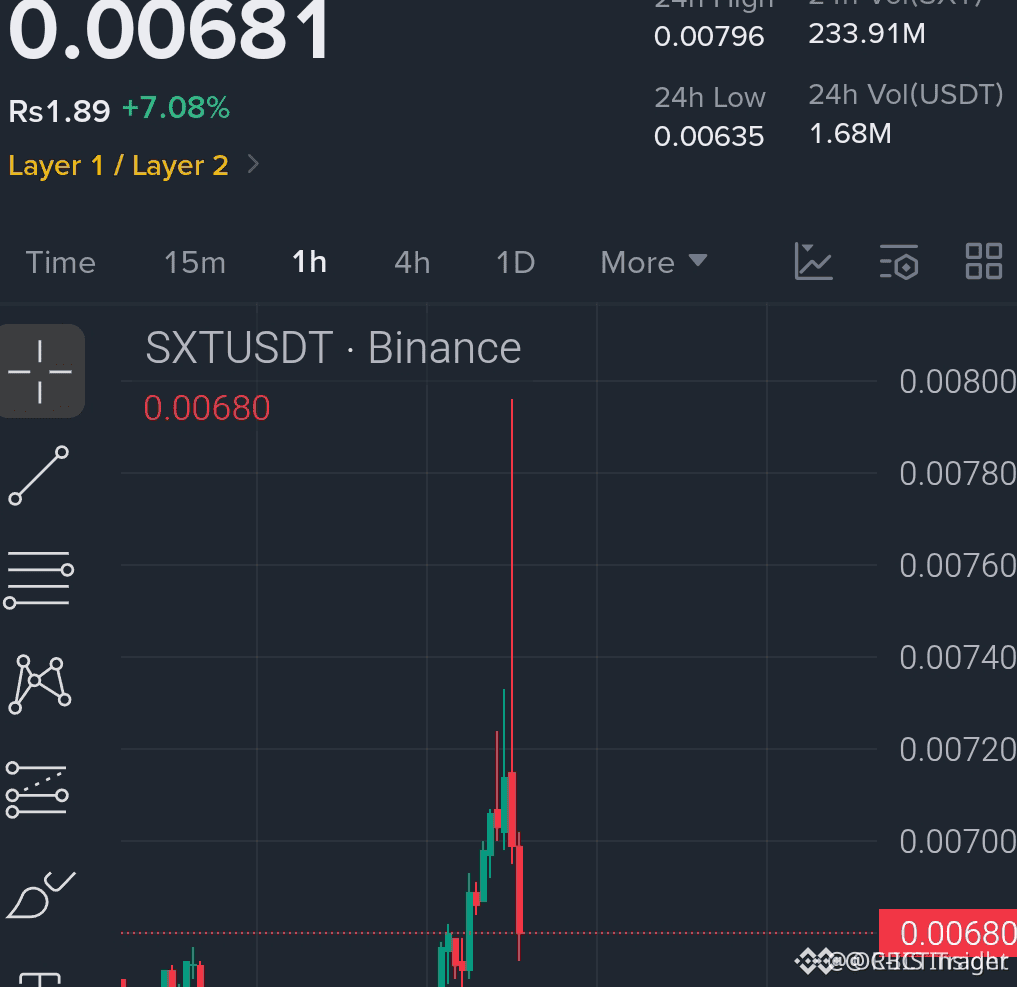
$SXT SHORT SETUP FORMING AS LIQUIDITY SITS ABOVE RESISTANCE 🔥
Entry: $0.00675 🔥
Target: $0.00650 🚀
Stop Loss: $0.00725 ⚠️
Price is rejecting from the $0.0069 resistance zone with a clear sweep of liquidity above. Volume declining on each push higher — a textbook exhaustion pattern that often precedes a sharp downside move. The structure suggests sellers are absorbing the buys.
Are you comfortable shorting into this structure or waiting for a retest?
Not financial advice. Always manage your risk.
#SXT #ShortSetup #ResistanceReject #CryptoBearish
🔥
$SXT SHORT SETUP FORMING AS LIQUIDITY SITS ABOVE RESISTANCE 🔥
Entry: $0.00675 🔥
Target: $0.00650 🚀
Stop Loss: $0.00725 ⚠️
Price is rejecting from the $0.0069 resistance zone with a clear sweep of liquidity above. Volume declining on each push higher — a textbook exhaustion pattern that often precedes a sharp downside move. The structure suggests sellers are absorbing the buys.
Are you comfortable shorting into this structure or waiting for a retest?
Not financial advice. Always manage your risk.
#SXT #ShortSetup #ResistanceReject #CryptoBearish
🔥
Entry: $0.00675 🔥
Target: $0.00650 🚀
Stop Loss: $0.00725 ⚠️
Price is rejecting from the $0.0069 resistance zone with a clear sweep of liquidity above. Volume declining on each push higher — a textbook exhaustion pattern that often precedes a sharp downside move. The structure suggests sellers are absorbing the buys.
Are you comfortable shorting into this structure or waiting for a retest?
Not financial advice. Always manage your risk.
#SXT #ShortSetup #ResistanceReject #CryptoBearish
🔥
99

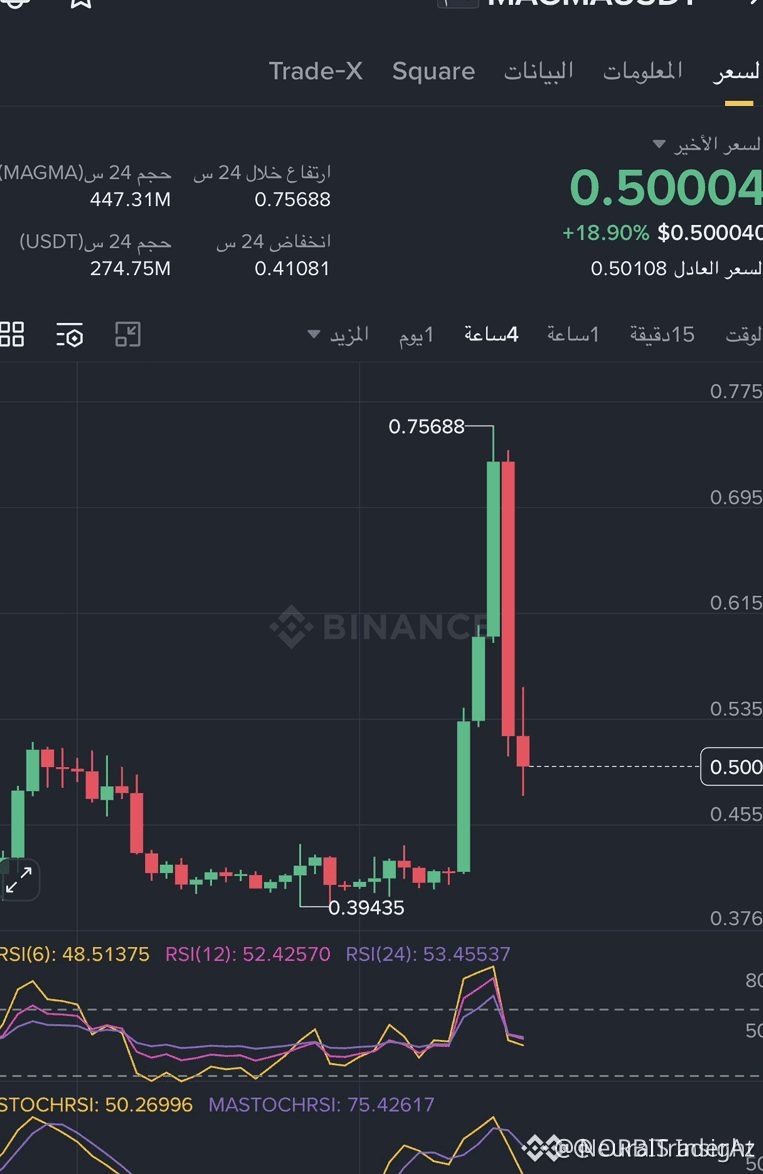
$MAGMA DAILY STRUCTURE COLLAPSES - 50% RED CANDLE CONFIRMS BEARISH DOMINANCE ⚡
A 50% daily red candle has swept through all lower timeframe support, and price has now broken down from every recent consolidation zone. The move from ATH represents a 90% drawdown, signaling that market makers have fully exited their long positions.
Volume spiked on this breakdown, and the daily RSI has dipped below 20 for the first time since listing — a classic sign of prolonged bearish momentum in a low-liquidity environment. Are shorts still viable at these levels or is a dead cat bounce the real risk here?
Not financial advice. Always manage your risk.
#MAGMA #ShortSetup #Breakdown #CryptoBearish
⚡
$MAGMA DAILY STRUCTURE COLLAPSES - 50% RED CANDLE CONFIRMS BEARISH DOMINANCE ⚡
A 50% daily red candle has swept through all lower timeframe support, and price has now broken down from every recent consolidation zone. The move from ATH represents a 90% drawdown, signaling that market makers have fully exited their long positions.
Volume spiked on this breakdown, and the daily RSI has dipped below 20 for the first time since listing — a classic sign of prolonged bearish momentum in a low-liquidity environment. Are shorts still viable at these levels or is a dead cat bounce the real risk here?
Not financial advice. Always manage your risk.
#MAGMA #ShortSetup #Breakdown #CryptoBearish
⚡
A 50% daily red candle has swept through all lower timeframe support, and price has now broken down from every recent consolidation zone. The move from ATH represents a 90% drawdown, signaling that market makers have fully exited their long positions.
Volume spiked on this breakdown, and the daily RSI has dipped below 20 for the first time since listing — a classic sign of prolonged bearish momentum in a low-liquidity environment. Are shorts still viable at these levels or is a dead cat bounce the real risk here?
Not financial advice. Always manage your risk.
#MAGMA #ShortSetup #Breakdown #CryptoBearish
⚡
137

·
--
බෙයාරිෂ්
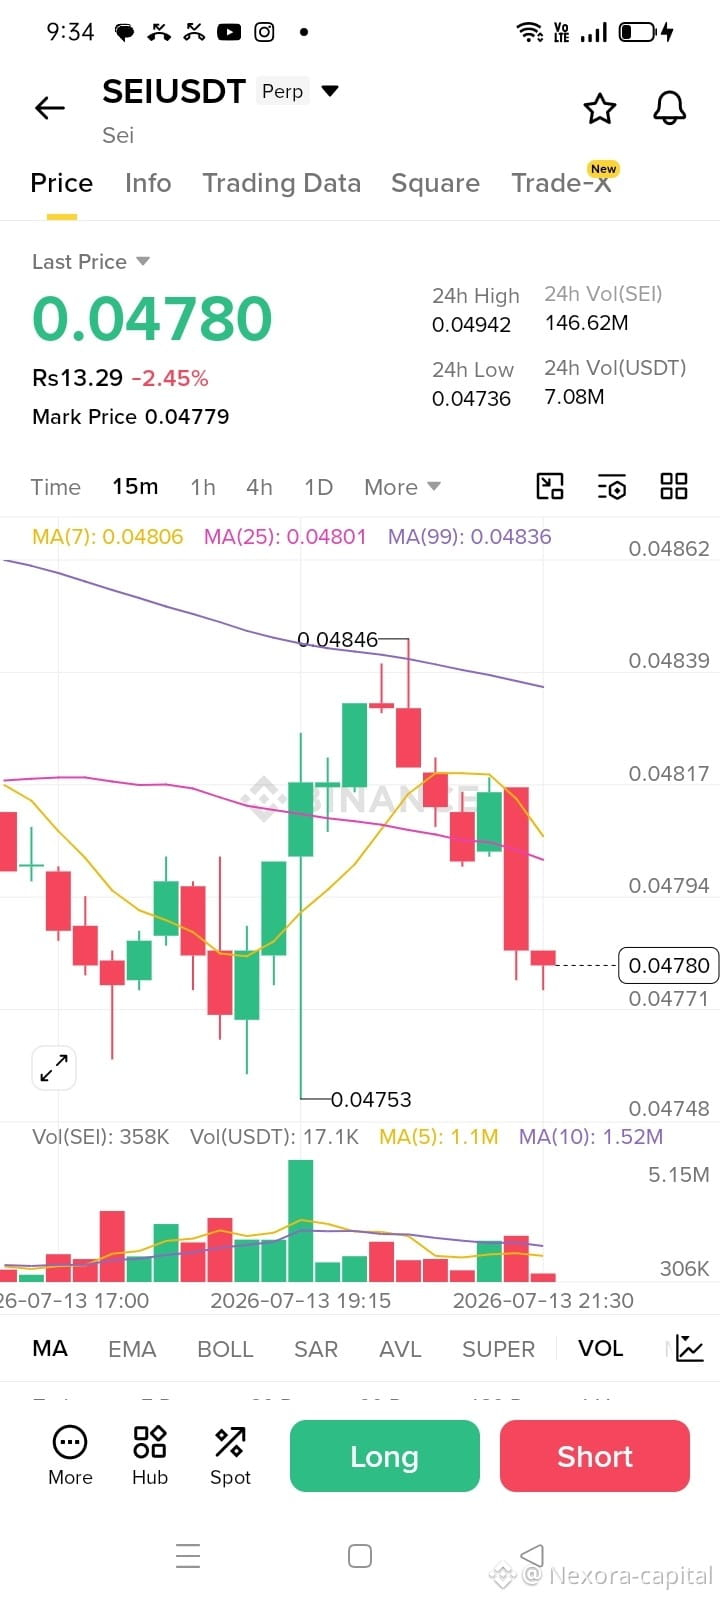
🚨 Insiders are dumping $SEI
{future}(SEIUSDT)
right now and retail traders are about to get completely trapped! 🚨
Direction: Short 📉
Entry zone: 0.04780 - 0.04810 🎯
TARGET'S 🎯
TP1: 0.04710
TP2: 0.04650
TP3: 0.04580
One stop loss: 0.04860 🛑
Add Leverage: 15x Cross ⚡
#SEI #CryptoTrading #CryptoBearish
🚨 Insiders are dumping $SEI
right now and retail traders are about to get completely trapped! 🚨
Direction: Short 📉
Entry zone: 0.04780 - 0.04810 🎯
TARGET'S 🎯
TP1: 0.04710
TP2: 0.04650
TP3: 0.04580
One stop loss: 0.04860 🛑
Add Leverage: 15x Cross ⚡
#SEI #CryptoTrading #CryptoBearish
right now and retail traders are about to get completely trapped! 🚨
Direction: Short 📉
Entry zone: 0.04780 - 0.04810 🎯
TARGET'S 🎯
TP1: 0.04710
TP2: 0.04650
TP3: 0.04580
One stop loss: 0.04860 🛑
Add Leverage: 15x Cross ⚡
#SEI #CryptoTrading #CryptoBearish
44

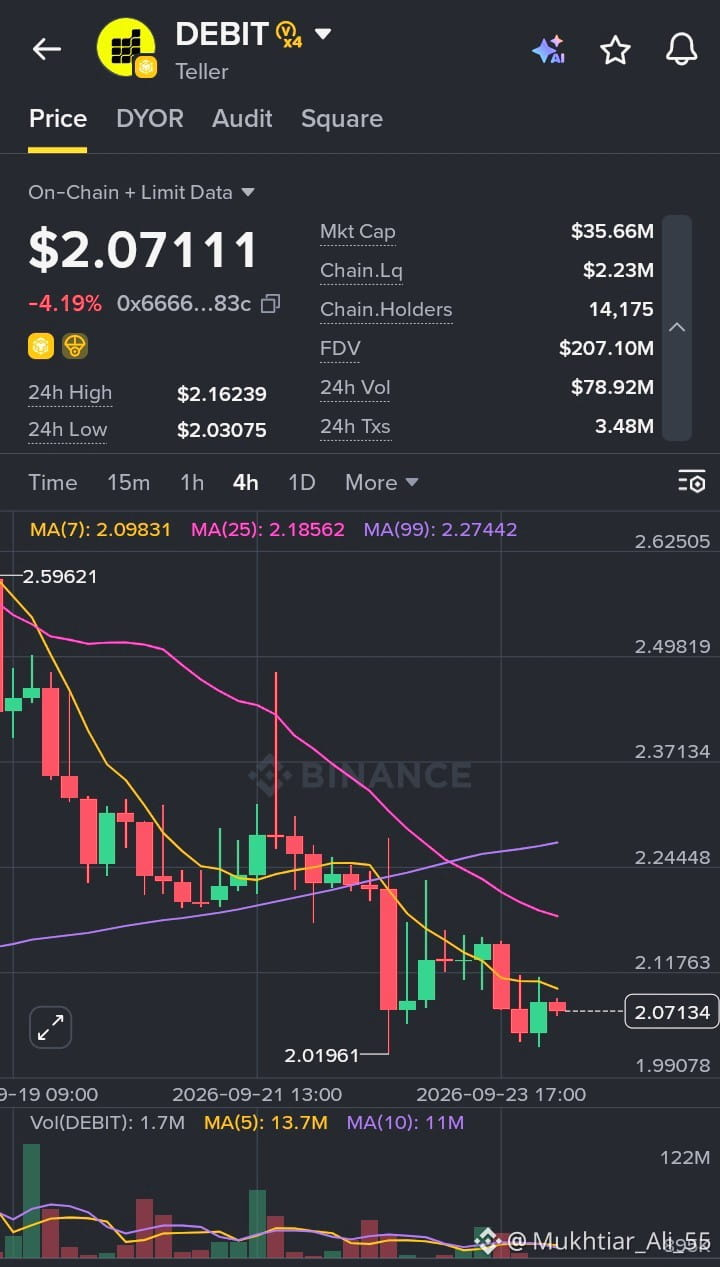
🚨 DEBIT ($DEBIT) UNDER PERSISTENT PRESSURE — WHAT THE CHART IS SHOWING 📉🔥
$DEBIT | DEBIT/USDT
💰 Price: 2.07111
📉 24H Change: -4.19%
📊 24H High: 2.16239
📉 24H Low: 2.03075
💵 24H Volume: $78.92M
⚠️ Market Breakdown (4H Timeframe):
Debit is continuing its downward drift following a major breakdown from the 2.59621 high zone 🧨
🔻 Price dropped steadily beneath short-term moving average resistance, forming a sequence of lower highs and lower lows
🔻 Dominant red candles reflect ongoing liquidation pressure and seller control
🔻 Lower wick near 2.01961 suggests brief demand absorbing initial selling near key support 🧲
📉 Moving Averages Tell the Story:
📌 MA(7): 2.09831
📌 MA(25): 2.18562
📌 MA(99): 2.27442
❌ Price is trading below all major MAs
❌ Clear bearish alignment (MA 7 < MA 25 < MA 99)
❌ Sellers remain fully in control 🐻
📊 Volume Insight:
🔴 Heavy sell volume backed the breakdown from higher consolidation levels
💥 Confirms institutional distribution and active position unwinding
⚠️ Volume has moderated near lower levels — expecting range consolidation before the next decisive move
🧠 What This Means:
This is a clear downtrend continuation with weak buying response on rebounds ❌
🔹 Short-term trend: Bearish
🔹 Momentum: Weak
🔹 Market emotion: Caution / Defensive 😨
🎯 Key Levels to Watch:
🟢 Support: 2.01000 – 2.03000 zone
🔴 Resistance: 2.09800 – 2.18500 zone
📌 A reclaim above 2.09800 (MA7) is required to stall immediate selling pressure
📌 Breakdown below 2.01961 could trigger further downward exploration
💡 Final Take:
🧨 DEBIT remains in a fragile, high-risk bearish trend
🧘 Avoid impulse buying against an active downtrend
🛡️ Risk management remains essential
Markets test discipline — act with precision 💎
#DEBIT #CryptoAnalysis #TradingSignals #CryptoBearish #Binance
$DEBIT
{alpha}(560x66661c7229901f568f16bd1551b3ba826f83ce49)
🚨 DEBIT ($DEBIT ) UNDER PERSISTENT PRESSURE — WHAT THE CHART IS SHOWING 📉🔥
$DEBIT | DEBIT/USDT
💰 Price: 2.07111
📉 24H Change: -4.19%
📊 24H High: 2.16239
📉 24H Low: 2.03075
💵 24H Volume: $78.92M
⚠️ Market Breakdown (4H Timeframe):
Debit is continuing its downward drift following a major breakdown from the 2.59621 high zone 🧨
🔻 Price dropped steadily beneath short-term moving average resistance, forming a sequence of lower highs and lower lows
🔻 Dominant red candles reflect ongoing liquidation pressure and seller control
🔻 Lower wick near 2.01961 suggests brief demand absorbing initial selling near key support 🧲
📉 Moving Averages Tell the Story:
📌 MA(7): 2.09831
📌 MA(25): 2.18562
📌 MA(99): 2.27442
❌ Price is trading below all major MAs
❌ Clear bearish alignment (MA 7 < MA 25 < MA 99)
❌ Sellers remain fully in control 🐻
📊 Volume Insight:
🔴 Heavy sell volume backed the breakdown from higher consolidation levels
💥 Confirms institutional distribution and active position unwinding
⚠️ Volume has moderated near lower levels — expecting range consolidation before the next decisive move
🧠 What This Means:
This is a clear downtrend continuation with weak buying response on rebounds ❌
🔹 Short-term trend: Bearish
🔹 Momentum: Weak
🔹 Market emotion: Caution / Defensive 😨
🎯 Key Levels to Watch:
🟢 Support: 2.01000 – 2.03000 zone
🔴 Resistance: 2.09800 – 2.18500 zone
📌 A reclaim above 2.09800 (MA7) is required to stall immediate selling pressure
📌 Breakdown below 2.01961 could trigger further downward exploration
💡 Final Take:
🧨 DEBIT remains in a fragile, high-risk bearish trend
🧘 Avoid impulse buying against an active downtrend
🛡️ Risk management remains essential
Markets test discipline — act with precision 💎
#DEBIT #CryptoAnalysis #TradingSignals #CryptoBearish #Binance
$DEBIT
$DEBIT | DEBIT/USDT
💰 Price: 2.07111
📉 24H Change: -4.19%
📊 24H High: 2.16239
📉 24H Low: 2.03075
💵 24H Volume: $78.92M
⚠️ Market Breakdown (4H Timeframe):
Debit is continuing its downward drift following a major breakdown from the 2.59621 high zone 🧨
🔻 Price dropped steadily beneath short-term moving average resistance, forming a sequence of lower highs and lower lows
🔻 Dominant red candles reflect ongoing liquidation pressure and seller control
🔻 Lower wick near 2.01961 suggests brief demand absorbing initial selling near key support 🧲
📉 Moving Averages Tell the Story:
📌 MA(7): 2.09831
📌 MA(25): 2.18562
📌 MA(99): 2.27442
❌ Price is trading below all major MAs
❌ Clear bearish alignment (MA 7 < MA 25 < MA 99)
❌ Sellers remain fully in control 🐻
📊 Volume Insight:
🔴 Heavy sell volume backed the breakdown from higher consolidation levels
💥 Confirms institutional distribution and active position unwinding
⚠️ Volume has moderated near lower levels — expecting range consolidation before the next decisive move
🧠 What This Means:
This is a clear downtrend continuation with weak buying response on rebounds ❌
🔹 Short-term trend: Bearish
🔹 Momentum: Weak
🔹 Market emotion: Caution / Defensive 😨
🎯 Key Levels to Watch:
🟢 Support: 2.01000 – 2.03000 zone
🔴 Resistance: 2.09800 – 2.18500 zone
📌 A reclaim above 2.09800 (MA7) is required to stall immediate selling pressure
📌 Breakdown below 2.01961 could trigger further downward exploration
💡 Final Take:
🧨 DEBIT remains in a fragile, high-risk bearish trend
🧘 Avoid impulse buying against an active downtrend
🛡️ Risk management remains essential
Markets test discipline — act with precision 💎
#DEBIT #CryptoAnalysis #TradingSignals #CryptoBearish #Binance
$DEBIT
147

{future}(VANRYUSDT)
🔻 BEARISH ALERT: Is $VANRY Losing Support? Short Setup Ahead! 📉
Market Fear is rising (Fear Index at 34) and $VANRY is breaking down from key levels! Sellers are taking control, and chart patterns show heavy downside pressure. 🚨
📍 Key Levels to Watch:
🎯 Target 1 (TP): $0.0050
🎯 Target 2 (TP): $0.0047
🛡️ Invalidation / Resistance: $0.0053
Are you shorting this dump or looking for a reversal bounce? Let us know below! 👇
#CryptoBearish #FootballSeason2026
🔔 Follow for daily high-accuracy crypto signals & market alerts! Don't miss the next move! 🚀🔥
🔻 BEARISH ALERT: Is $VANRY Losing Support? Short Setup Ahead! 📉
Market Fear is rising (Fear Index at 34) and $VANRY is breaking down from key levels! Sellers are taking control, and chart patterns show heavy downside pressure. 🚨
📍 Key Levels to Watch:
🎯 Target 1 (TP): $0.0050
🎯 Target 2 (TP): $0.0047
🛡️ Invalidation / Resistance: $0.0053
Are you shorting this dump or looking for a reversal bounce? Let us know below! 👇
#CryptoBearish #FootballSeason2026
🔔 Follow for daily high-accuracy crypto signals & market alerts! Don't miss the next move! 🚀🔥
Market Fear is rising (Fear Index at 34) and $VANRY is breaking down from key levels! Sellers are taking control, and chart patterns show heavy downside pressure. 🚨
📍 Key Levels to Watch:
🎯 Target 1 (TP): $0.0050
🎯 Target 2 (TP): $0.0047
🛡️ Invalidation / Resistance: $0.0053
Are you shorting this dump or looking for a reversal bounce? Let us know below! 👇
#CryptoBearish #FootballSeason2026
🔔 Follow for daily high-accuracy crypto signals & market alerts! Don't miss the next move! 🚀🔥
120

·
--
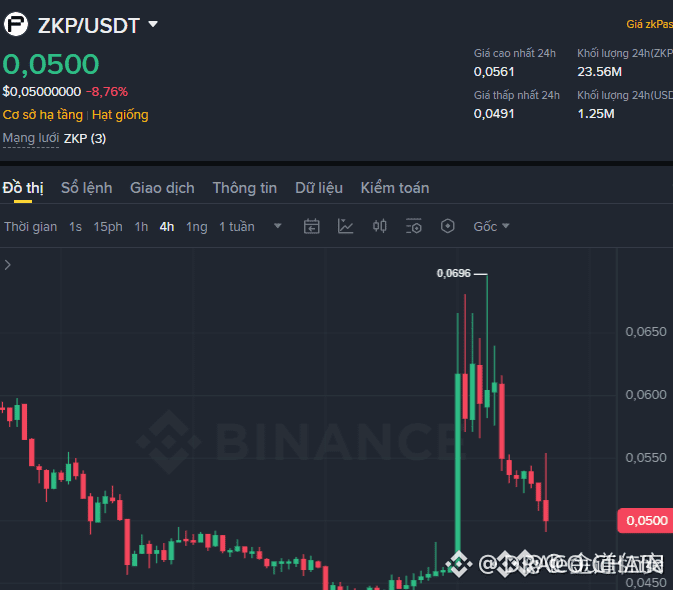
$ZKP BEARISH STRUCTURE HOLDS – SHORT THE RETRACE HERE 🔥
Entry: 0.04973 🔥
Target: 0.04562 🚀
Stop Loss: 0.05562 ⚠️
The 4H trend remains firmly bearish, and each bounce so far has been shallow with low volume. RSI on the 15M is oversold, which usually triggers a minor pullback — that is where you want to enter. Waiting for price to reach the 0.04973–0.05008 zone gives you a clean 1:3 risk-to-reward on the first target and room to trail deeper.
If this level breaks and sweeps liquidity, the next leg down could accelerate quickly. Are you shorting on the bounce or staying away?
Not financial advice. Always manage your risk.
#ZKP #ShortSetup #CryptoBearish #TradingSignal
🔥
$ZKP BEARISH STRUCTURE HOLDS – SHORT THE RETRACE HERE 🔥
Entry: 0.04973 🔥
Target: 0.04562 🚀
Stop Loss: 0.05562 ⚠️
The 4H trend remains firmly bearish, and each bounce so far has been shallow with low volume. RSI on the 15M is oversold, which usually triggers a minor pullback — that is where you want to enter. Waiting for price to reach the 0.04973–0.05008 zone gives you a clean 1:3 risk-to-reward on the first target and room to trail deeper.
If this level breaks and sweeps liquidity, the next leg down could accelerate quickly. Are you shorting on the bounce or staying away?
Not financial advice. Always manage your risk.
#ZKP #ShortSetup #CryptoBearish #TradingSignal
🔥
Entry: 0.04973 🔥
Target: 0.04562 🚀
Stop Loss: 0.05562 ⚠️
The 4H trend remains firmly bearish, and each bounce so far has been shallow with low volume. RSI on the 15M is oversold, which usually triggers a minor pullback — that is where you want to enter. Waiting for price to reach the 0.04973–0.05008 zone gives you a clean 1:3 risk-to-reward on the first target and room to trail deeper.
If this level breaks and sweeps liquidity, the next leg down could accelerate quickly. Are you shorting on the bounce or staying away?
Not financial advice. Always manage your risk.
#ZKP #ShortSetup #CryptoBearish #TradingSignal
🔥
74
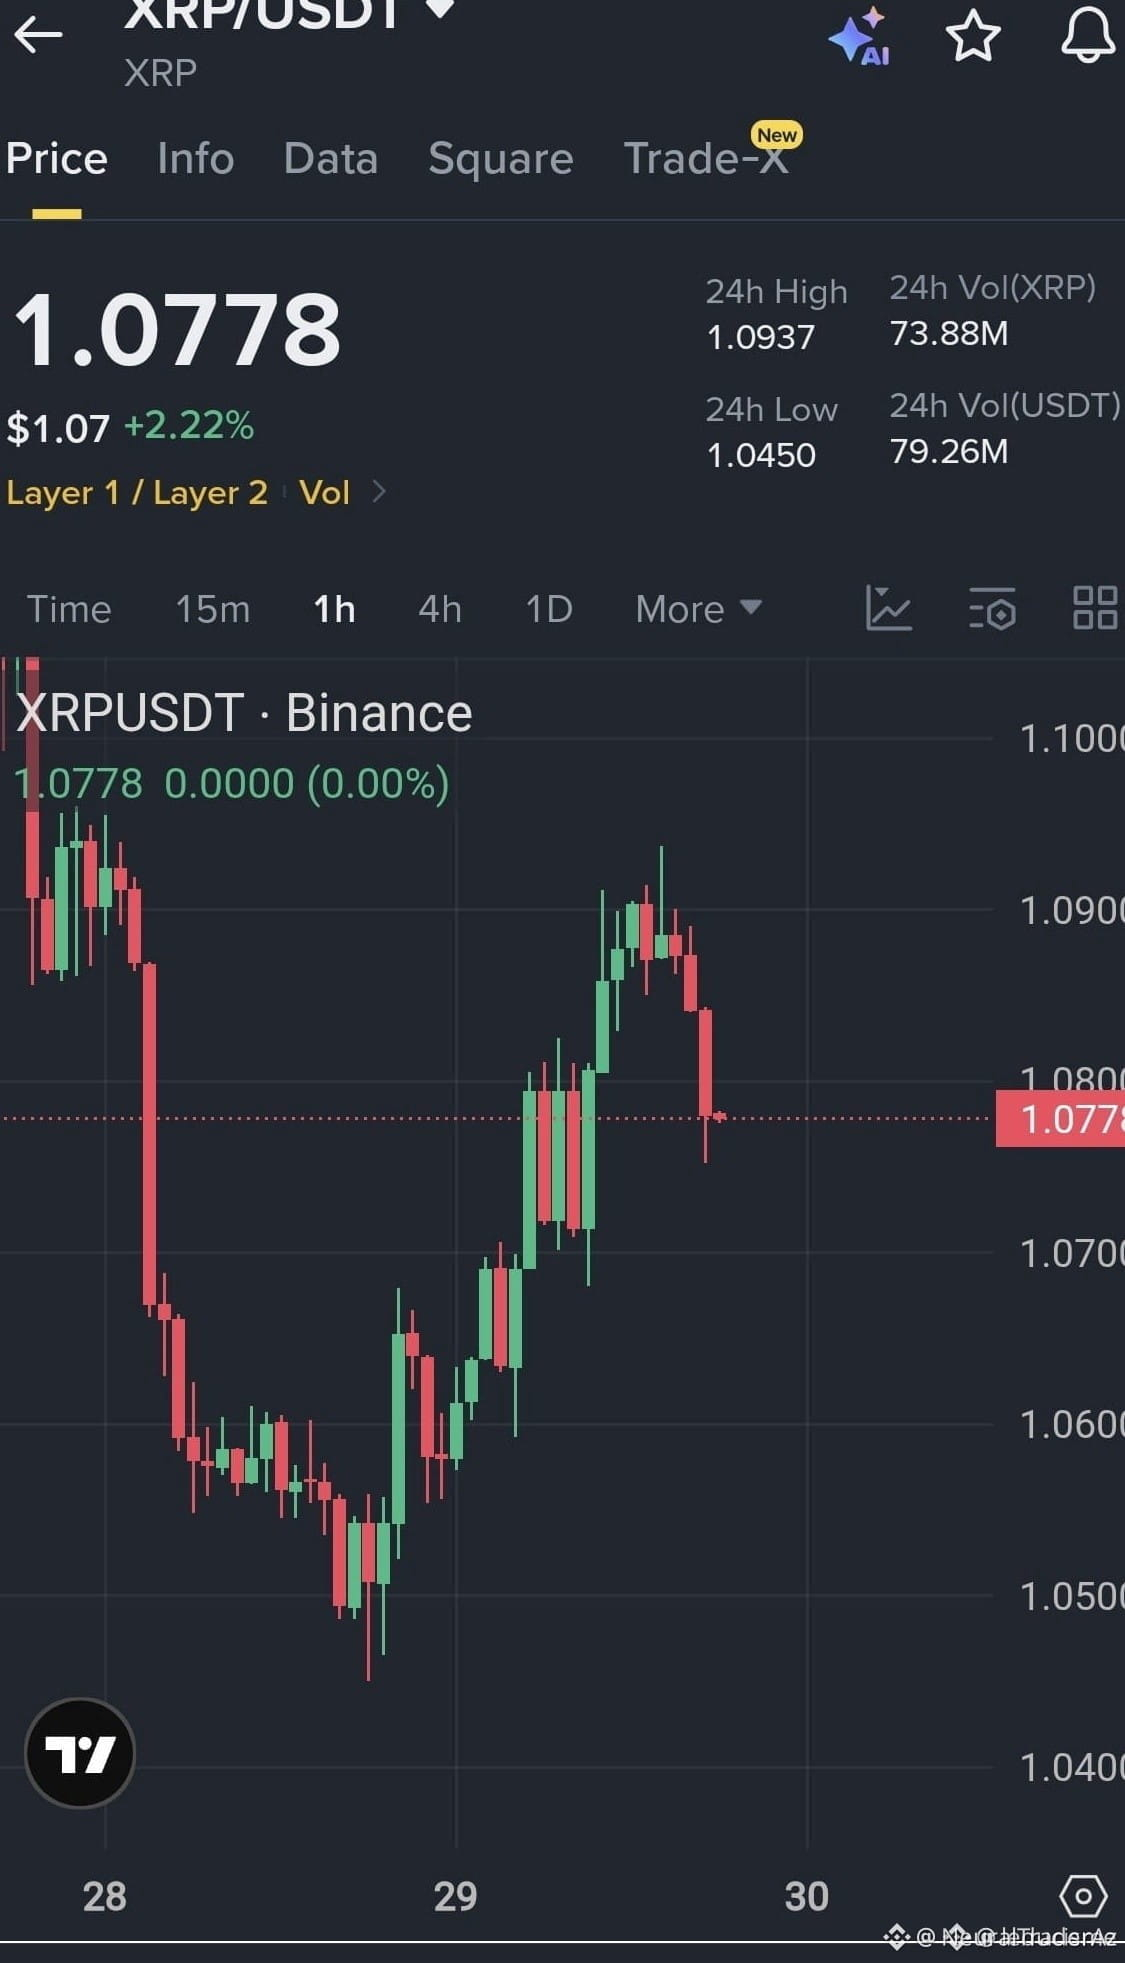
🔴 $XRP REJECTED AT 1.08 – SHORT PRESSURE MOUNTS! 📉
Entry: 1.0760 - 1.0800 ⚡
Targets: 1.0680 - 1.0600 - 1.0520 🎯
Stop Loss: 1.0895 ⚠️
📊 Price slammed into heavy supply at 1.08 – exactly where institutional sell orders were stacked. The immediate rejection on rising volume confirms smart money is distributing here. Lower timeframe structure has already flipped bearish.
🔍 This isn't a random short – each target sits at a key liquidity layer beneath current price. The path of least resistance points down as buyers lose momentum. Clean risk parameters make this a high-conviction setup for those who respect the structure.
💬 Are you jumping on this rejection or waiting for a retest of resistance? 👇
⚠️ Not financial advice. Always manage your risk. 🛡️
🏷️ #XRP #ShortSetup #CryptoBearish #ResistanceRejection
🐻 💣
🔴 $XRP REJECTED AT 1.08 – SHORT PRESSURE MOUNTS! 📉
Entry: 1.0760 - 1.0800 ⚡
Targets: 1.0680 - 1.0600 - 1.0520 🎯
Stop Loss: 1.0895 ⚠️
📊 Price slammed into heavy supply at 1.08 – exactly where institutional sell orders were stacked. The immediate rejection on rising volume confirms smart money is distributing here. Lower timeframe structure has already flipped bearish.
🔍 This isn't a random short – each target sits at a key liquidity layer beneath current price. The path of least resistance points down as buyers lose momentum. Clean risk parameters make this a high-conviction setup for those who respect the structure.
💬 Are you jumping on this rejection or waiting for a retest of resistance? 👇
⚠️ Not financial advice. Always manage your risk. 🛡️
🏷️ #XRP #ShortSetup #CryptoBearish #ResistanceRejection
🐻 💣
Entry: 1.0760 - 1.0800 ⚡
Targets: 1.0680 - 1.0600 - 1.0520 🎯
Stop Loss: 1.0895 ⚠️
📊 Price slammed into heavy supply at 1.08 – exactly where institutional sell orders were stacked. The immediate rejection on rising volume confirms smart money is distributing here. Lower timeframe structure has already flipped bearish.
🔍 This isn't a random short – each target sits at a key liquidity layer beneath current price. The path of least resistance points down as buyers lose momentum. Clean risk parameters make this a high-conviction setup for those who respect the structure.
💬 Are you jumping on this rejection or waiting for a retest of resistance? 👇
⚠️ Not financial advice. Always manage your risk. 🛡️
🏷️ #XRP #ShortSetup #CryptoBearish #ResistanceRejection
🐻 💣
39

·
--
උසබ තත්ත්වය
🚀 ONTOLOGY GAS (ONG/USDT) SHORT SETUP: The vertical parabolic expansion followed by a severe sell-off. The asset is printing massive red candles, dropping sharply from its 24-hour high of 0.26000 down towards 0.11850. Since it has lost major short-term exponential moving averages (EMA 7 and EMA 25), the momentum remains heavily bearish, opening up a potential short trade on any minor corrective relief bounce.
Entry Zone: 0.12500 – 0.13700 (Look for a short position on a minor pullback to retest broken structural EMAs)
TP 1: 0.10500
TP 2: 0.09320
TP 3: 0.06500
SL: 0.15500
#ONGUSDT #CryptoTrading #CryptoBearish #Binance
{future}(ONGUSDT)
🚀 ONTOLOGY GAS (ONG/USDT) SHORT SETUP: The vertical parabolic expansion followed by a severe sell-off. The asset is printing massive red candles, dropping sharply from its 24-hour high of 0.26000 down towards 0.11850. Since it has lost major short-term exponential moving averages (EMA 7 and EMA 25), the momentum remains heavily bearish, opening up a potential short trade on any minor corrective relief bounce.
Entry Zone: 0.12500 – 0.13700 (Look for a short position on a minor pullback to retest broken structural EMAs)
TP 1: 0.10500
TP 2: 0.09320
TP 3: 0.06500
SL: 0.15500
#ONGUSDT #CryptoTrading #CryptoBearish #Binance
Entry Zone: 0.12500 – 0.13700 (Look for a short position on a minor pullback to retest broken structural EMAs)
TP 1: 0.10500
TP 2: 0.09320
TP 3: 0.06500
SL: 0.15500
#ONGUSDT #CryptoTrading #CryptoBearish #Binance
1
302
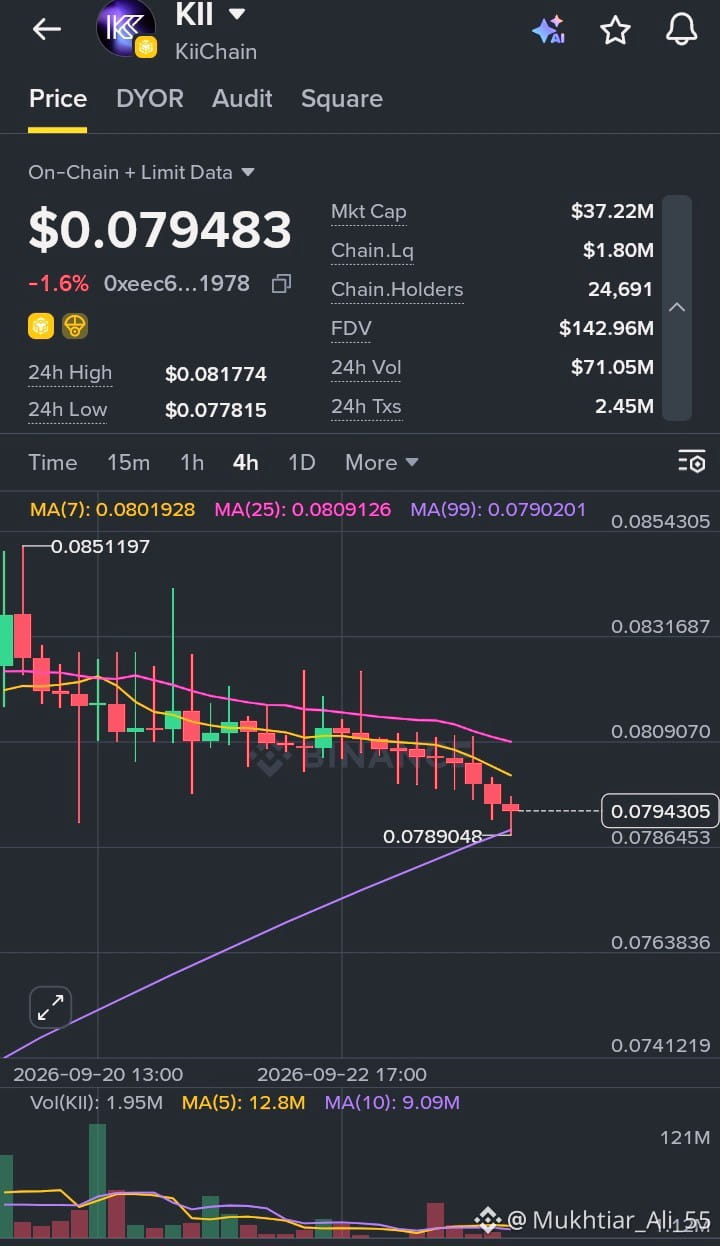
🚨 KII ($KII) UNDER PRESSURE — WHAT THE CHART IS REVEALING 📉🔥
$KII | KII/USDT
💰 Price: 0.079483
📉 24H Change: -1.6%
📊 24H High: 0.081774
📉 24H Low: 0.077815
💵 24H Volume: $71.05M
⚠️ Market Breakdown (4H Timeframe):
KiiChain is experiencing a slow bleed lower after rejecting off local highs around 0.0851197 🧨
🔻 Price continues to form lower highs and lower lows along a steady downward slope
🔻 Red candles dominate recent action, breaking below key support levels
🔻 A lower shadow near 0.0789048 indicates mild buying defense, but momentum remains weak 🧲
📉 Moving Averages Tell the Story:
📌 MA(7): 0.0801928
📌 MA(25): 0.0809126
📌 MA(99): 0.0790201
❌ Price has slipped below both MA(7) and MA(25)
❌ Testing support around the long-term MA(99)
❌ Short-term MAs are sloping downward, signaling active seller control 🐻
📊 Volume Insight:
🔴 Moderate sell volume accompanying the steady price drop
💥 Reflects ongoing distribution and a lack of strong aggressive demand
⚠️ Watch for volume reaction as price tests the major MA(99) support zone
🧠 What This Means:
This is a steady downtrend continuation testing critical moving average support ❌
🔹 Short-term trend: Bearish
🔹 Momentum: Weak
🔹 Market emotion: Caution / Indecision 😨
🎯 Key Levels to Watch:
🟢 Support: 0.07780 – 0.07900 zone (MA(99) & 24h low)
🔴 Resistance: 0.08020 – 0.08170 zone
📌 A reclaim above 0.08020 (MA7) is required to pause immediate bearish pressure
📌 Failure to defend 0.07890 could open downside toward 0.07630
💡 Final Take:
🧨 KII is in a defensive position testing key structural support
🧘 Avoid catching falling knives without confirmation
🛡️ Strict risk management remains essential
Markets reward discipline and strategy over emotion 💎
#KII #CryptoAnalysis #TradingSignals #CryptoBearish #Binance
$KII
{alpha}(560xeec6574eabba52bac3f0277f2cd5ac7e67197886)
🚨 KII ($KII ) UNDER PRESSURE — WHAT THE CHART IS REVEALING 📉🔥
$KII | KII/USDT
💰 Price: 0.079483
📉 24H Change: -1.6%
📊 24H High: 0.081774
📉 24H Low: 0.077815
💵 24H Volume: $71.05M
⚠️ Market Breakdown (4H Timeframe):
KiiChain is experiencing a slow bleed lower after rejecting off local highs around 0.0851197 🧨
🔻 Price continues to form lower highs and lower lows along a steady downward slope
🔻 Red candles dominate recent action, breaking below key support levels
🔻 A lower shadow near 0.0789048 indicates mild buying defense, but momentum remains weak 🧲
📉 Moving Averages Tell the Story:
📌 MA(7): 0.0801928
📌 MA(25): 0.0809126
📌 MA(99): 0.0790201
❌ Price has slipped below both MA(7) and MA(25)
❌ Testing support around the long-term MA(99)
❌ Short-term MAs are sloping downward, signaling active seller control 🐻
📊 Volume Insight:
🔴 Moderate sell volume accompanying the steady price drop
💥 Reflects ongoing distribution and a lack of strong aggressive demand
⚠️ Watch for volume reaction as price tests the major MA(99) support zone
🧠 What This Means:
This is a steady downtrend continuation testing critical moving average support ❌
🔹 Short-term trend: Bearish
🔹 Momentum: Weak
🔹 Market emotion: Caution / Indecision 😨
🎯 Key Levels to Watch:
🟢 Support: 0.07780 – 0.07900 zone (MA(99) & 24h low)
🔴 Resistance: 0.08020 – 0.08170 zone
📌 A reclaim above 0.08020 (MA7) is required to pause immediate bearish pressure
📌 Failure to defend 0.07890 could open downside toward 0.07630
💡 Final Take:
🧨 KII is in a defensive position testing key structural support
🧘 Avoid catching falling knives without confirmation
🛡️ Strict risk management remains essential
Markets reward discipline and strategy over emotion 💎
#KII #CryptoAnalysis #TradingSignals #CryptoBearish #Binance
$KII
$KII | KII/USDT
💰 Price: 0.079483
📉 24H Change: -1.6%
📊 24H High: 0.081774
📉 24H Low: 0.077815
💵 24H Volume: $71.05M
⚠️ Market Breakdown (4H Timeframe):
KiiChain is experiencing a slow bleed lower after rejecting off local highs around 0.0851197 🧨
🔻 Price continues to form lower highs and lower lows along a steady downward slope
🔻 Red candles dominate recent action, breaking below key support levels
🔻 A lower shadow near 0.0789048 indicates mild buying defense, but momentum remains weak 🧲
📉 Moving Averages Tell the Story:
📌 MA(7): 0.0801928
📌 MA(25): 0.0809126
📌 MA(99): 0.0790201
❌ Price has slipped below both MA(7) and MA(25)
❌ Testing support around the long-term MA(99)
❌ Short-term MAs are sloping downward, signaling active seller control 🐻
📊 Volume Insight:
🔴 Moderate sell volume accompanying the steady price drop
💥 Reflects ongoing distribution and a lack of strong aggressive demand
⚠️ Watch for volume reaction as price tests the major MA(99) support zone
🧠 What This Means:
This is a steady downtrend continuation testing critical moving average support ❌
🔹 Short-term trend: Bearish
🔹 Momentum: Weak
🔹 Market emotion: Caution / Indecision 😨
🎯 Key Levels to Watch:
🟢 Support: 0.07780 – 0.07900 zone (MA(99) & 24h low)
🔴 Resistance: 0.08020 – 0.08170 zone
📌 A reclaim above 0.08020 (MA7) is required to pause immediate bearish pressure
📌 Failure to defend 0.07890 could open downside toward 0.07630
💡 Final Take:
🧨 KII is in a defensive position testing key structural support
🧘 Avoid catching falling knives without confirmation
🛡️ Strict risk management remains essential
Markets reward discipline and strategy over emotion 💎
#KII #CryptoAnalysis #TradingSignals #CryptoBearish #Binance
$KII
1
42
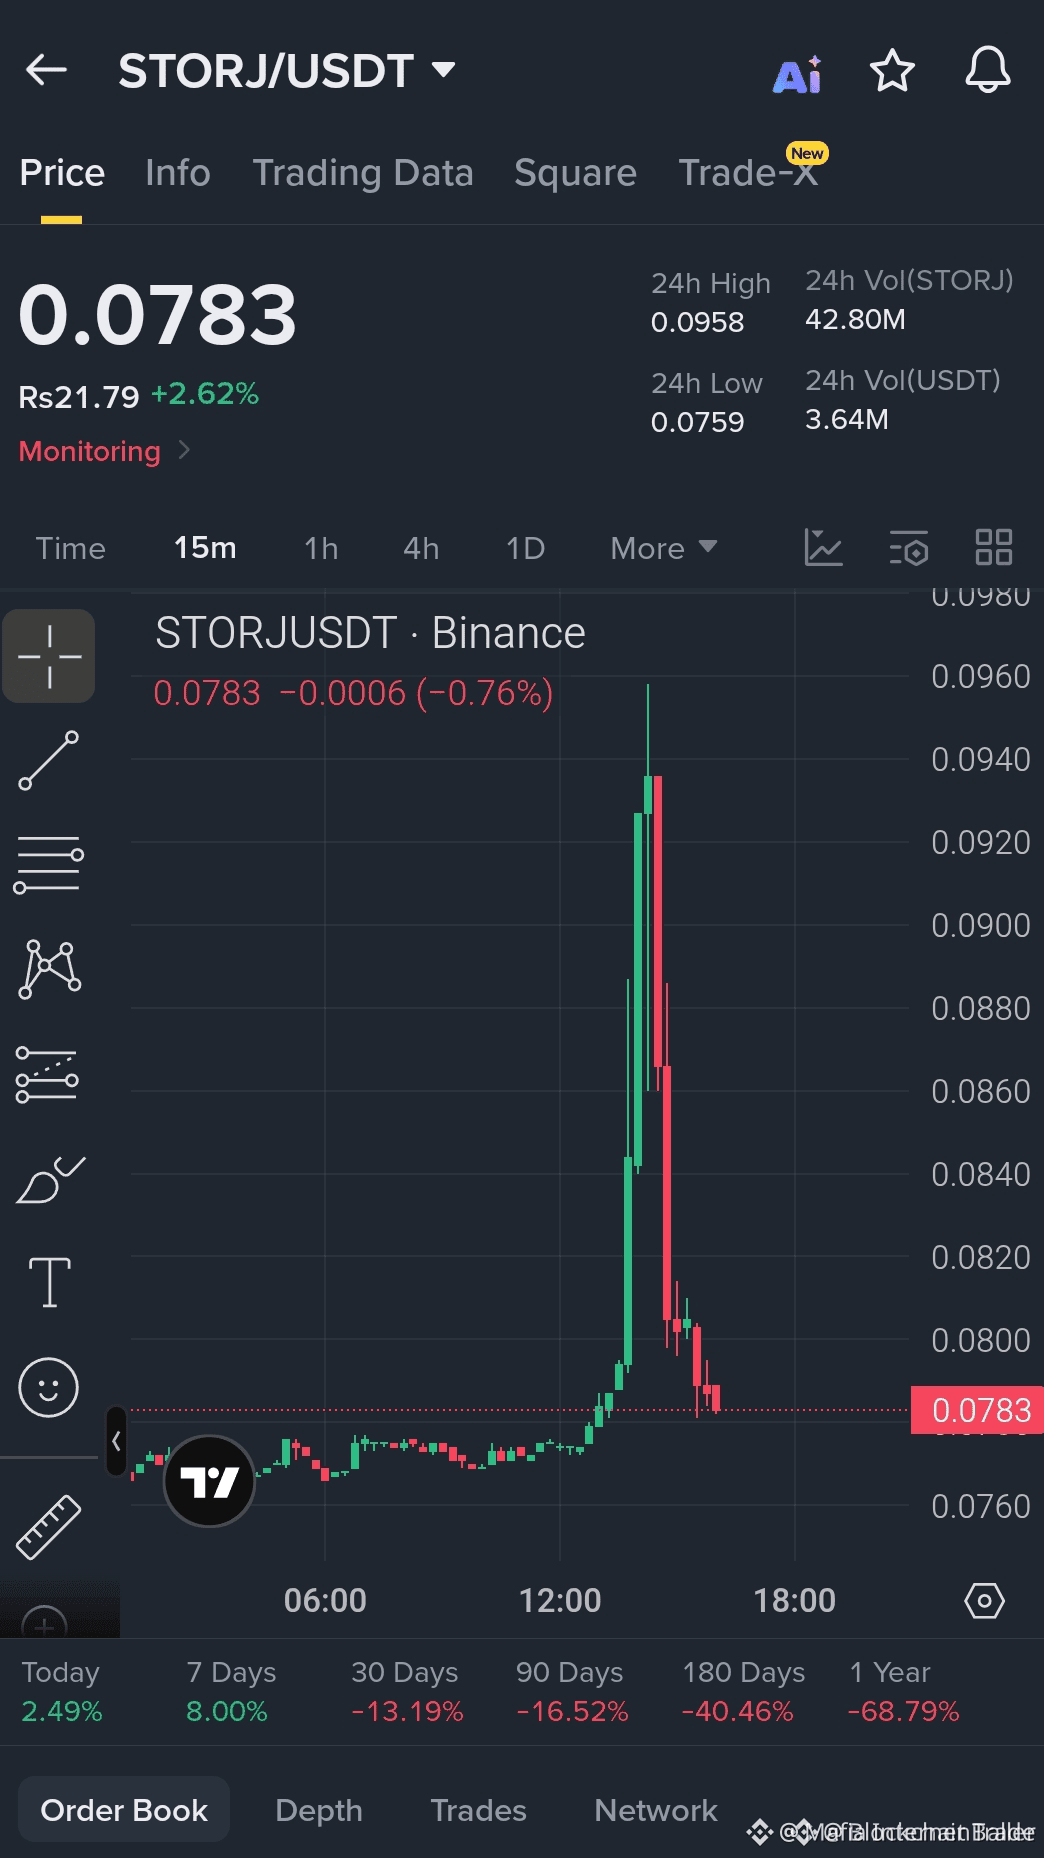
$STORJ SHORT SETUP WITH CLEAR TARGETS AND TIGHT RISK 🔥
Entry: $0.0780 - $0.0790 🔥
Target: $0.0750 / $0.0720 / $0.0680 🚀
Stop Loss: $0.0825 ⚠️
This short on STORJ is stacking targets from 0.0750 down to 0.0680 with a stop just above the 0.0825 resistance. The structure suggests sellers are in control and the entry zone offers a solid risk-to-reward — roughly 1:3 to the first target if you catch the top of the range.
Volume picked up on the last rejection and the daily trend still favors the downside. Are you shorting into this breakdown or waiting for a retest?
Not financial advice. Always manage your risk.
#STORJ #ShortSetup #CryptoBearish #TradingSignal
⚡
$STORJ SHORT SETUP WITH CLEAR TARGETS AND TIGHT RISK 🔥
Entry: $0.0780 - $0.0790 🔥
Target: $0.0750 / $0.0720 / $0.0680 🚀
Stop Loss: $0.0825 ⚠️
This short on STORJ is stacking targets from 0.0750 down to 0.0680 with a stop just above the 0.0825 resistance. The structure suggests sellers are in control and the entry zone offers a solid risk-to-reward — roughly 1:3 to the first target if you catch the top of the range.
Volume picked up on the last rejection and the daily trend still favors the downside. Are you shorting into this breakdown or waiting for a retest?
Not financial advice. Always manage your risk.
#STORJ #ShortSetup #CryptoBearish #TradingSignal
⚡
Entry: $0.0780 - $0.0790 🔥
Target: $0.0750 / $0.0720 / $0.0680 🚀
Stop Loss: $0.0825 ⚠️
This short on STORJ is stacking targets from 0.0750 down to 0.0680 with a stop just above the 0.0825 resistance. The structure suggests sellers are in control and the entry zone offers a solid risk-to-reward — roughly 1:3 to the first target if you catch the top of the range.
Volume picked up on the last rejection and the daily trend still favors the downside. Are you shorting into this breakdown or waiting for a retest?
Not financial advice. Always manage your risk.
#STORJ #ShortSetup #CryptoBearish #TradingSignal
⚡
115
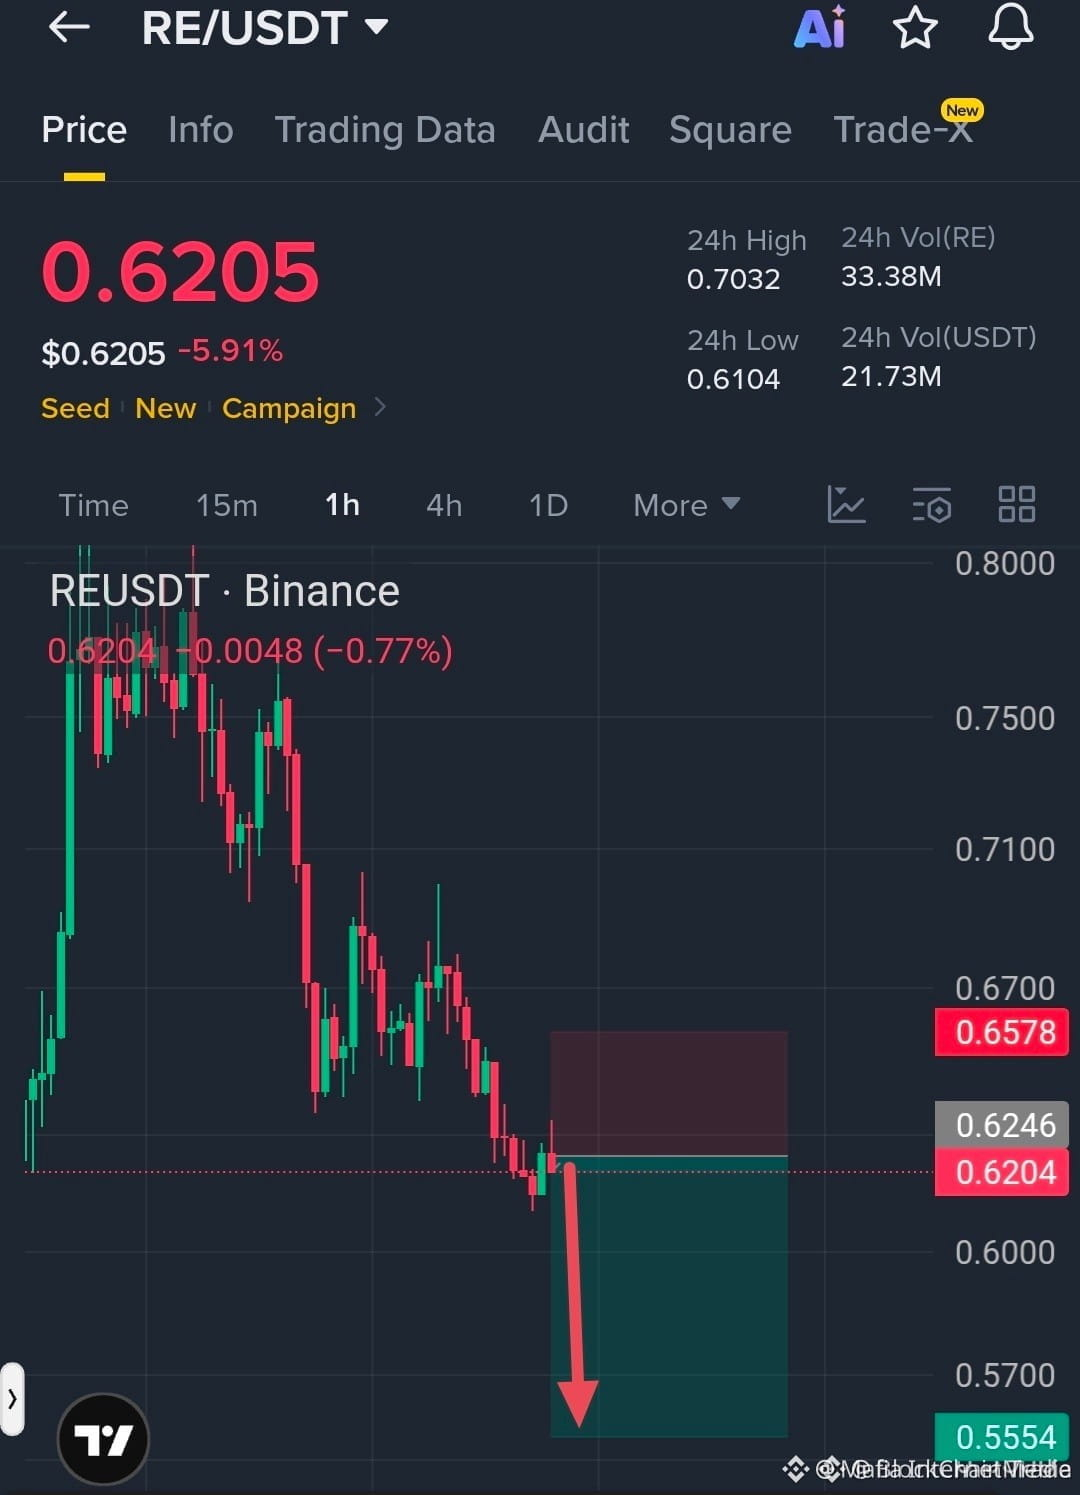
$RE JUST GOT REJECTED AT A KEY RESISTANCE ZONE — SHORT SETUP ACTIVE 🔥
Entry: 0.6200 – 0.6245 🔥
Target: 0.5950 🚀
Stop Loss: 0.6578 ⚠️
That reaction off the 0.6245 resistance was decisive. Sellers stepped in hard on the 4H and the volume spike confirms they're not letting this flip. The structure is clean — higher timeframe trend is still bearish and this rejection lines up perfectly with the last breakdown level.
TP2 at 0.5750 and TP3 at 0.5554 are sitting right below some old liquidity zones, so the move could extend if momentum carries. Are you catching this drop or waiting for a retest of the entry zone?
Not financial advice. Always manage your risk.
#RE #ShortSetup #CryptoBearish #ResistanceRejection
🔥
$RE JUST GOT REJECTED AT A KEY RESISTANCE ZONE — SHORT SETUP ACTIVE 🔥
Entry: 0.6200 – 0.6245 🔥
Target: 0.5950 🚀
Stop Loss: 0.6578 ⚠️
That reaction off the 0.6245 resistance was decisive. Sellers stepped in hard on the 4H and the volume spike confirms they're not letting this flip. The structure is clean — higher timeframe trend is still bearish and this rejection lines up perfectly with the last breakdown level.
TP2 at 0.5750 and TP3 at 0.5554 are sitting right below some old liquidity zones, so the move could extend if momentum carries. Are you catching this drop or waiting for a retest of the entry zone?
Not financial advice. Always manage your risk.
#RE #ShortSetup #CryptoBearish #ResistanceRejection
🔥
Entry: 0.6200 – 0.6245 🔥
Target: 0.5950 🚀
Stop Loss: 0.6578 ⚠️
That reaction off the 0.6245 resistance was decisive. Sellers stepped in hard on the 4H and the volume spike confirms they're not letting this flip. The structure is clean — higher timeframe trend is still bearish and this rejection lines up perfectly with the last breakdown level.
TP2 at 0.5750 and TP3 at 0.5554 are sitting right below some old liquidity zones, so the move could extend if momentum carries. Are you catching this drop or waiting for a retest of the entry zone?
Not financial advice. Always manage your risk.
#RE #ShortSetup #CryptoBearish #ResistanceRejection
🔥
1
2
455
·
--
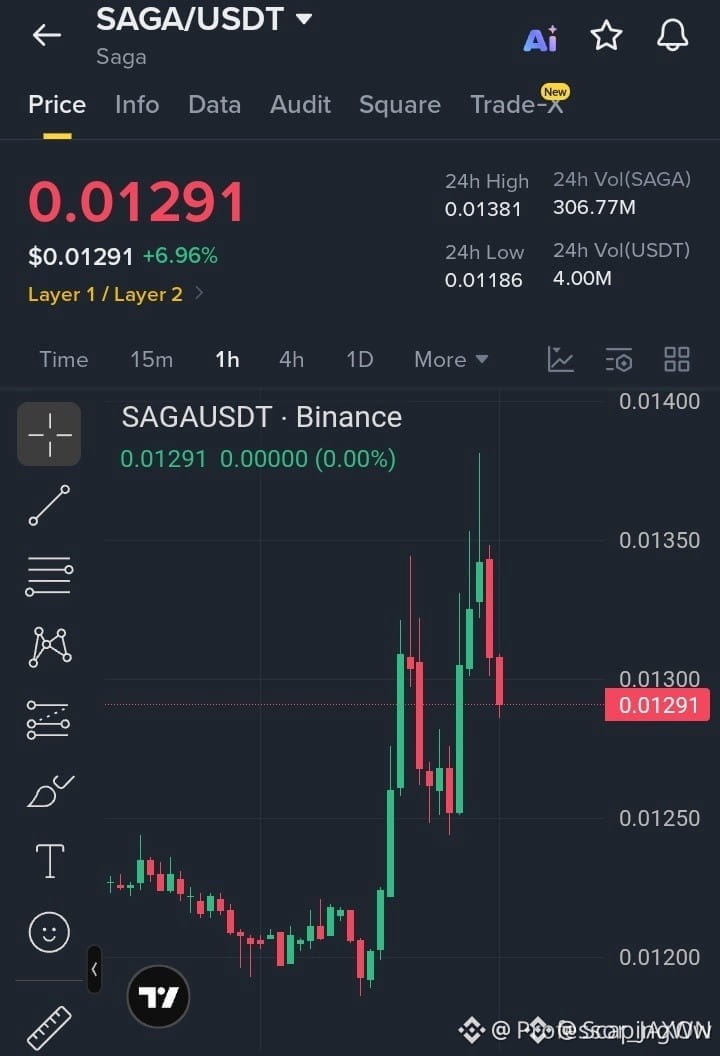
REJECTION AT RESISTANCE ON $SAGA – SHORT SETUP IN PLAY 📉
Entry: 0.01290 – 0.01310 🔥
Target: 0.01260 / 0.01230 / 0.01190 🚀
Stop Loss: 0.01355 ⚠️
Price hit the local resistance zone and got slapped back hard. That 1H rejection with bearish candles tells me sellers are still in control. If we can't reclaim above 0.0131 in the next few candles, the path to 0.0123 looks clean. Volume is drying up on the bounce.
The risk-to-reward on this zone is solid for a quick scalp. Are you taking the short here or waiting for a retest of the entry zone?
Not financial advice. Always manage your risk.
#SAGA #ShortSetup #Rejection #CryptoBearish
📉
REJECTION AT RESISTANCE ON $SAGA – SHORT SETUP IN PLAY 📉
Entry: 0.01290 – 0.01310 🔥
Target: 0.01260 / 0.01230 / 0.01190 🚀
Stop Loss: 0.01355 ⚠️
Price hit the local resistance zone and got slapped back hard. That 1H rejection with bearish candles tells me sellers are still in control. If we can't reclaim above 0.0131 in the next few candles, the path to 0.0123 looks clean. Volume is drying up on the bounce.
The risk-to-reward on this zone is solid for a quick scalp. Are you taking the short here or waiting for a retest of the entry zone?
Not financial advice. Always manage your risk.
#SAGA #ShortSetup #Rejection #CryptoBearish
📉
Entry: 0.01290 – 0.01310 🔥
Target: 0.01260 / 0.01230 / 0.01190 🚀
Stop Loss: 0.01355 ⚠️
Price hit the local resistance zone and got slapped back hard. That 1H rejection with bearish candles tells me sellers are still in control. If we can't reclaim above 0.0131 in the next few candles, the path to 0.0123 looks clean. Volume is drying up on the bounce.
The risk-to-reward on this zone is solid for a quick scalp. Are you taking the short here or waiting for a retest of the entry zone?
Not financial advice. Always manage your risk.
#SAGA #ShortSetup #Rejection #CryptoBearish
📉
26
$BEAT SHORT SETUP: THIS 4H TRAP IS ABOUT TO DROP HARD 🔥
Entry: 2.5925 - 2.6155 🔥
Target: 2.4529 - 2.3522 - 2.2011 🚀
Stop Loss: 2.8054 ⚠️
The daily chart had everyone frothing at the mouth, but the 4H is screaming fakeout. Smart money has been stacking liquidity right above current price — that kill zone is fully loaded and ready to flush.
Volume divergence is already showing on the lower timeframes, and the next move down should cascade through those targets fast. Are you fading this hype or waiting for the sweep to confirm?
Not financial advice. Always manage your risk.
#BEAT #ShortSetup #CryptoBearish #FadeTheHype
🔥
$BEAT SHORT SETUP: THIS 4H TRAP IS ABOUT TO DROP HARD 🔥
Entry: 2.5925 - 2.6155 🔥
Target: 2.4529 - 2.3522 - 2.2011 🚀
Stop Loss: 2.8054 ⚠️
The daily chart had everyone frothing at the mouth, but the 4H is screaming fakeout. Smart money has been stacking liquidity right above current price — that kill zone is fully loaded and ready to flush.
Volume divergence is already showing on the lower timeframes, and the next move down should cascade through those targets fast. Are you fading this hype or waiting for the sweep to confirm?
Not financial advice. Always manage your risk.
#BEAT #ShortSetup #CryptoBearish #FadeTheHype
🔥
Entry: 2.5925 - 2.6155 🔥
Target: 2.4529 - 2.3522 - 2.2011 🚀
Stop Loss: 2.8054 ⚠️
The daily chart had everyone frothing at the mouth, but the 4H is screaming fakeout. Smart money has been stacking liquidity right above current price — that kill zone is fully loaded and ready to flush.
Volume divergence is already showing on the lower timeframes, and the next move down should cascade through those targets fast. Are you fading this hype or waiting for the sweep to confirm?
Not financial advice. Always manage your risk.
#BEAT #ShortSetup #CryptoBearish #FadeTheHype
🔥

133

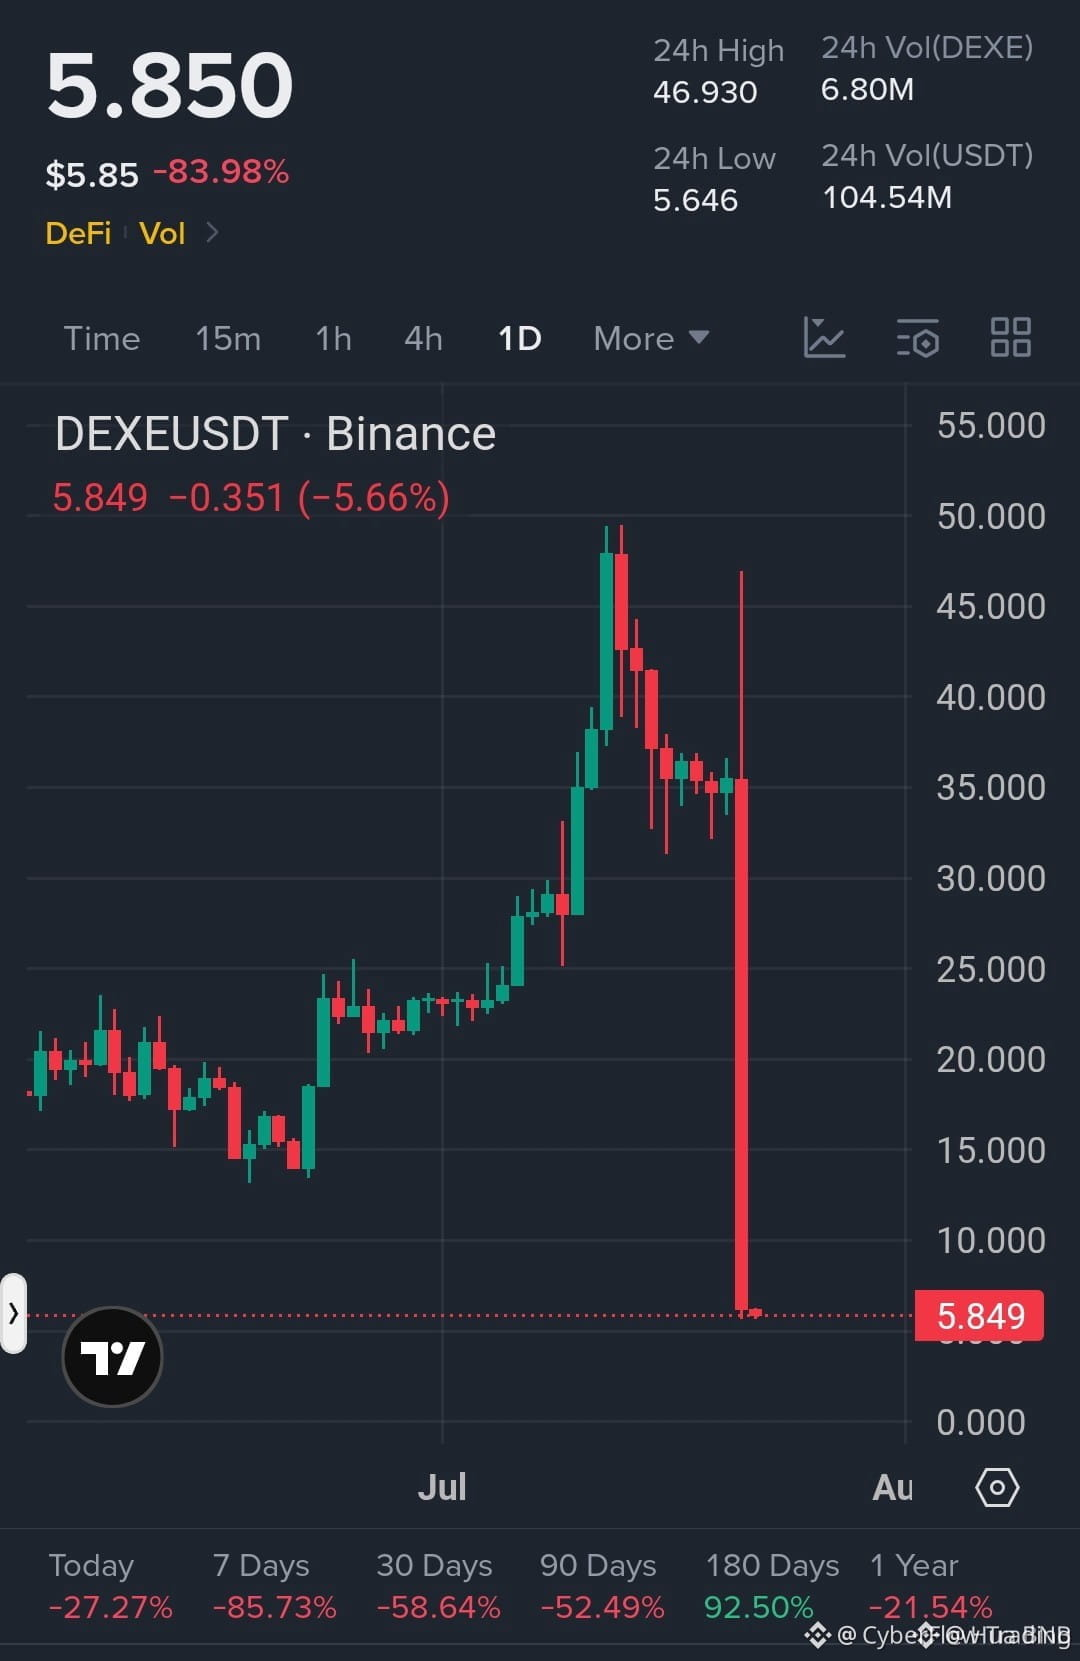
🚨 $DEXE JUST SWEPT LATE LONG LIQUIDITY — WHO’S READY FOR THE REAL MOVE? 🩸
📌 This isn’t a glitch — it’s a textbook liquidity hunt. $DEXE spiked high, trapped breakout chasers into heavy bids, then reversed to drain those same stop-loss zones. 🦈 Smart money collected premium before pulling the rug. Now price sits below the breakout neckline with volume drying up on retests — textbook distribution behavior. 🔍
💡 If you got caught, don’t revenge trade. Let the structure reset. The real play is waiting for a clean reclaim of the sweep zone or a breakdown below the next support cluster. 💬 Do you trust the bounce or do you see more pain ahead? 👇
⚠️ Not financial advice. Always manage your risk. 🛡️
🏷️ #DEXE #Trap #LiquiditySweep #CryptoBearish
🦈 💣
🚨 $DEXE JUST SWEPT LATE LONG LIQUIDITY — WHO’S READY FOR THE REAL MOVE? 🩸
📌 This isn’t a glitch — it’s a textbook liquidity hunt. $DEXE spiked high, trapped breakout chasers into heavy bids, then reversed to drain those same stop-loss zones. 🦈 Smart money collected premium before pulling the rug. Now price sits below the breakout neckline with volume drying up on retests — textbook distribution behavior. 🔍
💡 If you got caught, don’t revenge trade. Let the structure reset. The real play is waiting for a clean reclaim of the sweep zone or a breakdown below the next support cluster. 💬 Do you trust the bounce or do you see more pain ahead? 👇
⚠️ Not financial advice. Always manage your risk. 🛡️
🏷️ #DEXE #Trap #LiquiditySweep #CryptoBearish
🦈 💣
📌 This isn’t a glitch — it’s a textbook liquidity hunt. $DEXE spiked high, trapped breakout chasers into heavy bids, then reversed to drain those same stop-loss zones. 🦈 Smart money collected premium before pulling the rug. Now price sits below the breakout neckline with volume drying up on retests — textbook distribution behavior. 🔍
💡 If you got caught, don’t revenge trade. Let the structure reset. The real play is waiting for a clean reclaim of the sweep zone or a breakdown below the next support cluster. 💬 Do you trust the bounce or do you see more pain ahead? 👇
⚠️ Not financial advice. Always manage your risk. 🛡️
🏷️ #DEXE #Trap #LiquiditySweep #CryptoBearish
🦈 💣
3
384

·
--

ලිපිය
How to trade with a Momentum Indicator#HowToTrade #TradingMadeEasy #momentum #cryptobearish #MarketExperts
$USDC $BTC $ETH
How to Trade with a Momentum Indicator
The momentum oscillator (MOM) is a vital instrument in the trader's toolkit. Designed to measure the velocity of asset price changes, it serves as a compass for traders, pointing them towards prevailing market trends. By analysing this indicator, traders can gain insights that allow them to seize budding opportunities in volatile markets. Keep reading to broaden your understanding and elevate your momentum indicator strategies.
Momentum Technical Analysis
Momentum technical analysis is a crucial aspect of understanding the financial markets. Traders and investors rely on momentum tools to identify potential trends and make trading decisions.
What Is a Momentum Technical Indicator?
While the term "momentum" is often tossed around in financial circles, its technical significance is profound. Momentum indicators are a class of technical analysis tools that quantify the strength and direction of market trends. They help traders and investors identify potential reversal points, overbought or oversold conditions, and the continuation of existing trends. These tools are based on the principle that price trends often exhibit momentum before they reverse or continue. However, there is also such a thing as a momentum oscillator.
Momentum Oscillator
The momentum indicator or oscillator (MOM) is a technical analysis tool that’s available on most trading platforms, including services like FXOpen’s TickTrader. It’s one of the best momentum indicators. The MOM displays the speed of change in a financial instrument's price over a specific time frame. You can apply the momentum indicator to forex, stock, commodity, and crypto* markets.
MOM formula = (Current Close/Close N Periods Ago)*100
By default, the indicator is set to 10 periods, but traders can easily change this in the settings tab. The calculated values are plotted below the trading chart as a single line that moves near the 0 line. If today's price is the same as it was 10 days ago, the indicator's value is plotted on the zero line. If today's price is higher than it was 10 days ago, the indicator plots above the line, and vice versa.
When trading stocks, the momentum indicator typically fluctuates between +/- 20, while for forex pairs, its range is more like +/- 0.02. The chart below provides an example of how the momentum oscillator is used on a daily GBP/USD chart.
How to Use the Momentum Oscillator
Here's a breakdown of the procedure for using the momentum indicator in trading:
Tapping into the potential of the MOM is quite straightforward. For those who swear by Meta Trader, it's as easy as venturing into the oscillators section to access the momentum indicator on MT4 or MT5. For Tick Trader enthusiasts, a quick search on the list of indicators should yield the built-in MOM.
1. Zero-Line Crossover
Keeping an eye on the MOM indicator when it crosses the zero line is the most straightforward and fundamental trading technique. An upward momentum (with values above the midpoint) often suggests a potential buy signal, implying the asset is likely to continue its upward movement. Conversely, when the MOM consistently hovers below the midpoint, it indicates a sell cue, hinting at a possible continuation of the asset's downward trajectory.
Take, for instance, the GBP/USD pair. As the pair spirals downward, a consistent position below zero signals a dominant momentum steering, it further down and vice versa.
2. Divergence Trading Momentum Oscillator
The momentum oscillator is instrumental in pinpointing divergences on a chart. Essentially, a divergence arises when there's a discrepancy between the market movement and the MOM, akin to top momentum indicators like the Stochastic or RSI. It often hints at a forthcoming shift in market direction.
There are primarily two forms of divergences:
- Classic (Regular): This is used to anticipate potential trend reversals.
- Hidden: This aids in identifying the likely continuation of existing trends.
For instance, in the GBP/USD chart, we notice a hidden bullish divergence pointing to the trend's continuation and a classic bullish divergence pointing to a trend reversal.
3. Extreme Readings
Extreme readings in momentum indicators can provide valuable insights for traders by indicating potential overbought or oversold market conditions. As the momentum oscillator is unbounded, it’s harder to identify overbought and oversold conditions compared to the RSI or the Stochastic oscillator.
To do this, a trader needs to compare recent highs and lows. If the oscillator reaches a significant peak, the asset can be considered overbought and may fall soon. Conversely, if the oscillator falls to noticeable lows, the asset may be oversold and may rise soon.
In the chart above, the momentum oscillator reached a significant high, following the uptrend in the EURGBP pair. After that, the price moved down.
When using the momentum oscillator, traders incorporate additional technical indicators and filters to avoid overtrading and reduce market noise.
How to Combine the MOM with Other Technical Analysis Tools
By incorporating a 200-period EMA on the chart along with the MOM, we can discern the overarching market trend. A price positioned above the 200-period EMA is indicative of an uptrend, prompting traders to scout for bullish signals on the MOM. On the flip side, a price below this suggests a downtrend, warranting a lookout for bearish signals.
For instance, in the GBP/USD chart, we notice an upward market trajectory marked by two bullish divergence signals: a hidden one pointing to the trend's continuation and a classic one pointing to the trend’s reversal.
Conclusion
To succeed in trading, finding financial assets with momentum is key. The momentum indicator can help traders identify these assets before they make big moves, but it's important to remember that it’s not foolproof. Other technical and fundamental analysis tools are often used to evaluate market trends. To start utilising the MOM and many other tools, consider opening an FXOpen account.
How to trade with a Momentum Indicator
#HowToTrade #TradingMadeEasy #momentum #cryptobearish #MarketExperts
$USDC $BTC $ETH
How to Trade with a Momentum Indicator
The momentum oscillator (MOM) is a vital instrument in the trader's toolkit. Designed to measure the velocity of asset price changes, it serves as a compass for traders, pointing them towards prevailing market trends. By analysing this indicator, traders can gain insights that allow them to seize budding opportunities in volatile markets. Keep reading to broaden your understanding and elevate your momentum indicator strategies.
Momentum Technical Analysis
Momentum technical analysis is a crucial aspect of understanding the financial markets. Traders and investors rely on momentum tools to identify potential trends and make trading decisions.
What Is a Momentum Technical Indicator?
While the term "momentum" is often tossed around in financial circles, its technical significance is profound. Momentum indicators are a class of technical analysis tools that quantify the strength and direction of market trends. They help traders and investors identify potential reversal points, overbought or oversold conditions, and the continuation of existing trends. These tools are based on the principle that price trends often exhibit momentum before they reverse or continue. However, there is also such a thing as a momentum oscillator.
Momentum Oscillator
The momentum indicator or oscillator (MOM) is a technical analysis tool that’s available on most trading platforms, including services like FXOpen’s TickTrader. It’s one of the best momentum indicators. The MOM displays the speed of change in a financial instrument's price over a specific time frame. You can apply the momentum indicator to forex, stock, commodity, and crypto* markets.
MOM formula = (Current Close/Close N Periods Ago)*100
By default, the indicator is set to 10 periods, but traders can easily change this in the settings tab. The calculated values are plotted below the trading chart as a single line that moves near the 0 line. If today's price is the same as it was 10 days ago, the indicator's value is plotted on the zero line. If today's price is higher than it was 10 days ago, the indicator plots above the line, and vice versa.
When trading stocks, the momentum indicator typically fluctuates between +/- 20, while for forex pairs, its range is more like +/- 0.02. The chart below provides an example of how the momentum oscillator is used on a daily GBP/USD chart.
How to Use the Momentum Oscillator
Here's a breakdown of the procedure for using the momentum indicator in trading:
Tapping into the potential of the MOM is quite straightforward. For those who swear by Meta Trader, it's as easy as venturing into the oscillators section to access the momentum indicator on MT4 or MT5. For Tick Trader enthusiasts, a quick search on the list of indicators should yield the built-in MOM.
1. Zero-Line Crossover
Keeping an eye on the MOM indicator when it crosses the zero line is the most straightforward and fundamental trading technique. An upward momentum (with values above the midpoint) often suggests a potential buy signal, implying the asset is likely to continue its upward movement. Conversely, when the MOM consistently hovers below the midpoint, it indicates a sell cue, hinting at a possible continuation of the asset's downward trajectory.
Take, for instance, the GBP/USD pair. As the pair spirals downward, a consistent position below zero signals a dominant momentum steering, it further down and vice versa.
2. Divergence Trading Momentum Oscillator
The momentum oscillator is instrumental in pinpointing divergences on a chart. Essentially, a divergence arises when there's a discrepancy between the market movement and the MOM, akin to top momentum indicators like the Stochastic or RSI. It often hints at a forthcoming shift in market direction.
There are primarily two forms of divergences:
- Classic (Regular): This is used to anticipate potential trend reversals.
- Hidden: This aids in identifying the likely continuation of existing trends.
For instance, in the GBP/USD chart, we notice a hidden bullish divergence pointing to the trend's continuation and a classic bullish divergence pointing to a trend reversal.
3. Extreme Readings
Extreme readings in momentum indicators can provide valuable insights for traders by indicating potential overbought or oversold market conditions. As the momentum oscillator is unbounded, it’s harder to identify overbought and oversold conditions compared to the RSI or the Stochastic oscillator.
To do this, a trader needs to compare recent highs and lows. If the oscillator reaches a significant peak, the asset can be considered overbought and may fall soon. Conversely, if the oscillator falls to noticeable lows, the asset may be oversold and may rise soon.
In the chart above, the momentum oscillator reached a significant high, following the uptrend in the EURGBP pair. After that, the price moved down.
When using the momentum oscillator, traders incorporate additional technical indicators and filters to avoid overtrading and reduce market noise.
How to Combine the MOM with Other Technical Analysis Tools
By incorporating a 200-period EMA on the chart along with the MOM, we can discern the overarching market trend. A price positioned above the 200-period EMA is indicative of an uptrend, prompting traders to scout for bullish signals on the MOM. On the flip side, a price below this suggests a downtrend, warranting a lookout for bearish signals.
For instance, in the GBP/USD chart, we notice an upward market trajectory marked by two bullish divergence signals: a hidden one pointing to the trend's continuation and a classic one pointing to the trend’s reversal.
Conclusion
To succeed in trading, finding financial assets with momentum is key. The momentum indicator can help traders identify these assets before they make big moves, but it's important to remember that it’s not foolproof. Other technical and fundamental analysis tools are often used to evaluate market trends. To start utilising the MOM and many other tools, consider opening an FXOpen account.
$USDC $BTC $ETH
How to Trade with a Momentum Indicator
The momentum oscillator (MOM) is a vital instrument in the trader's toolkit. Designed to measure the velocity of asset price changes, it serves as a compass for traders, pointing them towards prevailing market trends. By analysing this indicator, traders can gain insights that allow them to seize budding opportunities in volatile markets. Keep reading to broaden your understanding and elevate your momentum indicator strategies.
Momentum Technical Analysis
Momentum technical analysis is a crucial aspect of understanding the financial markets. Traders and investors rely on momentum tools to identify potential trends and make trading decisions.
What Is a Momentum Technical Indicator?
While the term "momentum" is often tossed around in financial circles, its technical significance is profound. Momentum indicators are a class of technical analysis tools that quantify the strength and direction of market trends. They help traders and investors identify potential reversal points, overbought or oversold conditions, and the continuation of existing trends. These tools are based on the principle that price trends often exhibit momentum before they reverse or continue. However, there is also such a thing as a momentum oscillator.
Momentum Oscillator
The momentum indicator or oscillator (MOM) is a technical analysis tool that’s available on most trading platforms, including services like FXOpen’s TickTrader. It’s one of the best momentum indicators. The MOM displays the speed of change in a financial instrument's price over a specific time frame. You can apply the momentum indicator to forex, stock, commodity, and crypto* markets.
MOM formula = (Current Close/Close N Periods Ago)*100
By default, the indicator is set to 10 periods, but traders can easily change this in the settings tab. The calculated values are plotted below the trading chart as a single line that moves near the 0 line. If today's price is the same as it was 10 days ago, the indicator's value is plotted on the zero line. If today's price is higher than it was 10 days ago, the indicator plots above the line, and vice versa.
When trading stocks, the momentum indicator typically fluctuates between +/- 20, while for forex pairs, its range is more like +/- 0.02. The chart below provides an example of how the momentum oscillator is used on a daily GBP/USD chart.
How to Use the Momentum Oscillator
Here's a breakdown of the procedure for using the momentum indicator in trading:
Tapping into the potential of the MOM is quite straightforward. For those who swear by Meta Trader, it's as easy as venturing into the oscillators section to access the momentum indicator on MT4 or MT5. For Tick Trader enthusiasts, a quick search on the list of indicators should yield the built-in MOM.
1. Zero-Line Crossover
Keeping an eye on the MOM indicator when it crosses the zero line is the most straightforward and fundamental trading technique. An upward momentum (with values above the midpoint) often suggests a potential buy signal, implying the asset is likely to continue its upward movement. Conversely, when the MOM consistently hovers below the midpoint, it indicates a sell cue, hinting at a possible continuation of the asset's downward trajectory.
Take, for instance, the GBP/USD pair. As the pair spirals downward, a consistent position below zero signals a dominant momentum steering, it further down and vice versa.
2. Divergence Trading Momentum Oscillator
The momentum oscillator is instrumental in pinpointing divergences on a chart. Essentially, a divergence arises when there's a discrepancy between the market movement and the MOM, akin to top momentum indicators like the Stochastic or RSI. It often hints at a forthcoming shift in market direction.
There are primarily two forms of divergences:
- Classic (Regular): This is used to anticipate potential trend reversals.
- Hidden: This aids in identifying the likely continuation of existing trends.
For instance, in the GBP/USD chart, we notice a hidden bullish divergence pointing to the trend's continuation and a classic bullish divergence pointing to a trend reversal.
3. Extreme Readings
Extreme readings in momentum indicators can provide valuable insights for traders by indicating potential overbought or oversold market conditions. As the momentum oscillator is unbounded, it’s harder to identify overbought and oversold conditions compared to the RSI or the Stochastic oscillator.
To do this, a trader needs to compare recent highs and lows. If the oscillator reaches a significant peak, the asset can be considered overbought and may fall soon. Conversely, if the oscillator falls to noticeable lows, the asset may be oversold and may rise soon.
In the chart above, the momentum oscillator reached a significant high, following the uptrend in the EURGBP pair. After that, the price moved down.
When using the momentum oscillator, traders incorporate additional technical indicators and filters to avoid overtrading and reduce market noise.
How to Combine the MOM with Other Technical Analysis Tools
By incorporating a 200-period EMA on the chart along with the MOM, we can discern the overarching market trend. A price positioned above the 200-period EMA is indicative of an uptrend, prompting traders to scout for bullish signals on the MOM. On the flip side, a price below this suggests a downtrend, warranting a lookout for bearish signals.
For instance, in the GBP/USD chart, we notice an upward market trajectory marked by two bullish divergence signals: a hidden one pointing to the trend's continuation and a classic one pointing to the trend’s reversal.
Conclusion
To succeed in trading, finding financial assets with momentum is key. The momentum indicator can help traders identify these assets before they make big moves, but it's important to remember that it’s not foolproof. Other technical and fundamental analysis tools are often used to evaluate market trends. To start utilising the MOM and many other tools, consider opening an FXOpen account.
1
1.2k
තවත් අන්තර්ගතයන් ගවේෂණය කිරීමට ඇතුල් වන්න
Binance චතුරශ්රය හි ගෝලීය ක්රිප්ටෝ පරිශීලකයින් හා එක්වන්න
⚡️ ක්රිප්ටෝ පිළිබඳ නවතම සහ ප්රයෝජනවත් තොරතුරු ලබා ගන්න.
💬 ලොව විශාලතම ක්රිප්ටෝ හුවමාරුව මගින් විශ්වාස කෙරේ.
👍 සත්යායනය කරන ලද නිර්මාණකරුවන්ගෙන් සැබෑ විදසුන් සොයා ගන්න.
විද්යුත් තැපෑල / දුරකථන අංකය
නැගී එන මාතෘකා
1
#WhatWillDriveCryptoandStocks’NextRebound?
3,526 නැරඹීම්
119 සාකච්ඡා කරමින්
2
#Anthropic’s6xIPODemandSignalsPotentialRecordRaise
1,029 නැරඹීම්
51 සාකච්ඡා කරමින්
3
#HuangExitNvidiaStrategyInFocus
134,908 නැරඹීම්
1,343 සාකච්ඡා කරමින්
4
#AnthropicRejectsIPODelayValuationinQuestion
749,023 නැරඹීම්
5,525 සාකච්ඡා කරමින්
5
#HedgeFundsCMEBitcoinNetShortsFall89%
6,945 නැරඹීම්
108 සාකච්ඡා කරමින්
6
#BitMineReports$6.3BNetLossForFiscal2026
18,375 නැරඹීම්
157 සාකච්ඡා කරමින්
7
#TradFiForBeginners
546,872 නැරඹීම්
3,813 සාකච්ඡා කරමින්
8
#SoFiExpandsSoFiUSDStablecoinToPolygon
5,273 නැරඹීම්
89 සාකච්ඡා කරමින්
9
#TetherGoldXAUTCompletesKPMGAudit
7,268 නැරඹීම්
99 සාකච්ඡා කරමින්
10
#ChipStocksExtendLossesAfterNvidiaCEOChange
50,638 නැරඹීම්
526 සාකච්ඡා කරමින්